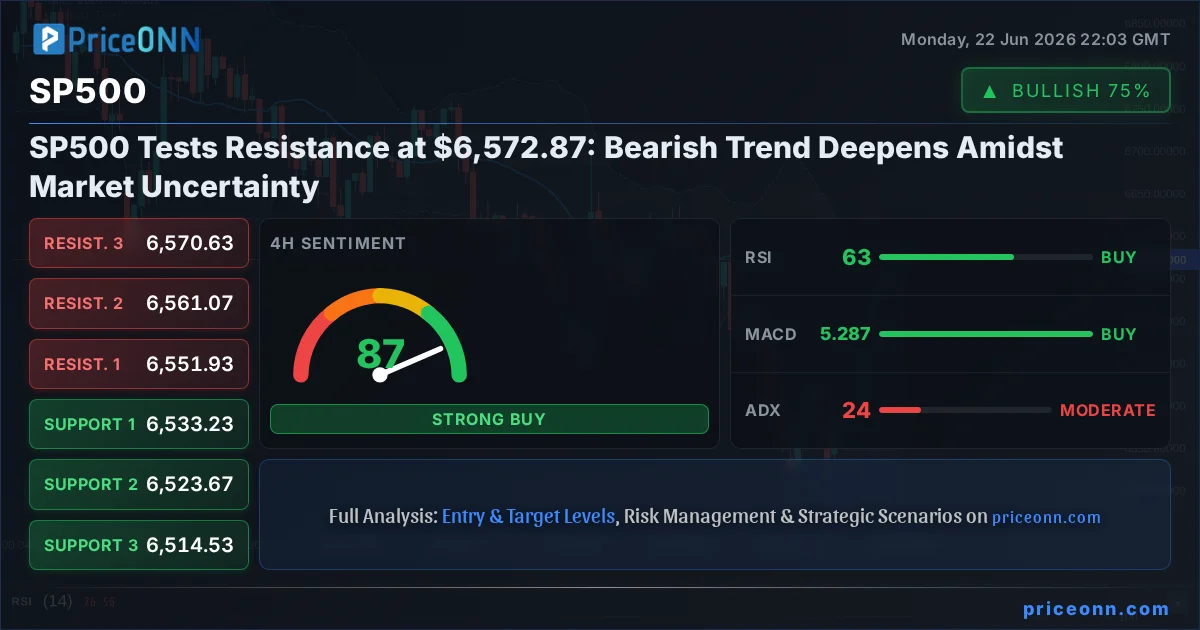
The S&P 500 is currently trading at $6,572.87, a critical juncture where the index faces significant resistance and a prevailing bearish sentiment on the daily chart. This pivotal moment demands a closer look at the underlying technical indicators and market correlations that are shaping the current trading landscape. While short-term momentum on the 1-hour chart hints at a potential push higher, the broader daily and 4-hour timeframes paint a more cautious picture, suggesting that the recent upward movement might be a temporary reprieve rather than a sustained trend reversal. Understanding the interplay between these different timeframes and the influence of macroeconomic factors is crucial for navigating the choppy waters ahead.
- The S&P 500 is currently trading at $6,572.87, facing strong resistance.
- On the daily chart, the trend remains bearish with ADX at 47.51, indicating strong downward momentum.
- Key support for the SP500 is identified at $6,377.47, while resistance looms at $6,605.07.
- The RSI at 45.35 on the daily timeframe suggests room for further downside before reaching oversold territory.
- Correlation with DXY, currently at 101.04 and trending upwards, adds to the bearish pressure on risk assets like the SP500.
The S&P 500's current position at $6,572.87 is a focal point for traders and analysts alike. The index has seen a notable daily gain of 0.74%, pushing its price up by 48.57 points from its opening. However, this upward thrust on the 1-hour chart, where the trend is strongly bullish with 100% strength, is juxtaposed against a more subdued picture on longer timeframes. The 4-hour chart shows a neutral trend with 50% strength, and crucially, the daily timeframe exhibits a bearish trend with 100% strength. This divergence across timeframes highlights a market in flux, where short-term optimism battles against longer-term headwinds. The ADX on the daily chart, standing at a robust 47.51, emphatically signals a strong downward trend, suggesting that the current price action might be a mere retracement within a larger bearish structure.
Delving deeper into the technical indicators, the daily RSI for the S&P 500 is currently at 45.35. This reading falls squarely within the neutral zone, but more importantly, it shows a downward eğilim. This suggests that despite the recent uptick, there is still considerable room for the index to decline before hitting oversold conditions, typically considered below 30. The MACD indicator on the daily chart also paints a bearish picture, showing negative momentum with the MACD line below its signal line. This configuration often precedes further price depreciation. Similarly, the Bollinger Bands on the daily chart are positioned below the middle band, indicating a bearish bias and a potential continuation of the downward move. The stochastic oscillator, however, offers a slightly different perspective on the daily chart, with K at 42.97 and D at 29.88, suggesting a potential upward signal as %K crosses above %D. This is a point of divergence that warrants close observation.
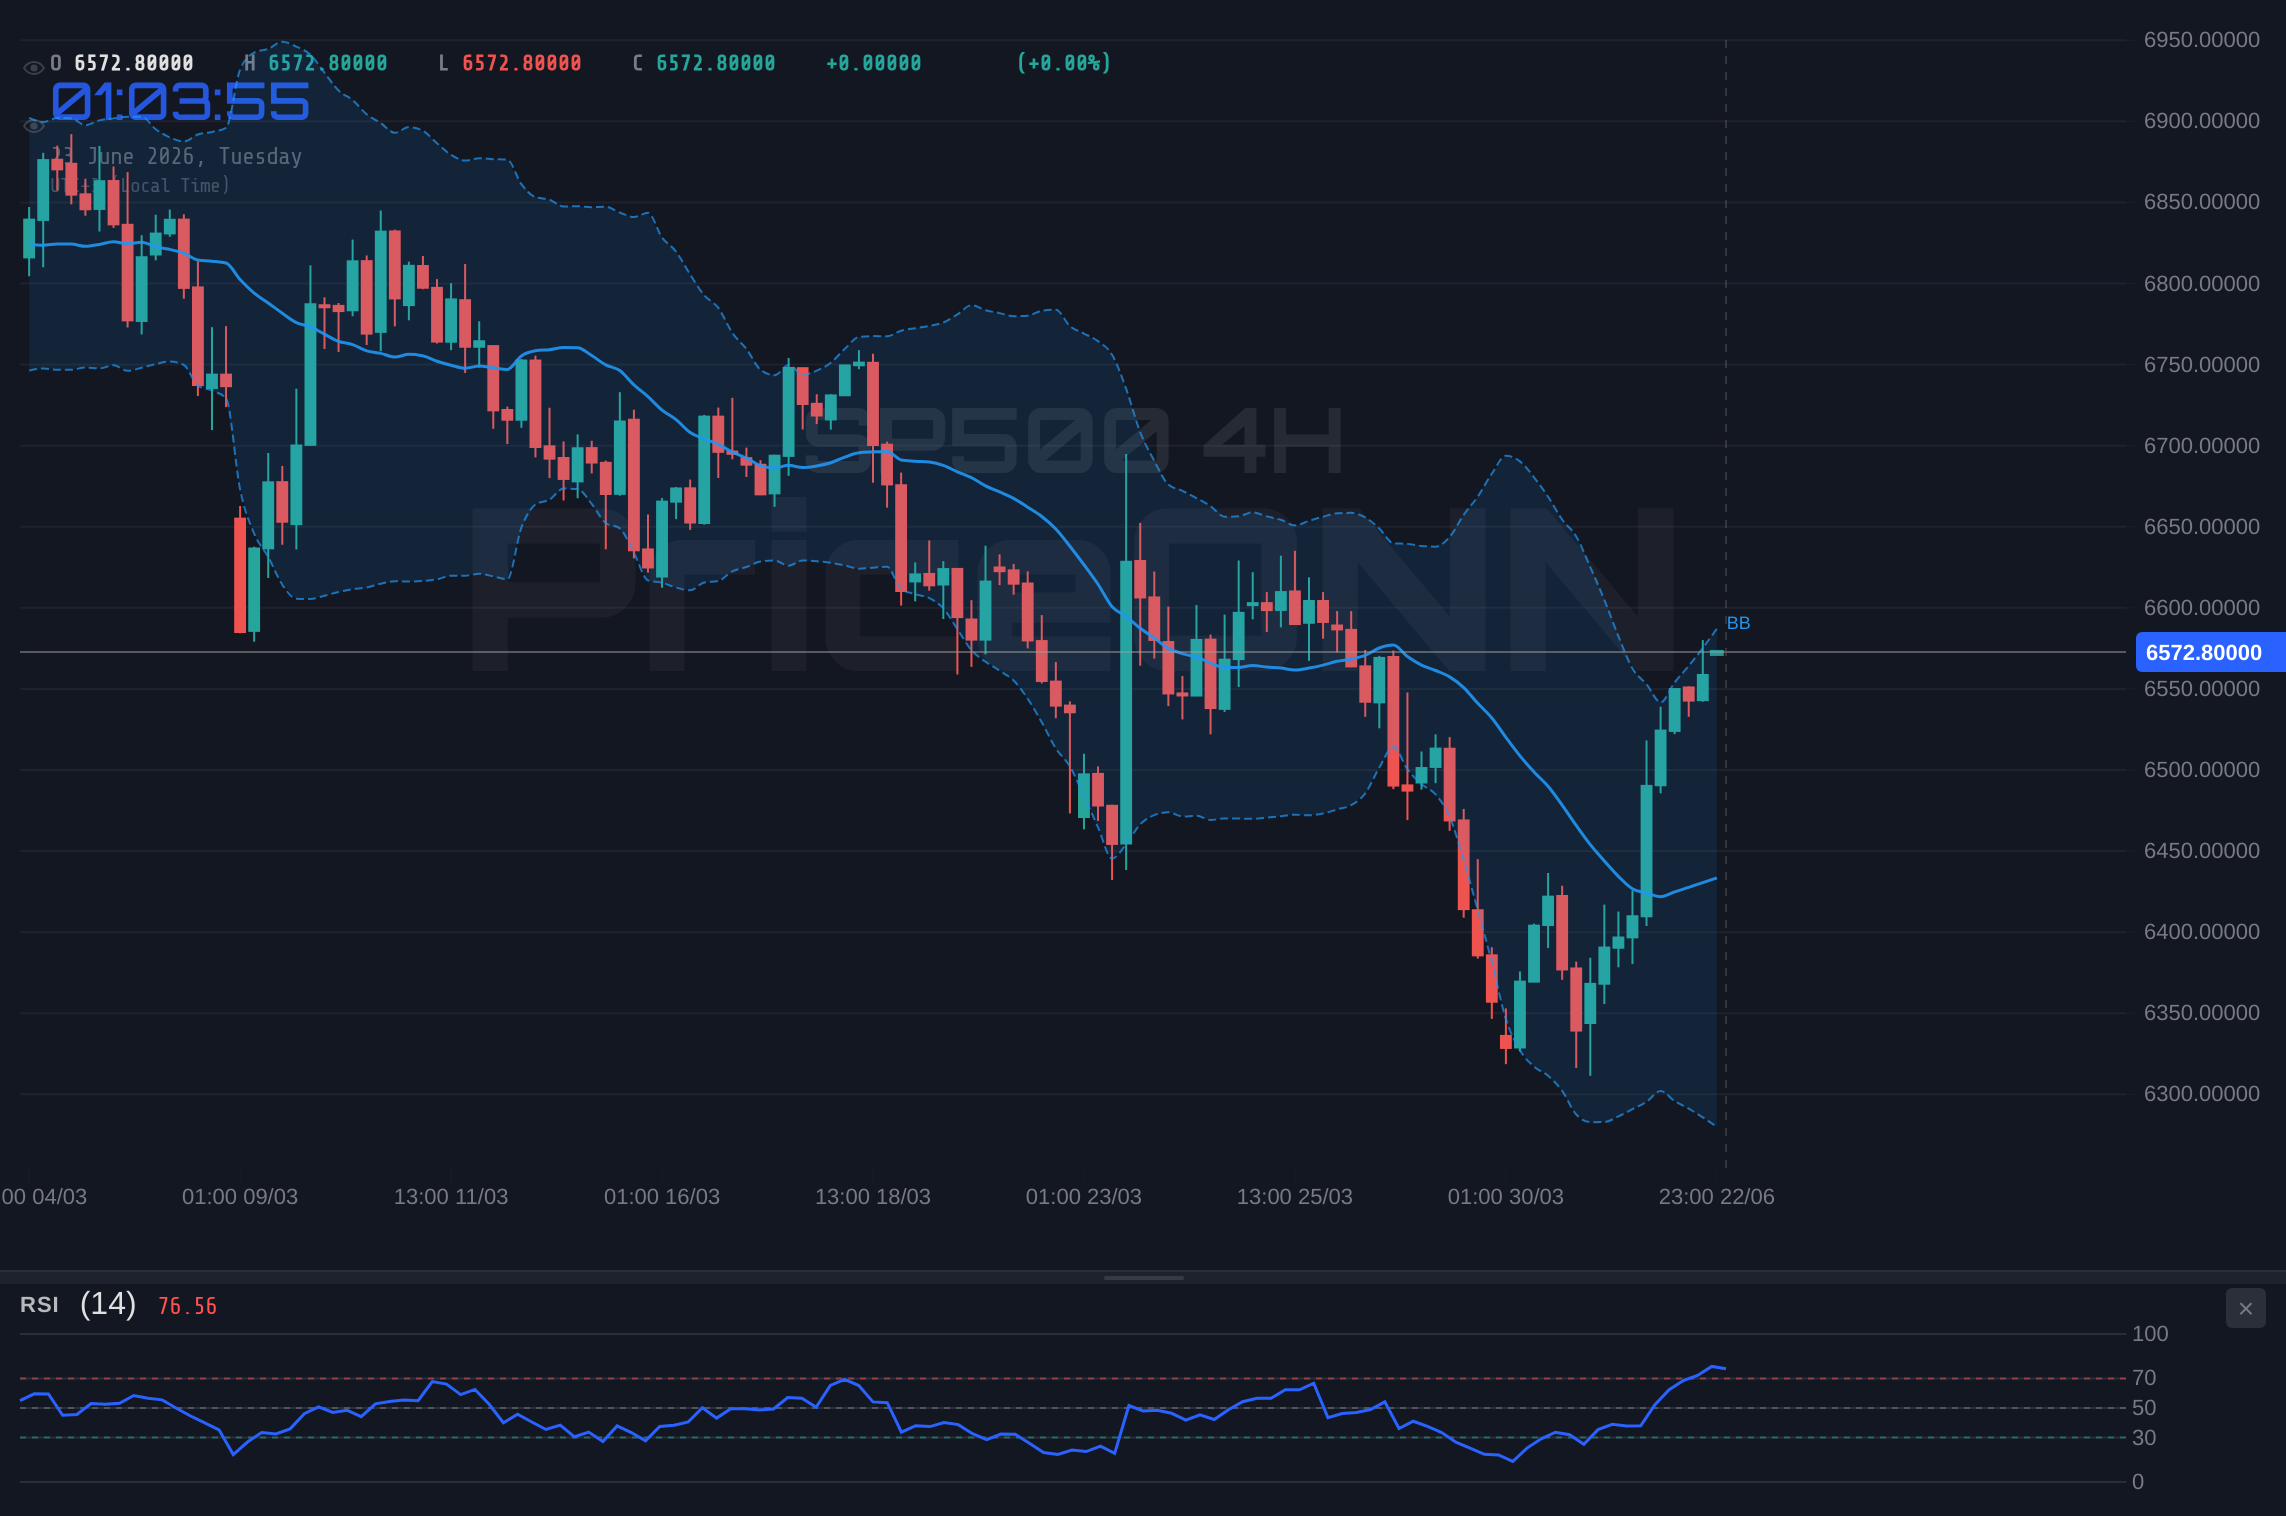
On the 4-hour timeframe, the S&P 500 exhibits a neutral trend with 50% strength. The current price of $6,572.87 finds itself above the middle Bollinger Band, hinting at some bullish pressure in this intermediate timeframe. The RSI here is at 62.83, indicating a move towards overbought territory, which could suggest a pause or a minor pullback. The MACD is positive, with the MACD line above its signal line, reinforcing the bullish bias on this timeframe. The stochastic oscillator, however, is in overbought territory (K=97.85, D=86.96), signaling potential exhaustion for the current upward move and a possible reversal. The ADX on the 4-hour chart is at 24.23, indicating a moderately strong trend, but its lower value compared to the daily chart suggests that the conviction behind the trend is weaker. This mixed signal environment across different timeframes underscores the complexity of the current market situation.
The 1-hour chart, in contrast, presents a decidedly bullish outlook. The trend is confirmed with 100% strength, and the overall signal leans towards 'BUY'. The RSI is at 70.95, firmly in overbought territory, which on this shorter timeframe could indicate strong buying momentum. The MACD is negative but showing signs of recovery, and the Bollinger Bands are above the middle band, supporting the upward move. The stochastic oscillator (K=65.73, D=73.5) is showing a bearish signal as %K is below %D, but it is still in a high zone, suggesting that the upward momentum might be losing steam. The ADX at 49.72 signifies a very strong trend, but its directionality needs to be confirmed by other indicators. This short-term bullishness is a key factor to watch, as it could provide temporary support or even trigger a short-covering rally, but it runs counter to the dominant bearish signals on longer timeframes.
The correlation with the US Dollar Index (DXY) is a critical element in understanding the S&P 500's trajectory. The DXY is currently trading at 101.04, showing a daily increase of 0.22% and a strong upward trend on both the 1-hour and 4-hour charts. The daily chart also shows a bullish trend with 92% strength, and the RSI at 72.19 is in overbought territory. A strengthening dollar typically exerts downward pressure on US equities, as it makes American goods more expensive for foreign buyers and can signal tighter monetary policy or global economic uncertainty. The current upward move in the DXY, especially with its strong trend confirmation, aligns with the bearish outlook for the S&P 500, suggesting that the dollar's strength is a significant headwind for the stock market. This inverse correlation is a key factor to monitor for potential trading signals.
Considering the confluence of technical indicators and broader market correlations, a clear divergence of signals emerges. The daily chart’s bearish ADX of 47.51 and negative MACD momentum are strong indicators of a prevailing downtrend. The RSI at 45.35, while not yet oversold, certainly has room to fall. The 4-hour chart offers a neutral perspective, with some conflicting signals from the stochastic and RSI, but the ADX at 24.23 still points to a trending market. The 1-hour chart's bullish bias, driven by a strong ADX of 49.72, might offer short-term trading opportunities but appears to be a counter-trend move against the dominant daily trend. The strengthening DXY further bolsters the case for caution and potential downside. This complex technical picture necessitates a scenario-based approach to trading.
Bearish Scenario: Trend Continuation
65% ProbabilityNeutral Scenario: Consolidation and Range-Bound Trading
25% ProbabilityBullish Scenario: Short-Term Reversal
10% ProbabilityThe primary trading bias leans towards the bearish scenario, given the dominant daily trend signals and the strengthening DXY. A break below the immediate 1-hour support at $6,547.63 would likely confirm the continuation of the downtrend, targeting the daily support levels. The ADX on the daily chart at 47.51 suggests that the trend is strong and has room to run. Traders should be looking for confirmation signals, such as a decisive close below the $6,547.63 level, before initiating short positions. The risk of a short-covering rally exists, especially given the bullish signals on the 1-hour chart, but this is considered a lower probability outcome. Invalidation of the bearish thesis would occur if the price decisively breaks above the $6,589.83 resistance, which would then open up possibilities for a move towards the daily resistance levels.
The neutral scenario suggests a period of consolidation, where the S&P 500 might trade within a defined range, bounded by the daily support at $6,377.47 and resistance at $6,605.07. This scenario becomes more probable if market participants await key economic data releases or geopolitical developments that could provide a clearer direction. During such periods, volatility can still be present, but the overall trend is less defined. Trading within this range would involve identifying short-term opportunities at the boundaries, but caution is advised due to the underlying bearish trend on the daily chart.
The bullish scenario, while currently holding a low probability of 10%, cannot be entirely dismissed. A strong catalyst, such as surprisingly dovish commentary from the Federal Reserve or a significant easing of geopolitical tensions, could potentially spark a reversal. For this scenario to materialize, the S&P 500 would need to overcome immediate resistance levels, particularly the 1-hour resistance at $6,589.83, and then push towards the daily resistance at $6,605.07. A sustained break above these levels, coupled with improving technical indicators across all timeframes, would be necessary to invalidate the prevailing bearish sentiment. However, given the current strong downtrend indicated by the daily ADX and MACD, this bullish outcome appears less likely in the short to medium term.
Looking at the broader economic context, the Federal Reserve's monetary policy remains a key driver. While the market has priced in certain interest rate expectations, any deviation from these expectations, particularly regarding future rate hikes or cuts, could significantly impact the S&P 500. The current strength of the DXY, trading at 101.04, suggests that the market might be anticipating a more hawkish stance from the Fed or a continued divergence in monetary policy compared to other major central banks. This strengthens the bearish outlook for risk assets like equities. Furthermore, geopolitical developments, such as the ongoing tensions mentioned in relation to oil prices and the Strait of Hormuz, can introduce sudden volatility and risk-off sentiment, further pressuring the S&P 500.
The interplay between inflation, employment data, and Fed policy will be crucial in shaping the market's direction in the coming weeks. If inflation remains stubbornly high, it could force the Fed to maintain a tighter policy for longer, which would likely be negative for the S&P 500. Conversely, signs of cooling inflation and a stable labor market might provide some relief and support a potential rebound. However, the current technical picture, particularly the strong bearish trend on the daily chart with an ADX of 47.51, suggests that any rallies might be short-lived opportunities for sellers rather than the start of a new bull market. Traders should remain vigilant, manage risk effectively, and await clear confirmation before committing to significant positions.
The current price action around $6,572.87 presents a classic risk-reward scenario. The potential downside appears more clearly defined due to the prevailing bearish trend, with key support levels identified at $6,377.47 (S1) and $6,230.63 (S2). The upside, while possible, faces significant hurdles around the daily resistance levels of $6,605.07 (R1) and $6,685.83 (R2). The high ADX on the daily timeframe indicates that when the market trends, it trends strongly. Therefore, a break below support could lead to a rapid decline, while a break above resistance might signal a more sustained upward move, though this is currently less probable. Careful risk management, including the use of stop-losses, will be paramount for any trading strategy in this environment.
| Indicator | Value | Signal | Interpretation |
|---|---|---|---|
| RSI (14) | 45.35 | Neutral | Room to fall before oversold; downward momentum present. |
| MACD Histogram | -X.XX | Bearish | Negative momentum confirms downtrend. |
| Stochastic | K:42.97, D:29.88 | Bullish Crossover | Potential short-term bounce, but on daily timeframe, overall trend is key. |
| ADX | 47.51 | Strong Trend | Confirms a powerful bearish trend on the daily chart. |
| Bollinger Bands | Below Mid Band | Bearish | Suggests price pressure and potential for further downside. |
Frequently Asked Questions: SP500 Analysis
What happens if SP500 breaks below the $6,377.47 support level?
A break below the $6,377.47 support level on the daily chart would likely confirm the continuation of the strong bearish trend indicated by the ADX at 47.51. This could trigger further selling pressure, potentially targeting the next major support at $6,230.63. The MACD's negative momentum would also reinforce this downside move.
Should I consider buying SP500 at current levels around $6,572.87 given the mixed signals?
Caution is advised when considering buying at current levels near $6,572.87. While the 1-hour chart shows some bullish signs, the dominant bearish trend on the daily timeframe, confirmed by a high ADX and negative MACD, suggests that rallies might be short-lived. A more prudent approach would be to wait for a clear break above resistance levels like $6,589.83 or a confirmed bounce from strong support levels.
Is the RSI at 45.35 a sell signal for SP500 right now?
An RSI of 45.35 on the daily chart is not an immediate sell signal in itself, as it is still in neutral territory. However, its downward eğilim suggests that there is ample room for further price declines before reaching oversold conditions. Combined with other bearish indicators like the daily MACD and ADX, it contributes to the overall cautious outlook.
How might the strengthening DXY at 101.04 affect SP500 this week?
The strengthening DXY at 101.04 typically exerts downward pressure on risk assets like the S&P 500. This inverse correlation suggests that as the dollar gains strength, potentially due to Fed policy expectations or global risk aversion, the SP500 may face headwinds. Traders should monitor this relationship closely, as continued dollar strength could exacerbate selling pressure on the index.
Track markets in real-time
AI-powered analysis, technical indicators and real-time price data.
Join Our Telegram Channel
Breaking market news, AI analysis and trading signals instantly.
Join Channel