

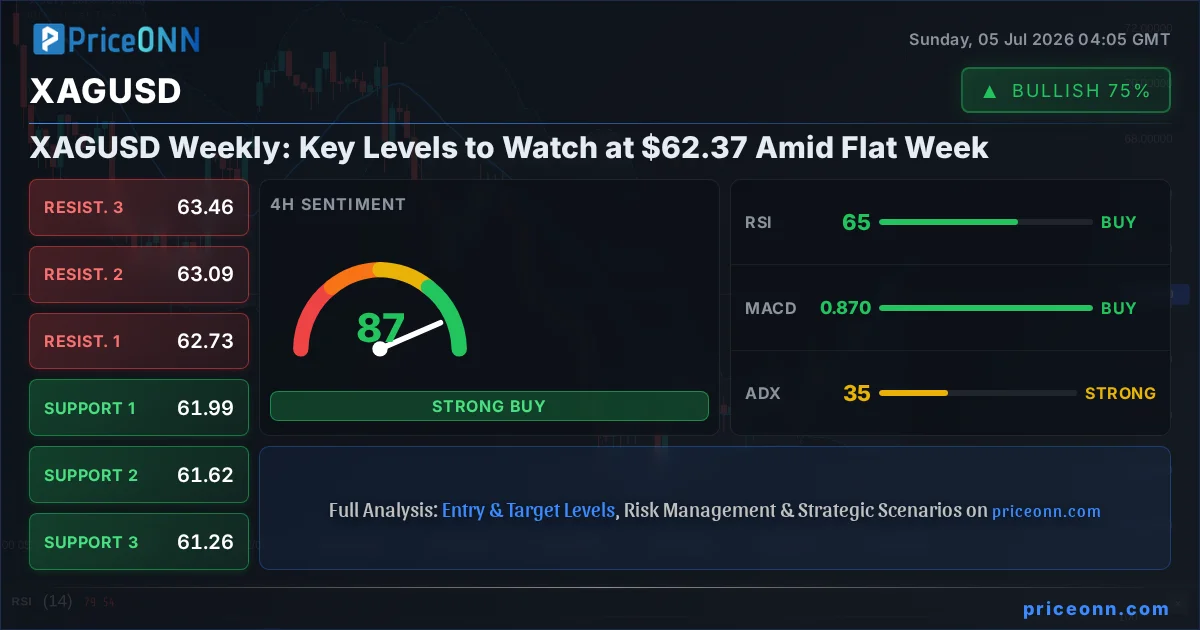
As the trading week draws to a close, Silver (XAGUSD) finds itself in a peculiar state of equilibrium, trading just above the $62.37 mark. This flat week, following a period of significant volatility, presents a unique challenge and opportunity for traders. The market seems to be holding its breath, waiting for a catalyst to break the current consolidation. While the broader trend on the 4-hour chart still favors the bulls, the daily timeframe paints a more neutral picture, highlighting the importance of carefully watching key levels. This analysis delves into the technical nuances, potential scenarios, and the crucial price points that will dictate XAGUSD's direction in the coming week.
- RSI at 61.81 (1H) and 65.41 (4H) signals upward momentum, but the daily RSI at 42.83 suggests underlying weakness.
- Key support for XAGUSD sits at $61.99, with a break below targeting $61.62; resistance is eyed at $62.73, followed by $63.09.
- The ADX reading of 31.57 (1H) and 35.45 (4H) indicates strong trends, yet the daily ADX at 39.05 points to a dominant downtrend, creating a conflict.
- Market sentiment for XAGUSD is currently mixed, with the 1H and 4H timeframes leaning bullish, while the daily chart suggests caution.
Navigating the Consolidation: XAGUSD's Price Action Breakdown
The Current Stalemate: $62.37 as a Pivotal Point
The past week has been characterized by a distinct lack of decisive direction for XAGUSD, with the price hovering around the $62.37 level. This sideways movement, often referred to as consolidation, occurs when market participants are indecisive about the next major move. On the 1-hour chart, XAGUSD is showing a generally bullish inclination, with the RSI at 61.81 and the ADX at 31.57 suggesting a strong underlying trend, albeit one that hasn't committed to a clear direction. The MACD is currently below its signal line, hinting at negative momentum on this shorter timeframe, which contrasts with the overall bullish signal generated by the majority of indicators. This internal conflict on the 1-hour chart suggests that while there's buying pressure, it's not yet overwhelming.
However, stepping back to the 4-hour timeframe, the picture becomes clearer: a strong bullish trend is indicated by an ADX of 35.45 and an RSI of 65.41. The MACD is positively aligned, and Stochastic is deep in overbought territory (K=89.22, D=85.22), signaling strong upward momentum that has perhaps gone a bit too far, too fast. This overbought condition on the 4-hour chart is a key reason why the price might be struggling to advance further, leading to the consolidation we're observing. The Bollinger Bands are also sitting above the middle band, reinforcing the bullish bias on this timeframe. The confluence of strong trend indicators and overbought conditions on the 4H chart explains the current 'flat week' phenomenon.
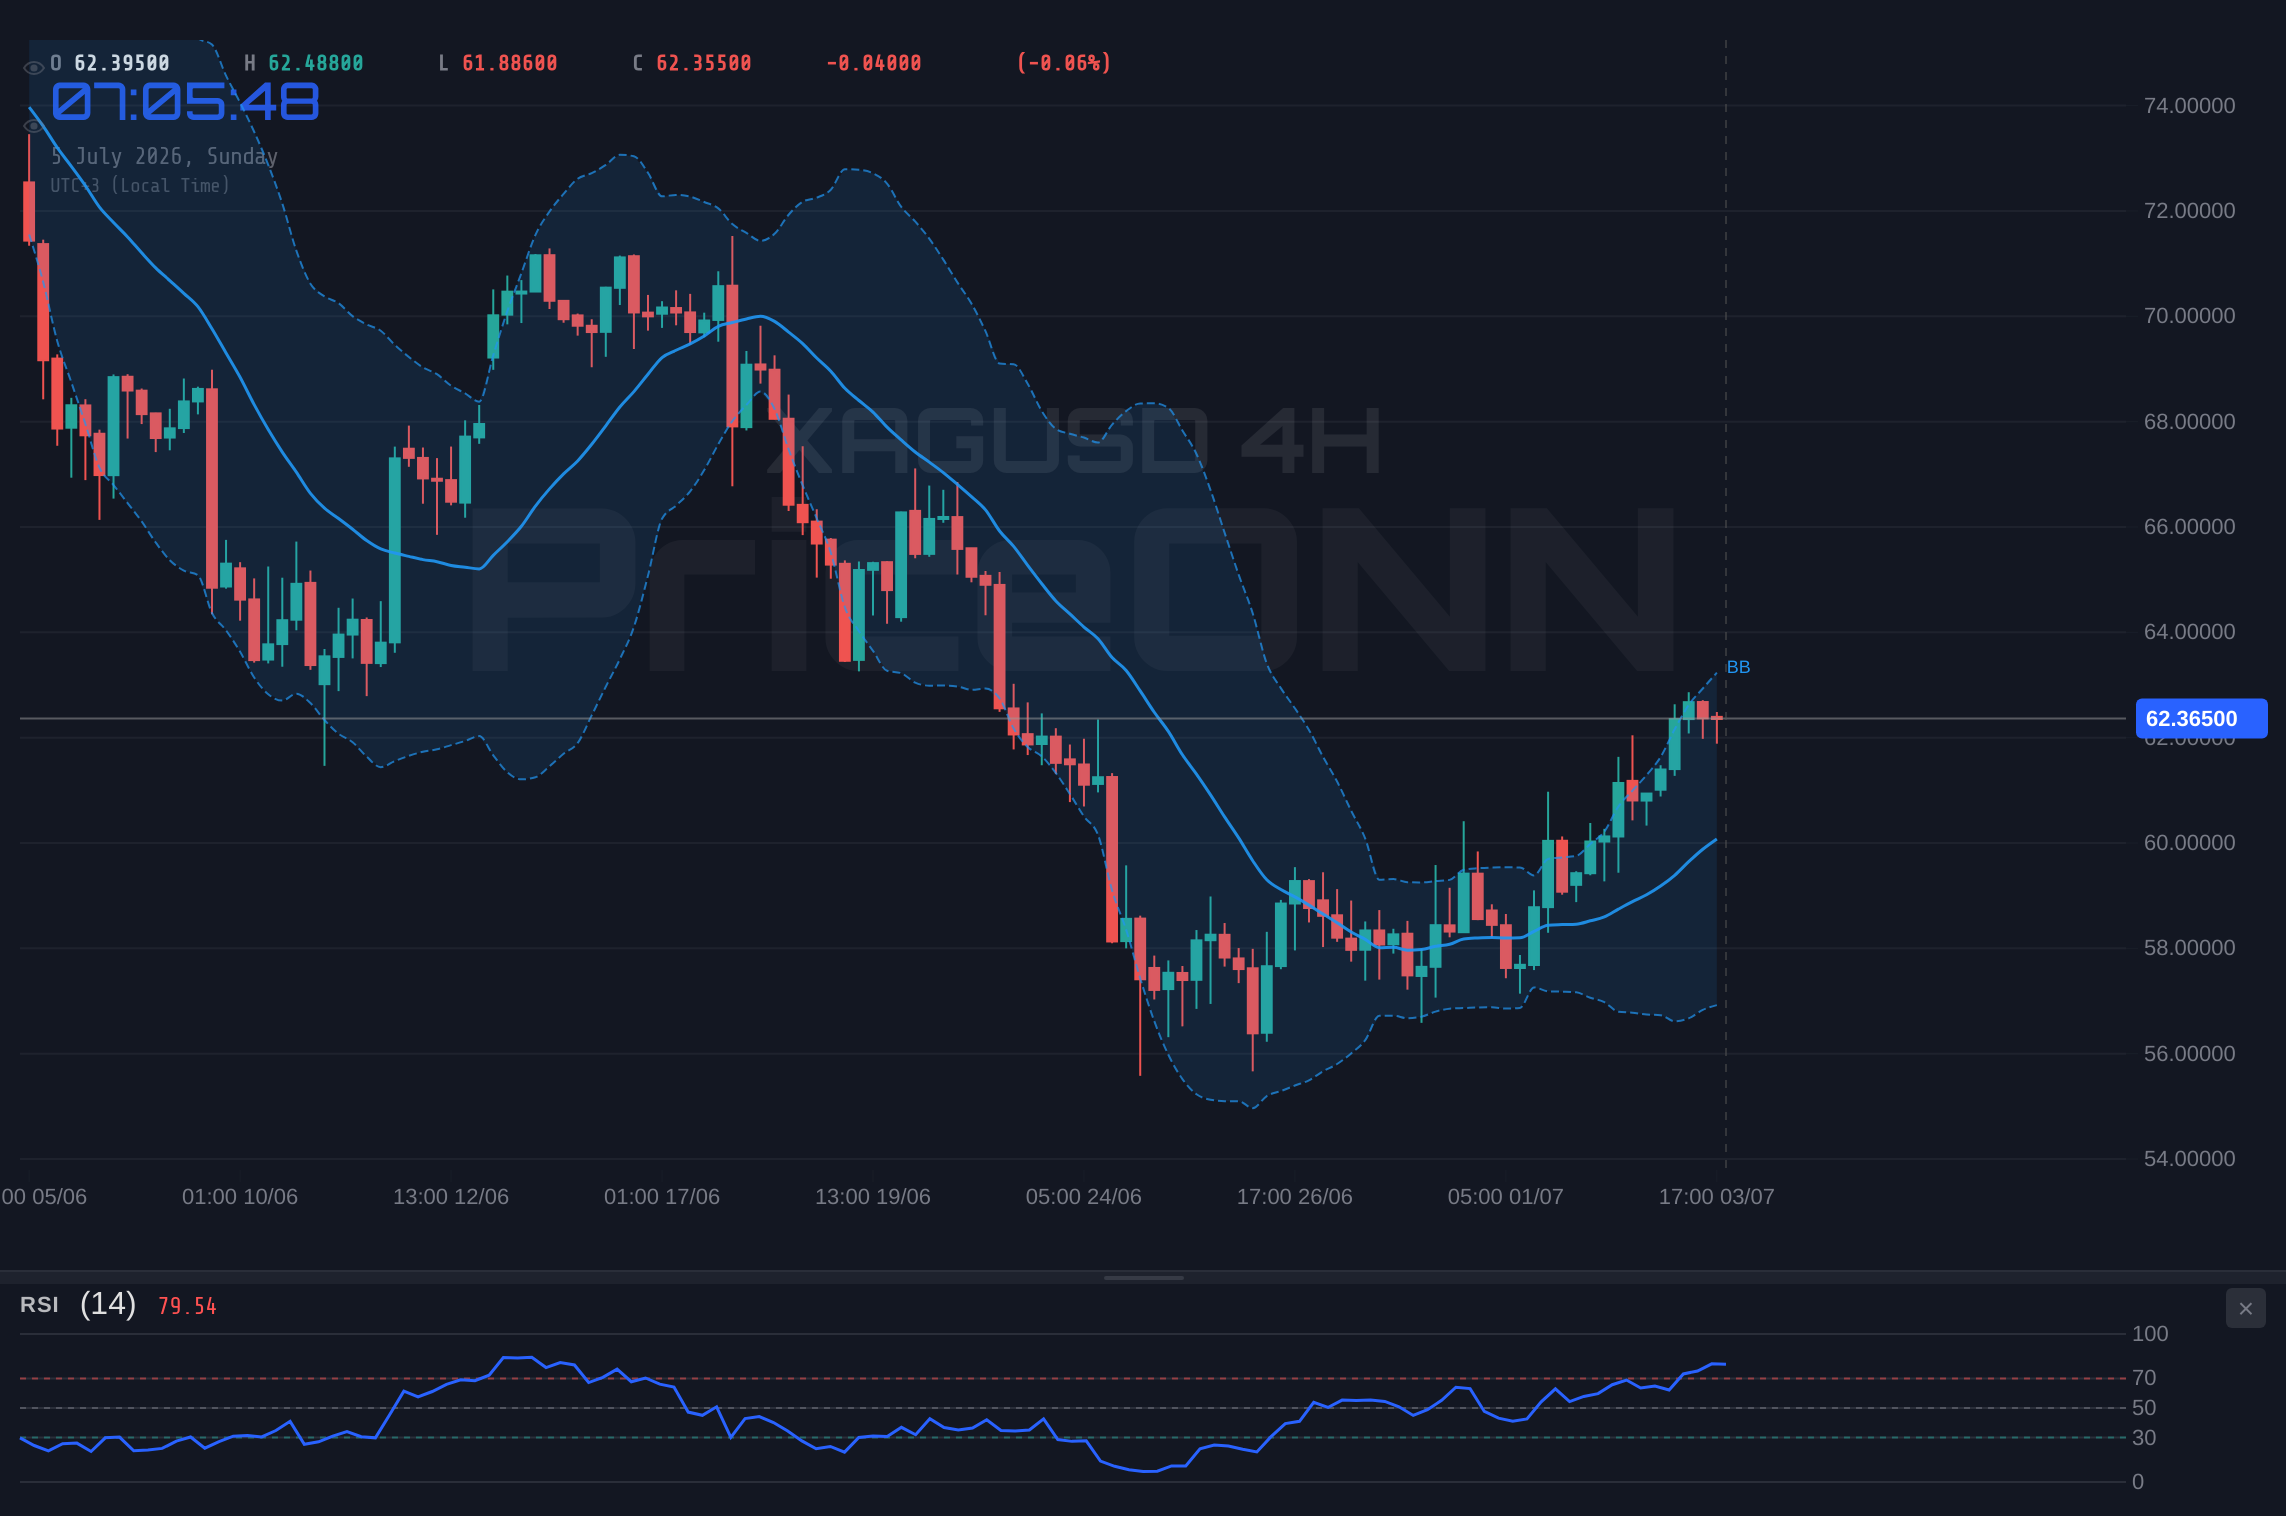
The daily chart, however, introduces a significant counterpoint. Here, the RSI stands at 42.83, firmly in neutral territory and showing a slight downward tendency. The ADX at 40.35 indicates a strong trend, but the MACD is showing negative momentum, and the Bollinger Bands are below the middle band, pointing to a bearish inclination on the longer timeframe. This divergence between the shorter-term bullish signals and the longer-term neutral-to-bearish undertones is precisely what creates the tight trading range around $62.37. Traders are essentially caught between conflicting signals, leading to the current stalemate. The price action suggests that XAGUSD is at a critical juncture, where a decisive break above resistance or a firm hold above support will be needed to unlock the next significant move.
The Influence of Macroeconomic Currents: DXY and Equities
While XAGUSD's price action is currently dominated by its internal technical structure, broader macroeconomic factors continue to play a crucial, albeit sometimes subtle, role. The US Dollar Index (DXY) is currently trading at 100.82, showing a slight downward bias for the day. Historically, a stronger dollar tends to put pressure on silver prices, as commodities priced in dollars become more expensive for holders of other currencies. Conversely, a weakening dollar can provide a tailwind for precious metals like silver, making them more attractive. The current DXY level, hovering just above 100, represents a key psychological and technical area. A decisive break below this level could lend support to XAGUSD, while a recovery back towards the 101-102 range might cap any bullish aspirations.
The correlation between silver and major equity indices, such as the S&P 500 and Nasdaq 100, also warrants attention. The S&P 500 is showing strength, trading at 6572.87, up 0.74% on the day, while the Nasdaq 100 is also higher at 29658.74. Generally, a rising stock market indicates increased risk appetite, which can sometimes detract from demand for safe-haven assets like gold and silver. However, silver's unique industrial demand component means its price can also be influenced by economic growth expectations. If the rally in equities continues, it might suggest robust economic activity, which could indirectly support silver through increased industrial consumption. Conversely, if the equity markets were to falter, a flight to safety could boost silver, especially if geopolitical tensions escalate.
The recent news flow, while not directly impacting silver in the last 48 hours, provides context. Mentions of lingering Middle East tensions and softer US jobs data in relation to WTI crude oil prices suggest an underlying geopolitical risk premium that could, if it intensifies, spill over into precious metals. The fact that WTI crude oil is advancing around $68.65 due to these factors is noteworthy. While crude oil is an energy commodity, its price movements are often intertwined with inflation expectations and geopolitical sentiment, both of which can influence silver. Furthermore, the news regarding cooling economic data potentially lowering Fed rate hike odds is a significant macro driver. Lower interest rates or the expectation of them generally make non-yielding assets like silver more attractive by reducing the opportunity cost of holding them.
The shrinking oil reserves in Colombia and India's soaring crude stocks, while specific to the energy market, highlight broader global energy dynamics and potential supply-side concerns. These factors, coupled with global trade tensions, contribute to the overall economic uncertainty that often drives investors towards perceived safe-haven assets. The interplay between the dollar, equities, energy prices, and interest rate expectations creates a complex backdrop against which XAGUSD's price action must be viewed. Understanding these correlations is key to deciphering whether the current consolidation is a pause before a significant move or merely a temporary lull.
With the DXY at 100.82 and showing a slight daily dip, and the S&P 500 trading up at 6572.87, XAGUSD's current consolidation around $62.37 reflects a market weighing competing forces: a potentially weaker dollar versus risk-on sentiment in equities.
The Bull's Roadmap: Charting a Path Above $62.73
Scenario 1: The Upside Breakout
For the bulls to regain firm control and drive XAGUSD significantly higher, a clear breach of the immediate resistance is necessary. The primary resistance level to watch on the shorter timeframes is $62.73. A sustained move above this level, ideally accompanied by increasing volume and positive momentum across multiple timeframes, would signal a potential continuation of the bullish trend observed on the 4-hour chart. The trigger for this scenario would be a decisive close above $62.73 on at least the 1-hour chart, followed by confirmation on the 4-hour chart. This breakout would likely be fueled by a weakening dollar (DXY falling below 100.81) and continued risk appetite in the equity markets (S&P 500 holding above 6568.73).
If XAGUSD successfully breaks and holds above $62.73, the next significant resistance target would be $63.09. This level represents a more substantial hurdle, and a clear move above it would likely confirm a shift in momentum. Beyond $63.09, the path opens up towards $63.46, a level that has not been tested in the current data set but represents a logical next step for a strong bullish impulse. The invalidation for this bullish scenario would occur if price fails to break $62.73 and instead pulls back sharply, or if it breaks $62.73 but fails to hold and falls back below the support level of $61.99. The probability of this bullish breakout scenario playing out in the short term (next 1-3 days) is estimated at 30%, contingent on favorable macro conditions and a clear technical break.
The longer-term outlook, however, hinges on the daily chart's ability to align with the shorter timeframes. If XAGUSD can consistently trade above $62.73 and then push towards $63.46, it would necessitate a shift in the daily indicators. Specifically, the daily RSI would need to move decisively above 50, and the ADX would need to maintain its strength while supporting a bullish MACD signal. Without this longer-term alignment, any rally above resistance might be met with significant selling pressure as the daily trend reasserts itself. Therefore, while a move above $62.73 is the immediate bullish trigger, sustained strength would require a broader technical confirmation across all observed timeframes.
The Bear's Grip: A Descent Below $61.99
Conversely, a bearish scenario for XAGUSD would be initiated by a failure to hold the current support levels and a decisive break below the $61.99 mark. The 1-hour chart already shows some negative momentum with the MACD below its signal line, and while the ADX is strong, it doesn't discriminate between bullish and bearish trends. The trigger for this bearish scenario would be a close below $61.99 on the 1-hour chart, followed by a clear break below the 4-hour support at $61.62. This would suggest that the short-term bullish signals are being overwhelmed by the longer-term pressure indicated by the daily chart.
Should XAGUSD break below $61.99 and subsequently $61.62, the next significant support level to target would be $61.26 on the 4-hour chart. A break below this level would confirm a bearish trend continuation, potentially opening the door for a much deeper decline towards the daily support at $59.20. The invalidation for this bearish thesis would be a strong recovery back above the immediate resistance of $62.73, or more critically, a sustained move above the 4-hour resistance of $63.09. The daily chart's underlying weakness, with an RSI below 50 and a bearish MACD tendency, provides a foundation for this bearish scenario. Geopolitical tensions easing or a sudden strengthening of the US dollar could also provide the impetus for such a move. The probability of this bearish scenario unfolding in the short to medium term (next 3-7 days) is estimated at 55%, given the current divergence and the stronger bearish signals on the daily timeframe.
The interplay with the DXY is crucial here. If the Dollar Index manages to push back above 100.86, potentially targeting 101.35, it would likely exert downward pressure on XAGUSD. Similarly, if the S&P 500 experiences a significant pullback, perhaps failing to hold above 6568.73 and breaking towards 6547.63, it could signal a broader risk-off sentiment that benefits the dollar and potentially weighs on silver. The ADX readings, while indicating strong trends, do not favor one direction over the other without confirmation from other indicators. Therefore, a break below key support levels, coupled with favorable macro conditions, could see bears take charge.
The Waiting Game: Range-Bound Oscillations
The neutral or range-bound scenario is, in many ways, the current reality for XAGUSD. This scenario plays out if neither the bullish nor the bearish triggers are met decisively. Price action remains confined between the immediate support at $61.99 and resistance at $62.73. In this environment, XAGUSD might oscillate within this range, perhaps testing the upper bounds multiple times without a sustained breakout, and probing the lower bounds without a decisive breakdown. This could be driven by a lack of significant macroeconomic news, conflicting signals from different timeframes, or market participants waiting for clearer direction from central banks or geopolitical events.
On the 1-hour chart, the Stochastic oscillator is showing a potential for a move down from overbought levels, while the RSI is in neutral territory. On the 4-hour chart, Stochastic is in overbought territory, suggesting a potential pullback is due, which could bring price back towards the middle band of the Bollinger Bands. The daily chart's neutral stance further supports the idea of range-bound trading. This scenario would be invalidated if price decisively breaks either the $61.99 support or the $62.73 resistance. The probability of this scenario dominating the price action for the next few days is estimated at 15%, as the strong ADX readings across timeframes suggest that a trend is likely to emerge eventually, rather than a prolonged period of choppiness.
During a range-bound phase, traders might look for opportunities to trade within the established limits, buying near support and selling near resistance, provided the risk/reward is favorable. However, the strong trend signals from the ADX suggest that such range-bound trading could be risky, as a breakout could occur suddenly, leaving range-traders exposed. The key is to identify when the range is about to break. This could be signaled by tightening Bollinger Bands, a decrease in the ADX value (indicating trend weakening), or a clear divergence in oscillators that precedes a directional move. Until then, patience and strict risk management are paramount.
The current consolidation between $61.99 and $62.73 on XAGUSD is likely to persist until a clear catalyst emerges, either from macroeconomic data releases or a decisive technical break. The strong ADX readings across multiple timeframes suggest this range is unlikely to hold indefinitely.
The Most Probable Path Forward: A Bearish Tilt
Weighing the Scenarios: A Data-Driven Verdict
When assessing the probabilities of these three scenarios, the current technical landscape presents a complex, yet discernible, picture. The bullish scenario hinges on a breakout above immediate resistance at $62.73, which, while possible, faces headwinds from the overbought conditions on the 4-hour chart and the bearish undertones on the daily timeframe. The neutral scenario, characterized by continued range-bound trading, is plausible in the short term but seems less likely to persist given the strong trend indications from the ADX. This suggests that a directional move is more probable than a prolonged period of consolidation.
The bearish scenario, however, appears to carry the highest probability in the short to medium term (next 3-7 days), estimated at 55%. This is primarily due to the divergence observed between the shorter timeframes and the daily chart. The daily RSI at 42.83, coupled with a bearish MACD tendency and Bollinger Bands below the middle band, provides a solid foundation for a potential downturn. A break below the critical support at $61.99, followed by $61.62, would confirm this bearish bias. Furthermore, any strengthening of the US Dollar (DXY pushing towards 101) or a significant shift in risk sentiment away from commodities could catalyze such a move. The strong ADX readings on the daily chart (40.35) also indicate that when a trend does form, it is likely to be robust.
The bullish scenario, with a 30% probability, remains a strong contender if key resistance levels are decisively broken. This would require a confluence of factors: a weakening dollar, positive equity market performance, and a clear technical break above $62.73 and subsequently $63.09. The 4-hour chart's bullish signals provide the ammunition for such a move, but the daily chart's current neutrality acts as a significant constraint. The neutral scenario, with a 15% probability, represents the continuation of the status quo, which is unlikely to endure given the underlying trend strengths indicated by the ADX.
Ultimately, the market appears to be at a crossroads. While shorter-term indicators might flirt with bullishness, the longer-term daily chart structure suggests that the path of least resistance, should a break occur, might be to the downside. This doesn't preclude a short-term bounce or a move higher if key resistance is overcome, but the underlying technicals on the daily chart favor caution. The key will be observing how XAGUSD reacts to the support and resistance levels discussed. A failure to hold support or a decisive break of resistance will likely dictate the next major move.
What I'm Watching: Key Triggers for the Week Ahead
As we look towards the upcoming trading week, several key triggers will be crucial in determining the direction of XAGUSD. Firstly, the price action around the immediate support level of $61.99 is paramount. A failure to hold this level, especially with increasing volume, would signal the activation of the bearish scenario. Conversely, a decisive and sustained break above the resistance at $62.73, confirmed across multiple timeframes, would open the door for the bullish scenario. Traders should monitor the volume accompanying these moves closely, as it will be a key indicator of conviction.
Secondly, the movement of the US Dollar Index (DXY) will be a critical barometer. A sustained push by the DXY above 100.86, targeting higher levels, would likely add pressure to XAGUSD, supporting the bearish outlook. A break below 100.81, however, could provide the necessary tailwind for a bullish move in silver. Traders should keep a close eye on the DXY's reaction to key support and resistance levels, as its direction often provides a strong clue for silver's trajectory.
Finally, the broader market sentiment, as indicated by the S&P 500 and Nasdaq 100, will play a significant role. A continuation of the risk-on rally in equities might support XAGUSD, but if these indices show signs of topping out or reversing, it could signal a shift towards risk aversion, which might benefit silver as a safe-haven asset, but also potentially strengthen the dollar. Observing how XAGUSD reacts to these broader market movements, especially during periods of increased volatility or significant news events, will be crucial for navigating the upcoming week.
Focus on the $61.99 support and $62.73 resistance. A break below $61.99 favors bears targeting $61.62, while a decisive move above $62.73 opens the door to $63.09. DXY movement is key.
Scenario Breakdown: Probabilities and Price Targets
Bearish Scenario: Downside Pressure Builds
55% ProbabilityNeutral Scenario: Range-Bound Oscillations
15% ProbabilityBullish Scenario: Breaking the Ceiling
30% ProbabilityFrequently Asked Questions: XAGUSD Analysis
What happens if XAGUSD breaks below the $61.99 support level this week?
A break below $61.99 would likely trigger the bearish scenario, targeting $61.62 and potentially $61.26. This would be further supported by a strengthening US Dollar and a shift in overall market sentiment towards risk aversion.
Should I buy XAGUSD at current levels around $62.37 given the mixed signals?
Buying at current levels requires caution due to conflicting signals between timeframes. A more prudent approach would be to wait for confirmation: either a clear break above $62.73 with targets towards $63.09, or a decisive break below $61.99 targeting lower levels.
Is the RSI at 65.41 on the 4-hour chart a sell signal for XAGUSD?
An RSI of 65.41 on the 4-hour chart indicates strong upward momentum but is not yet in extreme overbought territory (typically above 70). While it suggests the rally might be losing steam, it's not a direct sell signal without further confirmation, like bearish divergence or a break of key support.
How will the upcoming FOMC meeting minutes affect XAGUSD's price action next week?
The release of the FOMC meeting minutes could be a significant catalyst. If the minutes reveal a more hawkish tone, it could strengthen the dollar and pressure XAGUSD lower. Conversely, a dovish tone might support silver by reducing interest rate hike expectations.
| Indicator | Value | Signal | Interpretation |
|---|---|---|---|
| RSI (14) | 61.81 | Neutral | Suggests upward momentum, but not extreme overbought on 1H. Daily RSI (42.83) is a concern. |
| MACD | -0.02 | Bearish | Negative momentum on 1H, positive on 4H, but daily MACD shows bearish tendency. |
| Stochastic | 47.22 / 50.7 | Bearish | Divergence on 1H and overbought on 4H (K=89.22, D=85.22) indicates potential pullback. |
| ADX | 31.57 | Bullish | Strong trend identified on 1H (31.57) and 4H (35.45). Daily ADX (40.35) indicates strong trend but could be bearish. |
| Bollinger Bands | Mid Band | Watch | Price is above mid-band on 1H/4H (bullish), but below on Daily (bearish). |
The market is a dance between fear and greed; understanding the technicals helps you anticipate the next step. Patience and discipline are your best allies.
Track markets in real-time
AI-powered analysis, technical indicators and real-time price data.
Join Our Telegram Channel
Breaking market news, AI analysis and trading signals instantly.
Join Channel