

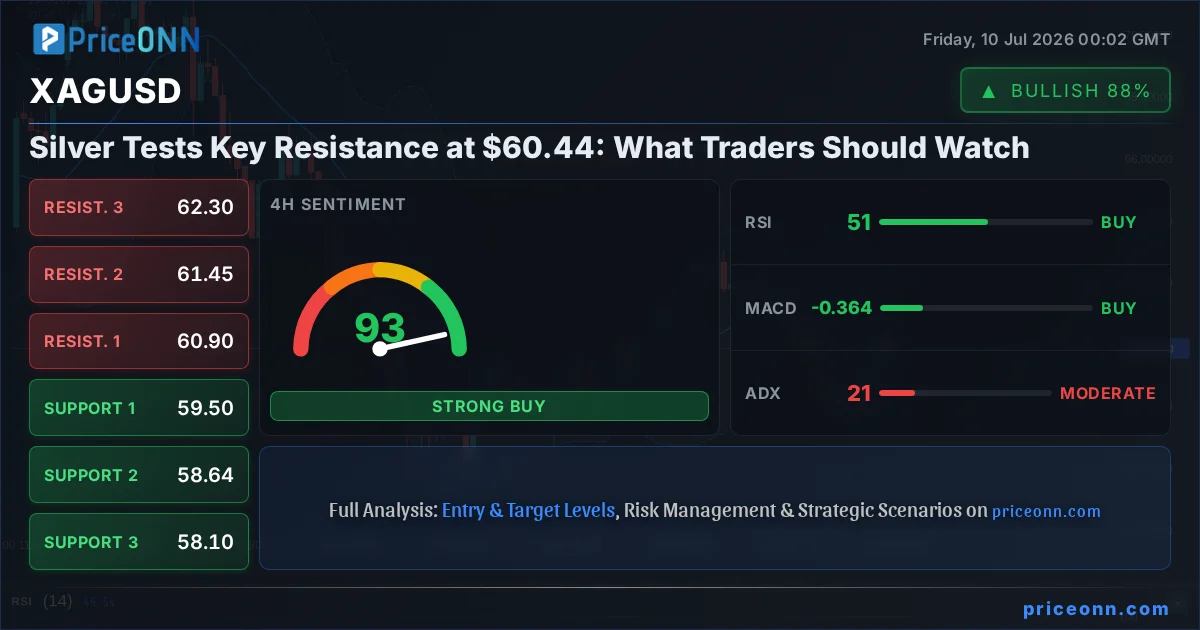
Silver's price action is at a pivotal juncture, with the metal currently trading at $60.05 and inching closer to a significant resistance level at $60.44. This key level, along with broader market sentiment influenced by the US Dollar Index (DXY) and equity performance, will dictate the next significant move for XAGUSD. Traders are closely monitoring whether the recent upward momentum can break through this barrier or if profit-taking will ensue, leading to a retest of lower support levels.
- RSI at 60.33 on the 1H chart signals neutral momentum with a slight upward bias, while the 1D RSI at 40.39 indicates a downward trend.
- Critical resistance sits at $60.44, a level that needs to be decisively broken for a sustained bullish move, while $59.97 presents immediate overhead pressure.
- The ADX at 21.15 on the 4H chart suggests a weak trend, indicating potential for range-bound trading or a breakout that lacks strong conviction.
- The US Dollar Index (DXY) is trading at 100.92, showing a slight downward pressure which could offer some support to silver prices.
The interplay between shorter-term bullish signals and longer-term bearish indicators creates a complex picture for silver traders. While the 1-hour and 4-hour charts suggest a bullish leaning, with overall 'BUY' signals dominating, the daily timeframe paints a different story. The daily RSI at 40.39 indicates a downward trend, and the ADX at 37.58 points to a strong downward trend, creating a divergence that demands careful consideration. This analysis delves into the technical landscape, exploring various scenarios and the critical levels that will shape silver's trajectory in the coming days.
The Bull's Roadmap: Breaking Through $60.44
For silver bulls to seize control, a decisive breach of the $60.44 resistance level is paramount. On the 1-hour chart, the overall signal remains strongly bullish with 7 'BUY' signals against only 1 'SELL'. The RSI at 60.33, while in neutral territory, shows an upward trend, suggesting that buyers have the upper hand in the immediate term. MACD is also displaying positive momentum, with the MACD line above the signal line, reinforcing the bullish sentiment on this shorter timeframe. The Bollinger Bands are trading above the middle band, indicating an upward bias. However, the Stochastic indicator presents a conflicting signal, with %K at 47.1 and %D at 68.98, suggesting a potential dip as %K is below %D. This is a classic example of conflicting signals that require traders to exercise caution.
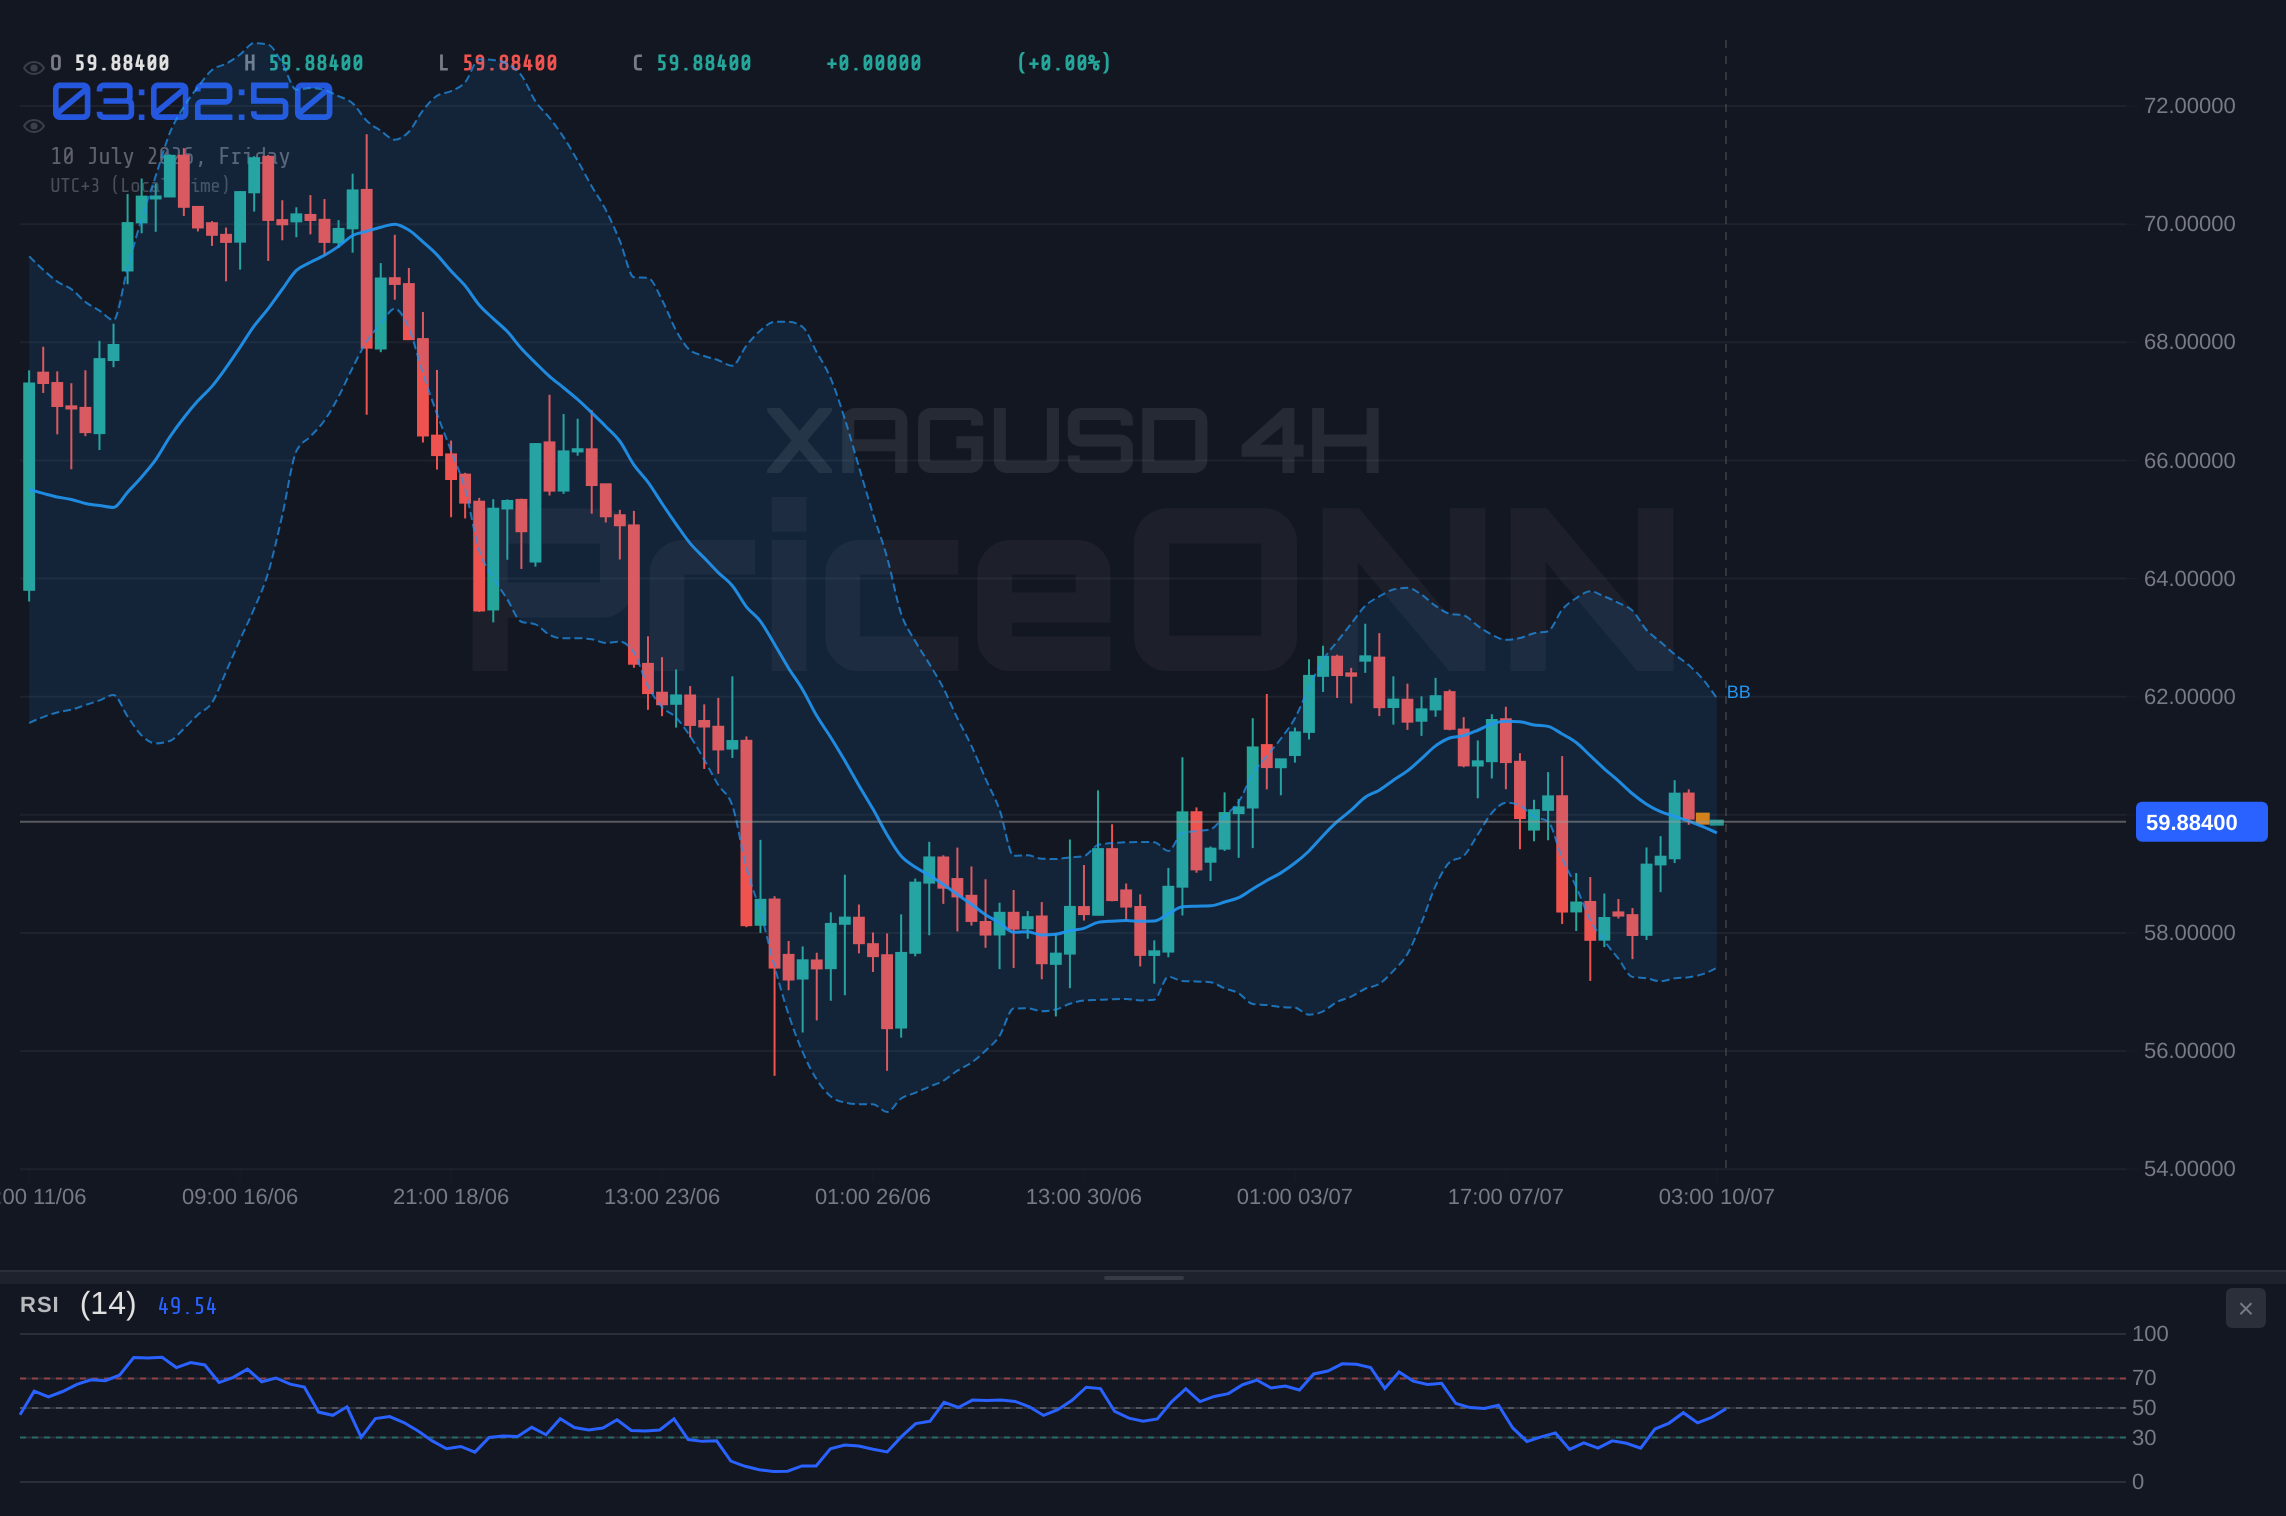
The 4-hour timeframe offers a more robust bullish outlook, with a trend strength of 84% and a 'BUY' signal count of 7 to 1. The RSI at 53.87 remains in neutral territory but trends upwards, and the MACD confirms positive momentum. Stochastic here is more aligned with the bullish narrative, showing %K at 85.4 and %D at 57.13, indicating a strong bullish signal as %K is significantly above %D. The ADX at 18.99 suggests a weak trend, which can sometimes precede a strong breakout if other conditions align. If silver can successfully navigate the immediate resistance at $59.97 and then push past $60.44, the next logical targets would be the 4-hour resistance levels of $60.90 and potentially $61.45. This scenario hinges on sustained buying pressure and a confirmation of the bullish trend across multiple timeframes, ideally supported by a weaker US dollar and positive risk sentiment.
The influence of correlated assets cannot be ignored. The US Dollar Index (DXY) is currently trading at 100.92, showing a slight decline. Historically, a weaker dollar tends to support precious metal prices. If the DXY continues its downward trajectory, it could provide the necessary tailwind for silver to break higher. Furthermore, the performance of major indices like the S&P 500, currently showing a strong bullish trend on the 1-hour and 4-hour charts, can indicate broader risk appetite. If equities continue to climb, it might suggest a risk-on environment where commodities like silver could benefit from increased investment flows. However, the daily chart for the S&P 500 shows a bearish trend, adding a layer of complexity to this correlation.
Where Bears Take Control: The $59.85 Support Line
Despite the optimistic signals on shorter timeframes, the bearish case for silver cannot be dismissed, particularly when examining the daily chart. The 1-day timeframe presents a 'SELL' signal majority (6 'SELL', 2 'BUY'), and the ADX at 37.58 indicates a strong downward trend. This suggests that the current upward momentum might be a temporary correction within a larger downtrend. The daily RSI at 44.73 is below 50 and trending downwards, reinforcing the bearish sentiment. The MACD on the daily chart, while showing positive momentum, is still below the signal line, indicating potential weakness. The Bollinger Bands are trading below the middle band, further supporting a bearish outlook on the daily chart.
For the bears to regain dominance, the price must first falter at the immediate resistance of $59.97 and then decisively break below the crucial 1-hour support level of $59.85. If this support breaks, the next significant level to watch would be the 4-hour support at $59.50. A break below this could trigger a cascade of selling, targeting the deeper daily support levels at $56.63 and potentially $55.00. This scenario would likely be fueled by a strengthening US dollar, a resurgence of risk-off sentiment in global markets (evidenced by a falling S&P 500 or Nasdaq), or negative news impacting the mining or industrial demand for silver. The Stochastic on the 1-hour chart, with %K at 47.1 and %D at 68.98, already hints at a potential bearish turn as %K crosses below %D, a signal that could precede a larger pullback.
The correlation with gold (XAUUSD) also offers insights. Gold is currently trading at $4124.09, showing a strong bullish trend on the 4-hour chart but a neutral trend on the 1-hour and daily charts. If gold experiences a significant pullback, it could drag silver down with it, especially if the broader commodity sentiment turns negative. Recent news suggests that gold recoveries are likely to be capped as the 20-day EMA slopes lower, which could be a leading indicator for silver's own resistance. Furthermore, reports mentioning that Brent crude oil prices are falling could also influence inflation expectations, potentially reducing the appeal of precious metals as an inflation hedge.
The Waiting Game: Sideways Consolidation at $60.05
A neutral scenario, characterized by range-bound trading, is also a distinct possibility, especially given the mixed signals across different timeframes and indicators. The ADX values present a confusing picture: a moderate 23.22 on the 1-hour, a weak 21.15 on the 4-hour, and a strong 37.58 downtrend on the daily. This inconsistency suggests that neither bulls nor bears have complete control, leading to a period of consolidation. The price could remain trapped between the immediate resistance at $59.97 and the support at $59.85 on the intraday charts, or oscillate within a wider range defined by the daily support of $56.63 and resistance of $60.44.
Several factors could contribute to this consolidation. Conflicting economic data releases or geopolitical uncertainties that create indecision in the market can lead to sideways price action. For instance, upcoming economic events, such as central bank statements or key inflation reports, might cause traders to pause and wait for clearer direction. The DXY's current slight dip provides some support, but if it stabilizes or rebounds, it could cap silver's upside without necessarily triggering a sharp decline. Similarly, if equity markets enter a consolidation phase, it would reduce the volatility associated with risk appetite, potentially leading to less pronounced moves in silver.
In such a scenario, traders would focus on identifying clear boundaries and trading within the range, looking for opportunities at the edges. The Stochastic oscillator on the 1-hour chart, showing %K below %D, and on the daily chart, also showing %K below %D, could hint at a bias towards the lower end of the range if the bearish signals intensify. However, the bullish signals on the 4-hour chart, particularly the Stochastic with %K above %D, suggest that any dip might be met with buying interest. This tug-of-war between conflicting indicators and timeframes is the hallmark of consolidation, where patience and strict risk management are key.
Bearish Scenario: The Daily Downtrend Reasserts
60% ProbabilityBullish Scenario: Conquering $60.44 Resistance
30% ProbabilityNeutral Scenario: The Waiting Game at $60.05
10% ProbabilityWhat I'm Watching This Week
The immediate focus for XAGUSD remains on the $60.44 resistance level. A decisive close above this mark on a 4-hour chart, especially if accompanied by a weakening DXY and positive equity market sentiment, would validate the bullish scenario. Conversely, a failure to break this resistance and a subsequent drop below the $59.85 support level, particularly on the daily chart, would confirm the bearish outlook. The ADX readings across different timeframes highlight the current lack of strong directional conviction, suggesting that significant catalysts might be needed to drive a sustained trend.
Traders should pay close attention to the US Dollar Index (DXY) movements. The DXY is currently trading at 100.92, and any sustained decline could provide a tailwind for silver. The performance of major equity indices, such as the S&P 500 (currently showing a bearish trend on the daily chart), will also be crucial. A shift towards risk-off sentiment could boost safe-haven assets like silver. Additionally, any news related to central bank policies, inflation data, or geopolitical tensions in the Middle East could trigger significant volatility. The divergence between the bullish signals on shorter timeframes and the bearish trend on the daily chart means that confirmation is key.
The key triggers to watch this week are: 1) A confirmed break and hold above $60.44 resistance, supported by intraday and 4-hour closes. 2) A breakdown below the $59.85 support level, especially if confirmed by a daily close below this mark. 3) Any significant shifts in DXY or equity market sentiment that could provide a directional bias. Given the mixed signals and the strong daily downtrend indicated by ADX 37.58, the probability leans towards the bearish scenario, but confirmation is essential before committing to trades.
Frequently Asked Questions: XAGUSD Analysis
What happens if XAGUSD breaks above $60.44 resistance this week?
If XAGUSD decisively breaks and holds above the $60.44 resistance, the bullish scenario becomes more probable. This could trigger a move towards the 4-hour resistance levels of $60.90 and potentially $61.45, especially if the DXY weakens further.
Should I buy XAGUSD at current levels of $60.05 given the conflicting indicators?
Buying at current levels of $60.05 is risky due to conflicting signals. The 1H and 4H charts show bullish momentum, but the daily chart indicates a strong downtrend (ADX 37.58). A confirmation of a break above $60.44 or a dip to test lower support levels like $59.85 would provide clearer entry points with better risk management.
Is the RSI at 40.39 on the daily chart a sell signal for XAGUSD?
An RSI reading of 40.39 on the daily chart, especially with a downward trend, suggests bearish momentum is present. While not an immediate sell signal on its own, it supports the bearish scenario if price fails to hold above key intraday support levels and breaks below $59.85.
How might the DXY trading at 100.92 affect XAGUSD this week?
The DXY at 100.92 shows a slight decline, which typically offers support to silver prices. If the dollar continues to weaken, it could help XAGUSD break through resistance levels like $60.44. Conversely, any recovery in the DXY could add pressure on silver.
| Indicator | Value | Signal | Interpretation |
|---|---|---|---|
| RSI (14) | 60.33 | Neutral | Upward trend on 1H, downward on 1D |
| MACD | Positive | Bullish | Momentum positive on shorter timeframes |
| Stochastic | K=47.1, D=68.98 | Bearish | %K |
| ADX | 23.22 | Weak Trend | Moderate trend strength on 1H, weak on 4H, strong down on 1D |
| Bollinger | Middle Band | Bullish | Bands above middle band on 1H/4H |
Track markets in real-time
AI-powered analysis, technical indicators and real-time price data.
Join Our Telegram Channel
Breaking market news, AI analysis and trading signals instantly.
Join Channel