

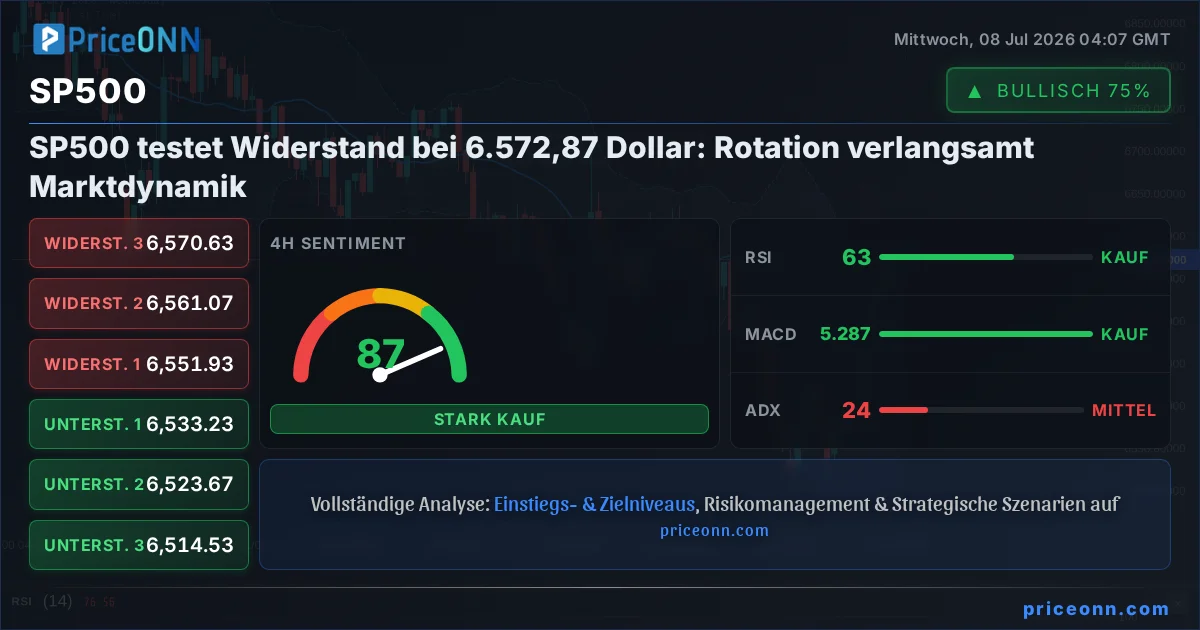
Der S&P 500 befindet sich an einem kritischen Punkt und bewegt sich prekär nahe dem Widerstandsniveau von 6.572,87 Dollar. Dieser entscheidende Punkt markiert eine potenzielle Umkehrzone, in der die vorherrschende bullische Stimmung auf eine erhebliche Herausforderung stoßen könnte. Jüngste Marktdynamiken deuten auf eine Rotation in der Führung hin, wobei einige Sektoren Anzeichen einer Abkühlung zeigen, während andere versuchen, an Dynamik zu gewinnen. Dieser interne Marktshift geht oft Perioden der Konsolidierung oder sogar Umkehrungen voraus, was die aktuelle Kursentwicklung des S&P 500 zu einem Gegenstand intensiver Beobachtung für Händler und Investoren macht. Das Verständnis des Zusammenspiels zwischen verschiedenen technischen Indikatoren, korrelierten Vermögenswerten wie dem DXY und Öl sowie der breiteren makroökonomischen Erzählung ist entscheidend für die Navigation der unmittelbaren Zukunft dieses wichtigen US-Aktienindex. Die Frage, die sich jeder stellt, ist, ob die Bullen genügend Kraft haben, diesen Widerstand zu durchbrechen, oder ob die Bären bereit sind, die Kontrolle zurückzugewinnen.
- Der S&P 500 wird derzeit bei 6.572,87 Dollar gehandelt und testet ein wichtiges Widerstandsniveau.
- Auf dem 1-Stunden-Chart signalisiert der RSI bei 70,95 überkaufte Bedingungen, was auf potenziellen Verkaufsdruck hindeutet.
- Die kritische Unterstützung für den S&P 500 liegt bei 6.547,63 Dollar, mit weiteren Niveaus bei 6.535,07 Dollar.
- Das MACD-Histogramm auf dem 1-Stunden-Chart zeigt eine negative Dynamik, was auf eine mögliche Verlangsamung des Aufwärtstrends hindeutet.
- Der DXY-Index liegt bei 101,1, und seine Stärke korreliert typischerweise mit dem Druck auf wichtige Indizes wie den S&P 500.
Das Schlachtfeld ist klar definiert. Einerseits haben die anhaltende Stärke in bestimmten Marktsegmenten und eine generell positive Risikobereitschaft den S&P 500 in Richtung neuer Höchststände getrieben. Diese Aufwärtsdynamik scheint jedoch etwas von ihrer früheren Kraft zu verlieren, was sich in den technischen Messwerten über verschiedene Zeitrahmen hinweg zeigt. Der 1-Stunden-RSI liegt beispielsweise bei 70,95 und damit fest im überkauften Bereich. Dies signalisiert zwar nicht sofort einen Ausverkauf, deutet aber darauf hin, dass der Markt kurzfristig überdehnt ist und anfällig für Gewinnmitnahmen wird. Ebenso zeigt das MACD-Histogramm im selben Zeitrahmen eine negative Dynamik unterhalb der Signallinie. Diese Divergenz deutet darauf hin, dass der zugrunde liegende Kaufdruck nachlassen könnte, selbst wenn der Preis leicht ansteigt. Solche technischen Indikatoren, isoliert betrachtet, malen ein Bild der Vorsicht.
Darüber hinaus fügt die breitere Korrelationsanalyse eine weitere Ebene zu dieser sich entwickelnden Erzählung hinzu. Der Dollar-Index (DXY) liegt derzeit bei 101,1 und zeigt einen aufstrebenden Trend. Historisch gesehen übt ein robuster DXY oft Abwärtsdruck auf globale Aktienmärkte, einschließlich des S&P 500, aus, da ein stärkerer Dollar US-Anlagen für ausländische Investoren relativ teurer macht. Diese umgekehrte Beziehung ist, obwohl nicht immer perfekt, ein wichtiger Faktor, der berücksichtigt werden muss. Wenn der DXY seinen Aufstieg fortsetzt, könnte er den S&P 500 belasten und die bärischen Signale der kurzfristigen Indikatoren verstärken, was zu einem Test der unmittelbaren Unterstützungsniveaus führen könnte.
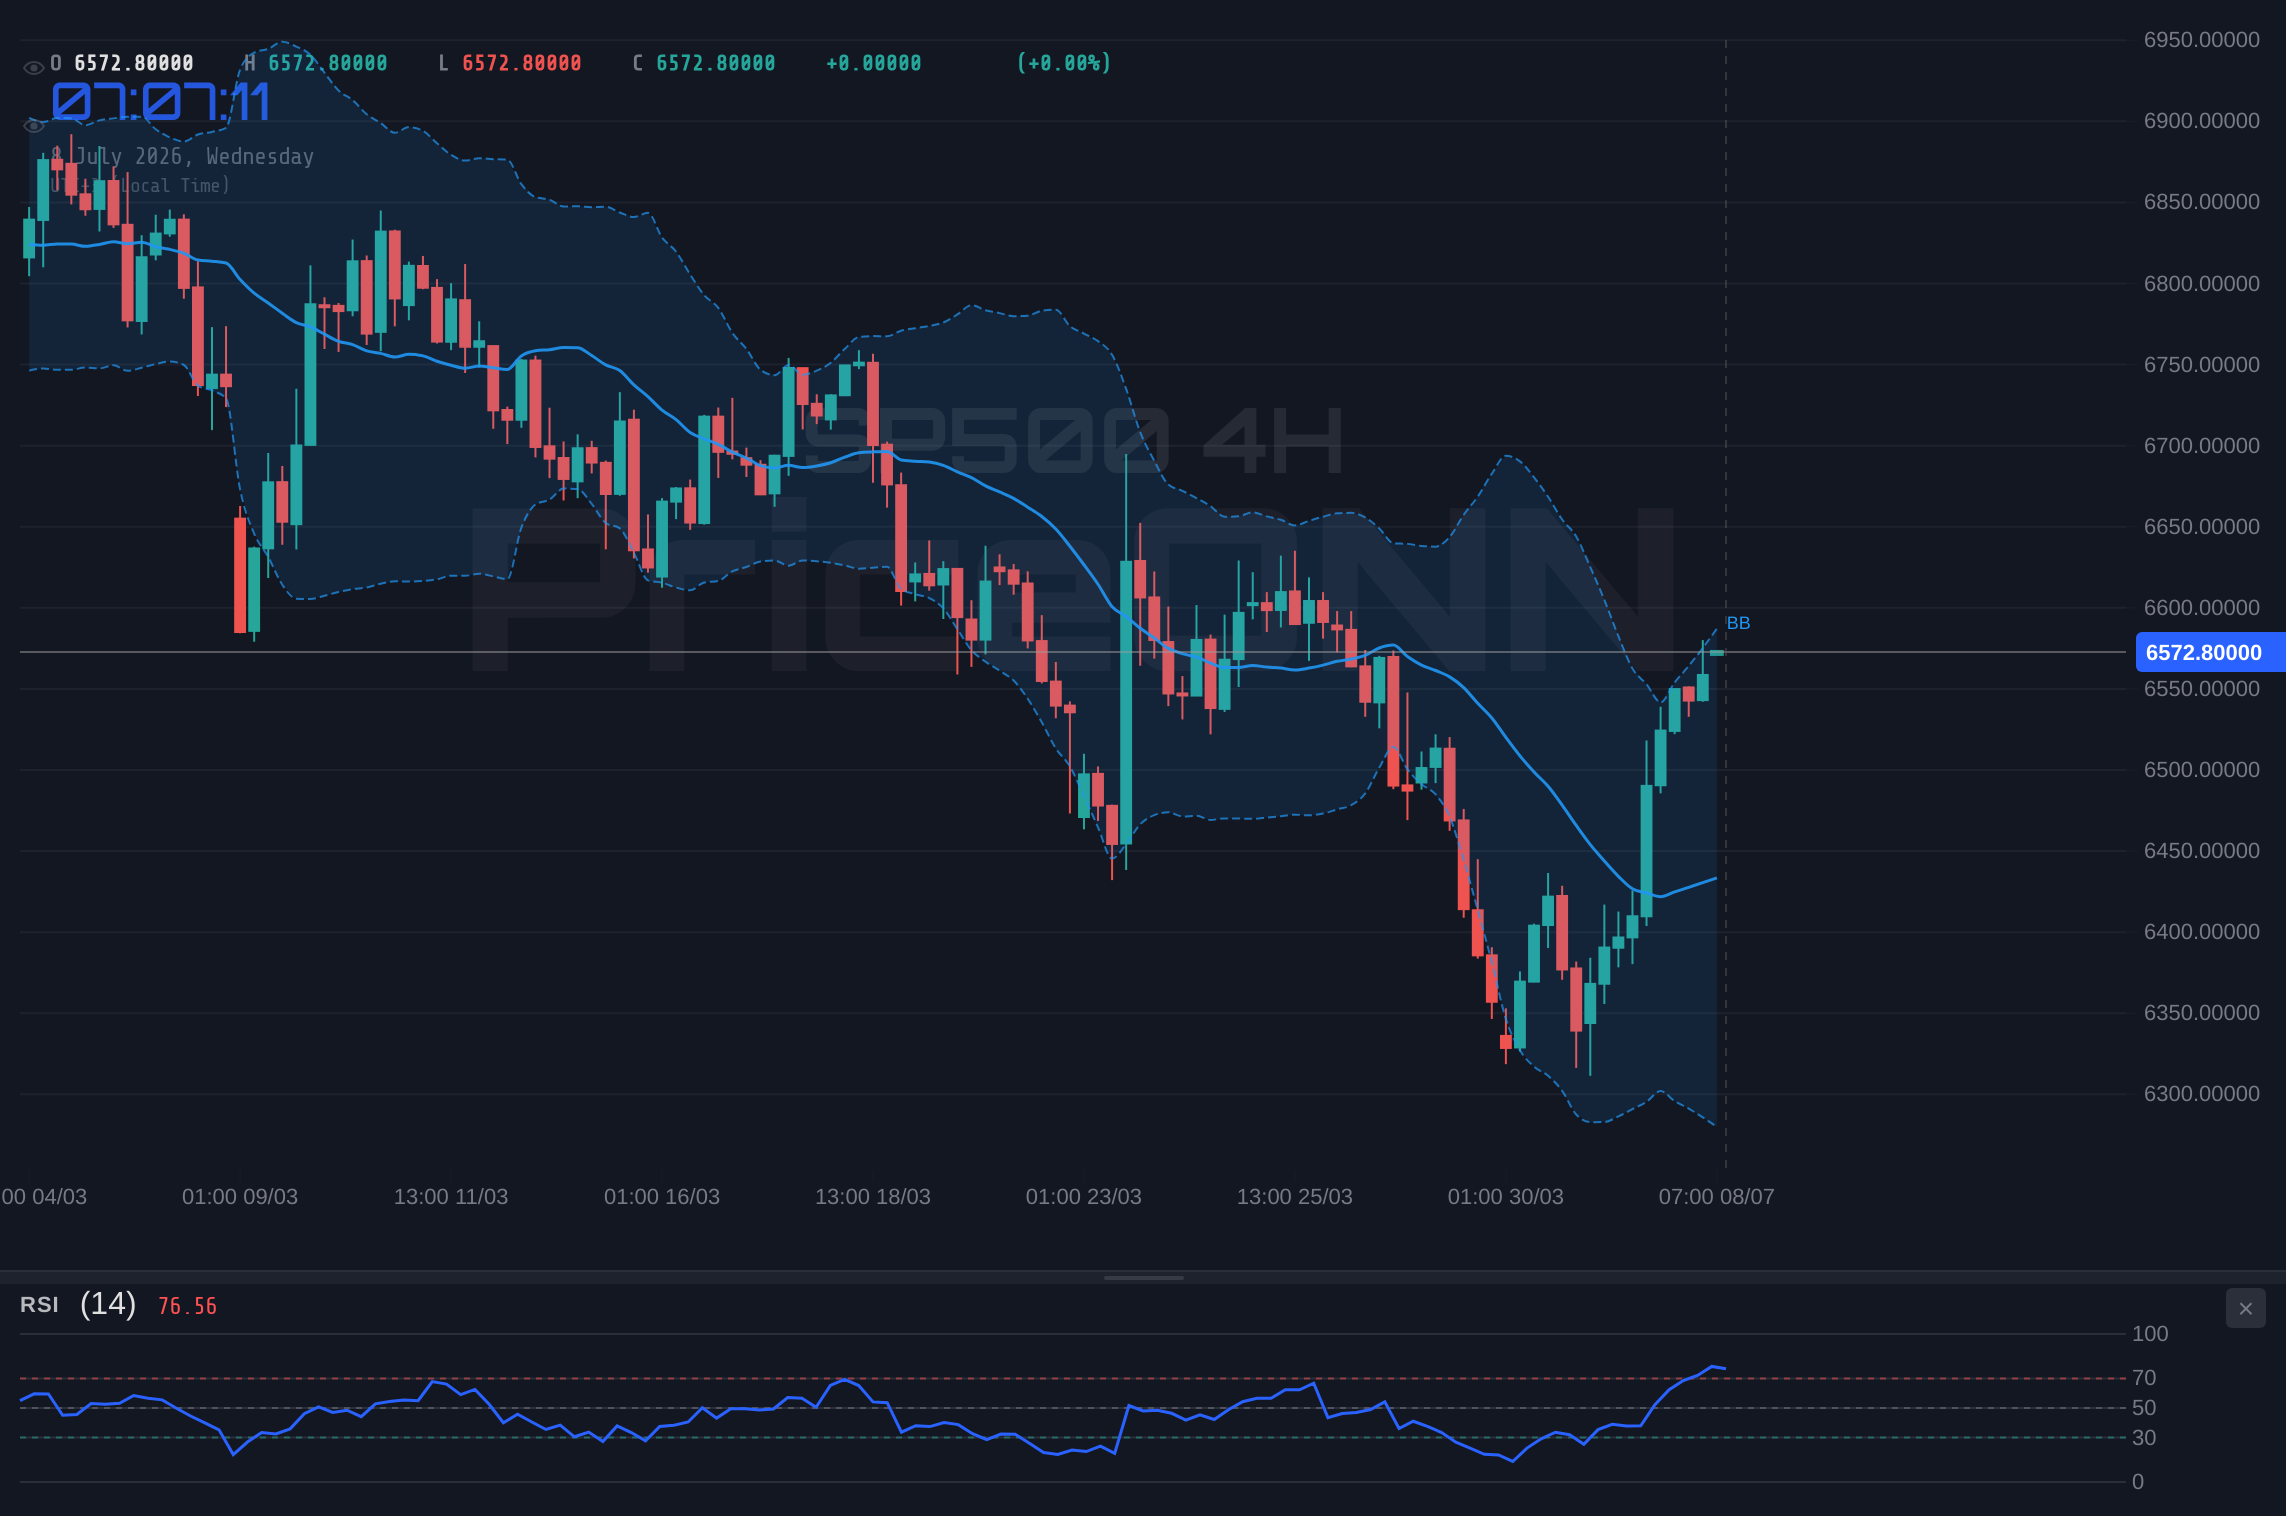
Betrachtet man den 4-Stunden-Zeitrahmen, wird das Bild etwas nuancierter, wenn auch immer noch vorsichtig. Der RSI liegt hier bei 62,83, immer noch im bullischen Bereich, zeigt aber im Vergleich zum 1-Stunden-Chart weniger extreme überkaufte Bedingungen. Das MACD bleibt positiv, was darauf hindeutet, dass der mittelfristige Trend möglicherweise noch an Stärke besitzt. Der Stochastic Oscillator mit K bei 97,85 und D bei 86,96 befindet sich jedoch tief im überkauften Bereich. Dies deutet darauf hin, dass die Aufwärtsbewegung überdehnt wird und ein Rückgang immer wahrscheinlicher wird. Der ADX bei 24,23 deutet auf einen moderaten Aufwärtstrend hin, aber die Kombination aus extremen Stochastic-Werten und der Nähe zum Widerstand legt nahe, dass der Pfad des geringsten Widerstands sich verschieben könnte.
Der Tages-Chart präsentiert eine längerfristige Perspektive, und hier werden die Signale für die Bullen besorgniserregender. Der RSI liegt bei 45,35, was eine neutrale Haltung, aber mit einer Abwärtstendenz anzeigt, was auf mangelnde Überzeugung hinter der jüngsten Aufwärtsbewegung hindeutet. Bedeutsamer ist, dass das MACD eine negative Dynamik zeigt, wobei die MACD-Linie unter ihrer Signallinie liegt. Dies ist ein klassisches bärisches Signal, das oft einem Trendwechsel oder einer signifikanten Korrektur vorausgeht. Die Bollinger-Bänder liegen ebenfalls unterhalb des mittleren Bandes, was die bärische Neigung im Tages-Chart verstärkt. Während der Stochastic ein bullisches Signal mit K über D zeigt, kommt er aus dem überverkauften Bereich und muss erheblichen Widerstand überwinden, um eine anhaltende Rallye zu bestätigen. Der ADX bei 47,51 deutet klar auf einen starken Abwärtstrend im Tages-Chart hin, was der jüngsten Kursentwicklung widerspricht, die einen Aufwärtstrend suggeriert. Diese Divergenz zwischen Kursentwicklung und längerfristigen Trendindikatoren erfordert sorgfältige Überlegung.
Das Konzept der Marktrotation, wie es in aktuellen Nachrichten hervorgehoben wird, ist hier entscheidend. Die jüngsten Gewinne des S&P 500 wurden durch beeindruckende Gewinne und saisonale Faktoren gestützt, aber eine Rotation bedeutet, dass Kapital von einem Sektor oder einer Anlageklasse zur anderen verschoben wird. Wenn die Rotation von Wachstumsaktien zu Value-Aktien oder von Technologie zu defensiveren Sektoren übergeht, kann dies für breite Marktindizes wie den S&P 500 interne Gegenwinde erzeugen, selbst wenn der Hauptindex steigt. Diese Dynamik kann zu einem Markt führen, der sich weniger robust anfühlt, als der Indexpreis vermuten lässt, und ihn anfällig für scharfe Korrekturen macht, wenn wichtige Widerstandsniveaus getestet werden.
Die unmittelbare Kursentwicklung erfordert Aufmerksamkeit. Der S&P 500 wird derzeit bei 6.572,87 Dollar gehandelt. Die erste Verteidigungslinie für die Bullen ist das Widerstandsniveau bei 6.568,73 Dollar, dicht gefolgt von 6.577,27 Dollar und 6.589,83 Dollar. Ein entscheidender Bruch und Halten über diesen Niveaus wäre notwendig, um die kurzfristigen bärischen Signale zu entkräften und eine Fortsetzung des Aufwärtstrends anzudeuten. Umgekehrt könnte ein Scheitern, diesen Widerstandsbereich zu überwinden, dazu führen, dass der Index zu seinen Unterstützungsniveaus zurückkehrt. Die erste signifikante Unterstützung liegt bei 6.547,63 Dollar, gefolgt von 6.535,07 Dollar und 6.526,53 Dollar. Ein Bruch unter diese Niveaus würde die bärische Stimmung bestätigen, die von den Tages-Chart-Indikatoren suggeriert wird, und potenziell weitere Abwärtsbewegungen auslösen.
Die Konvergenz technischer Signale über mehrere Zeitrahmen hinweg zeichnet ein komplexes Bild, das stark auf Vorsicht statt auf reine bullische Überzeugung hindeutet. Die kurzfristigen überkauften Bedingungen auf dem 1-Stunden-Chart, gepaart mit negativer MACD-Dynamik, deuten auf einen möglichen unmittelbaren Verkaufsdruck hin. Der mittelfristige 4-Stunden-Chart zeigt einen Stochastic-Oszillator tief im überkauften Bereich, was darauf hindeutet, dass die aktuelle Bewegung überdehnt ist. Am wichtigsten ist, dass der Tages-Chart einen starken Abwärtstrend zeigt, wie der ADX-Wert von 47,51 anzeigt, trotz der jüngsten Kursgewinne. Diese längerfristige bärische Struktur, kombiniert mit dem stärker werdenden DXY bei 101,1, schafft ein herausforderndes Umfeld für Bullen, die versuchen, den S&P 500 von seinem aktuellen Niveau von 6.572,87 Dollar nach oben zu treiben.
Unter Berücksichtigung der vorherrschenden technischen Gegebenheiten und des breiteren Marktkontexts ist das wahrscheinlichste Szenario eine Periode der Konsolidierung oder ein leichter Rückgang von den aktuellen Niveaus. Die Stärke des täglichen Abwärtstrends legt nahe, dass Erholungen auf Verkaufsdruck stoßen könnten, insbesondere wenn der Index sich dem Widerstand von 6.572,87 Dollar nähert. Die Rotation innerhalb des Marktes impliziert auch, dass nicht alle Komponenten gleichermaßen an der jüngsten Bewegung teilnehmen, was die Fragilität des Aufwärtstrends erhöht. Daher sind, obwohl kein dramatischer Einbruch unmittelbar signalisiert wird, die Chancen eher auf eine Stagnation oder einen Rückzug als auf eine starke Fortsetzung über den Widerstand ohne signifikante fundamentale Katalysatoren oder eine klare Verschiebung der Marktstimmung.
Die Energiemärkte bieten eine weitere Perspektive auf potenzielle Inflationsdrücke und Risikobereitschaft. Brent-Rohöl wird bei 75,92 Dollar und WTI bei 72,55 Dollar gehandelt, beide zeigen Aufwärtsdynamik. Steigende Ölpreise können zu Inflationssorgen beitragen und die Geldpolitik der Zentralbanken beeinflussen, was sich indirekt auf die Aktienmärkte auswirkt. Wenn die Ölpreise aggressiv weiter steigen, könnte dies auf anhaltende Inflationsdrücke hindeuten, was zu einer hawkeren Haltung der Federal Reserve führen könnte, wodurch der DXY gestärkt und der S&P 500 unter Druck gesetzt würde. Diese Vernetzung unterstreicht die Bedeutung der Überwachung der Rohstoffmärkte neben den Aktienindizes.
Die aktuelle technische Konstellation für den S&P 500 bei 6.572,87 Dollar erfordert einen strategischen Ansatz. Die widersprüchlichen Signale zwischen kurzfristiger Kursentwicklung und längerfristigen Indikatoren, kombiniert mit dem Einfluss von DXY und Ölpreisen, deuten darauf hin, dass der Markt an einem Scheideweg steht. Während die Bullen den Index zu diesem Widerstand gedrängt haben, deuten die zugrunde liegenden technischen Daten und makroökonomischen Korrelationen auf eine mögliche Stagnation hin. Händler sollten wachsam bleiben und auf eine Bestätigung entweder eines anhaltenden Ausbruchs über den Widerstand oder eines entscheidenden Bruchs unter die Unterstützung warten. Das Rotationsthema legt nahe, dass die Sektor-spezifische Analyse kurzfristig mehr Klarheit bieten könnte als der Handel auf breiter Indexebene.
Bärisches Szenario: Widerstand hält stand
65% WahrscheinlichkeitNeutrales Szenario: Konsolidierung um 6.572,87 Dollar
25% WahrscheinlichkeitBullisches Szenario: Ausbruch über den Widerstand
10% WahrscheinlichkeitHäufig gestellte Fragen zur S&P 500 Analyse
Was passiert, wenn der S&P 500 über den Widerstand von 6.577,27 Dollar ausbricht?
Ein anhaltender Ausbruch über 6.577,27 Dollar, insbesondere bei erhöhtem Volumen, würde die kurzfristigen bärischen Signale entkräften und die Tür für weitere Aufwärtsbewegungen öffnen. Das nächste wichtige Widerstandsniveau wäre 6.589,83 Dollar, gefolgt von 6.605,07 Dollar. Dieses Szenario hat jedoch derzeit nur eine Wahrscheinlichkeit von 10% basierend auf den vorherrschenden technischen Indikatoren.
Ist der RSI von 70,95 derzeit ein Verkaufssignal für den S&P 500?
Ein RSI-Wert von 70,95 auf dem 1-Stunden-Chart zeigt überkaufte Bedingungen an, was darauf hindeutet, dass die jüngste Rallye überdehnt sein könnte und anfällig für Gewinnmitnahmen ist. Obwohl es kein unmittelbares Verkaufssignal ist, warnt es davor, dass weitere Aufwärtsbewegungen kurzfristig begrenzt sein könnten und erhöht die Wahrscheinlichkeit eines Rückgangs in Richtung Unterstützungsniveaus wie 6.547,63 Dollar.
Wie wird sich der stärkere DXY bei 101,1 diese Woche auf den S&P 500 auswirken?
Ein DXY bei 101,1, der einen stärker werdenden Trend zeigt, übt typischerweise Abwärtsdruck auf US-Aktien wie den S&P 500 aus. Diese umgekehrte Korrelation bedeutet, dass eine anhaltende Dollarstärke als Gegenwind wirken könnte, das Aufwärtspotenzial des Index begrenzt und die Wahrscheinlichkeit einer Bewegung in Richtung Unterstützungsniveaus um 6.535,07 Dollar erhöht.
Sollten Händler erwägen, den S&P 500 auf dem aktuellen Niveau nahe 6.572,87 Dollar zu kaufen?
Da der S&P 500 den Widerstand bei 6.572,87 Dollar testet und auf dem Stunden-Chart überkaufte Bedingungen aufweist, birgt der Kauf auf dem aktuellen Niveau erhebliche Risiken. Der Tages-Chart zeigt ebenfalls einen starken Abwärtstrend mit einem ADX von 47,51. Ein umsichtigerer Ansatz wäre, auf einen bestätigten Ausbruch über den Widerstand oder eine klare Erholung von Unterstützungsniveaus wie 6.547,63 Dollar zu warten, wobei eine Wahrscheinlichkeit von 65 % für eine Abwärtsbewegung vom aktuellen Widerstand spricht.
| Indikator | Wert | Signal | Interpretation |
|---|---|---|---|
| RSI (14) | 70.95 | Überkauft | Kurzfristiger Verkaufsdruck wahrscheinlich |
| MACD Histogramm | Negativ | Bärische Dynamik | Nachlassender Kaufdruck |
| Stochastik | K=65.73, D=73.5 | Bärische Kreuzung | Mögliches Signal für Trendumkehr |
| ADX | 47.51 | Starker Trend | Tages-Chart zeigt starken Abwärtstrend |
| Bollinger Bänder | Mittleres Band | Unterhalb des mittleren Bandes | Tages-Chart deutet auf bärische Tendenz hin |
Märkte in Echtzeit verfolgen
KI-gestützte Analyse und Echtzeit-Preisdaten.
Treten Sie unserem Telegram-Kanal bei
Aktuelle Marktnachrichten und KI-Analysen sofort.
Kanal beitreten