

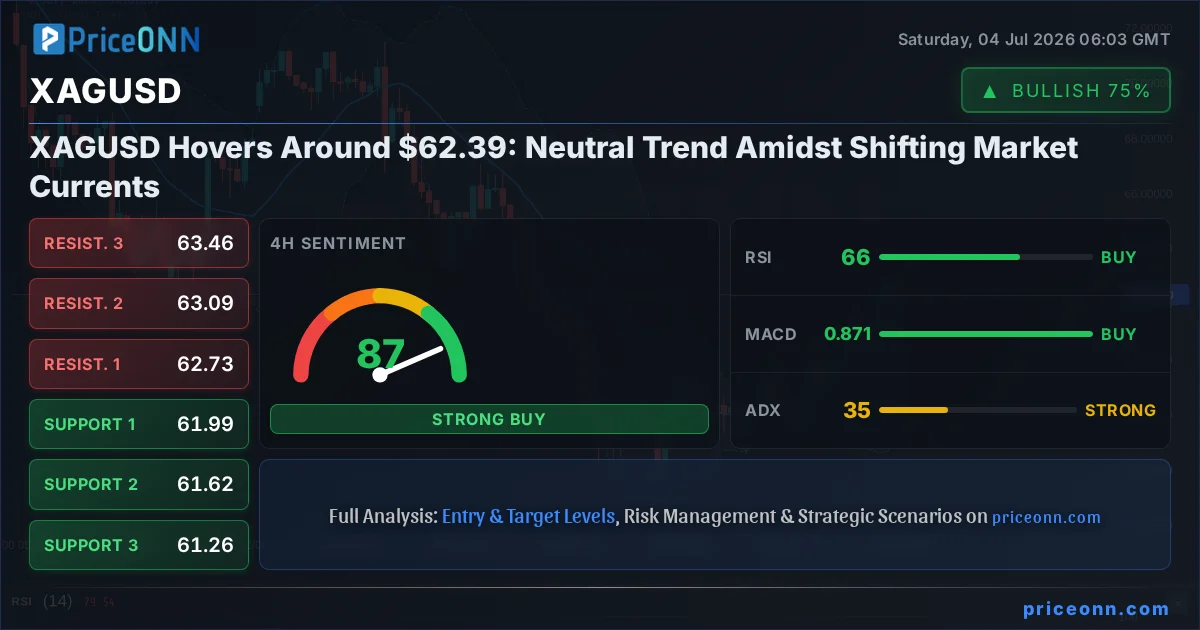
The intricate dance between global economic undercurrents and market sentiment has left silver, or XAGUSD, in a delicate holding pattern. As the past week drew to a close, the precious metal found itself trading around the $62.39 mark, a price point that encapsulates a period of cautious neutrality rather than decisive directional momentum. This equilibrium, however, is precarious, perched at a critical juncture where a confluence of technical indicators and macroeconomic signals suggests that the coming week could be pivotal in determining the next significant move. The neutral trend, while currently defining the XAGUSD's trading range, is underscored by conflicting signals across various timeframes and indicators, painting a complex picture for traders seeking clarity.
- Silver's RSI at 62.05 on the 1H chart signals neutral momentum, while the 4H RSI at 65.5 indicates a slight upward bias within the neutral range.
- Critical support for XAGUSD is observed at $61.99, a level that has held firm, while the immediate resistance stands at $62.73, acting as a ceiling for the current consolidation.
- The ADX reading of 31.57 on the 1H chart suggests a strengthening trend, contrasting with the 1D ADX of 39.05 indicating a strong downward trend, creating a divergence in trend strength signals.
- The interplay between a strengthening US Dollar (DXY at 100.85) and lingering geopolitical tensions creates a complex backdrop, potentially influencing safe-haven demand for silver.
The neutral stance observed in silver's price action is not a sign of market complacency but rather a reflection of competing forces at play. On one hand, the broader macroeconomic environment, characterized by shifting expectations around central bank monetary policies and persistent geopolitical uncertainties, creates an environment where safe-haven assets like silver typically find support. The US Dollar Index (DXY), hovering around 100.85, presents a mixed signal; while not aggressively trending, its presence exerts a subtle pressure on dollar-denominated commodities. Simultaneously, the energy markets, with Brent crude around $71.97 and WTI at $69.1, continue to be influenced by supply-side concerns and demand outlooks, indirectly impacting inflation expectations and, consequently, the appeal of precious metals.
Technically, the 1-hour chart for XAGUSD offers a snapshot of immediate market sentiment, showing a neutral trend with a trend strength of 50%. Key support levels at $62.06, $61.93, and $61.72 are being closely monitored. These levels are crucial for bulls to defend if they are to maintain any upward bias. On the resistance side, $62.40, $62.62, and $62.75 represent immediate hurdles. The RSI(14) at 62.05 suggests a leaning towards bullish momentum without yet entering overbought territory, while the MACD indicator paints a slightly more cautious picture, showing negative momentum with the MACD line below its signal line. This dichotomy highlights the indecision within the market. The Stochastic oscillator, with %K at 43.5 and %D at 40.89, is flashing a bullish signal as %K crosses above %D, adding another layer to the mixed technical picture.
The ADX on the 1-hour timeframe stands at 31.57, indicating a strong uptrend, which seems somewhat at odds with the neutral overall trend strength and the MACD signal. This discrepancy is not uncommon and often signifies that while a trend may be technically present, its conviction is being challenged by counter-forces. The general signal across the 1-hour timeframe leans towards 'BUY' (6 buys, 2 sells, 0 neutral), suggesting that short-term traders might be finding opportunities, but the underlying indecision cannot be ignored. This short-term bullish inclination needs to be viewed within the context of broader, longer-term trends to ascertain its sustainability.
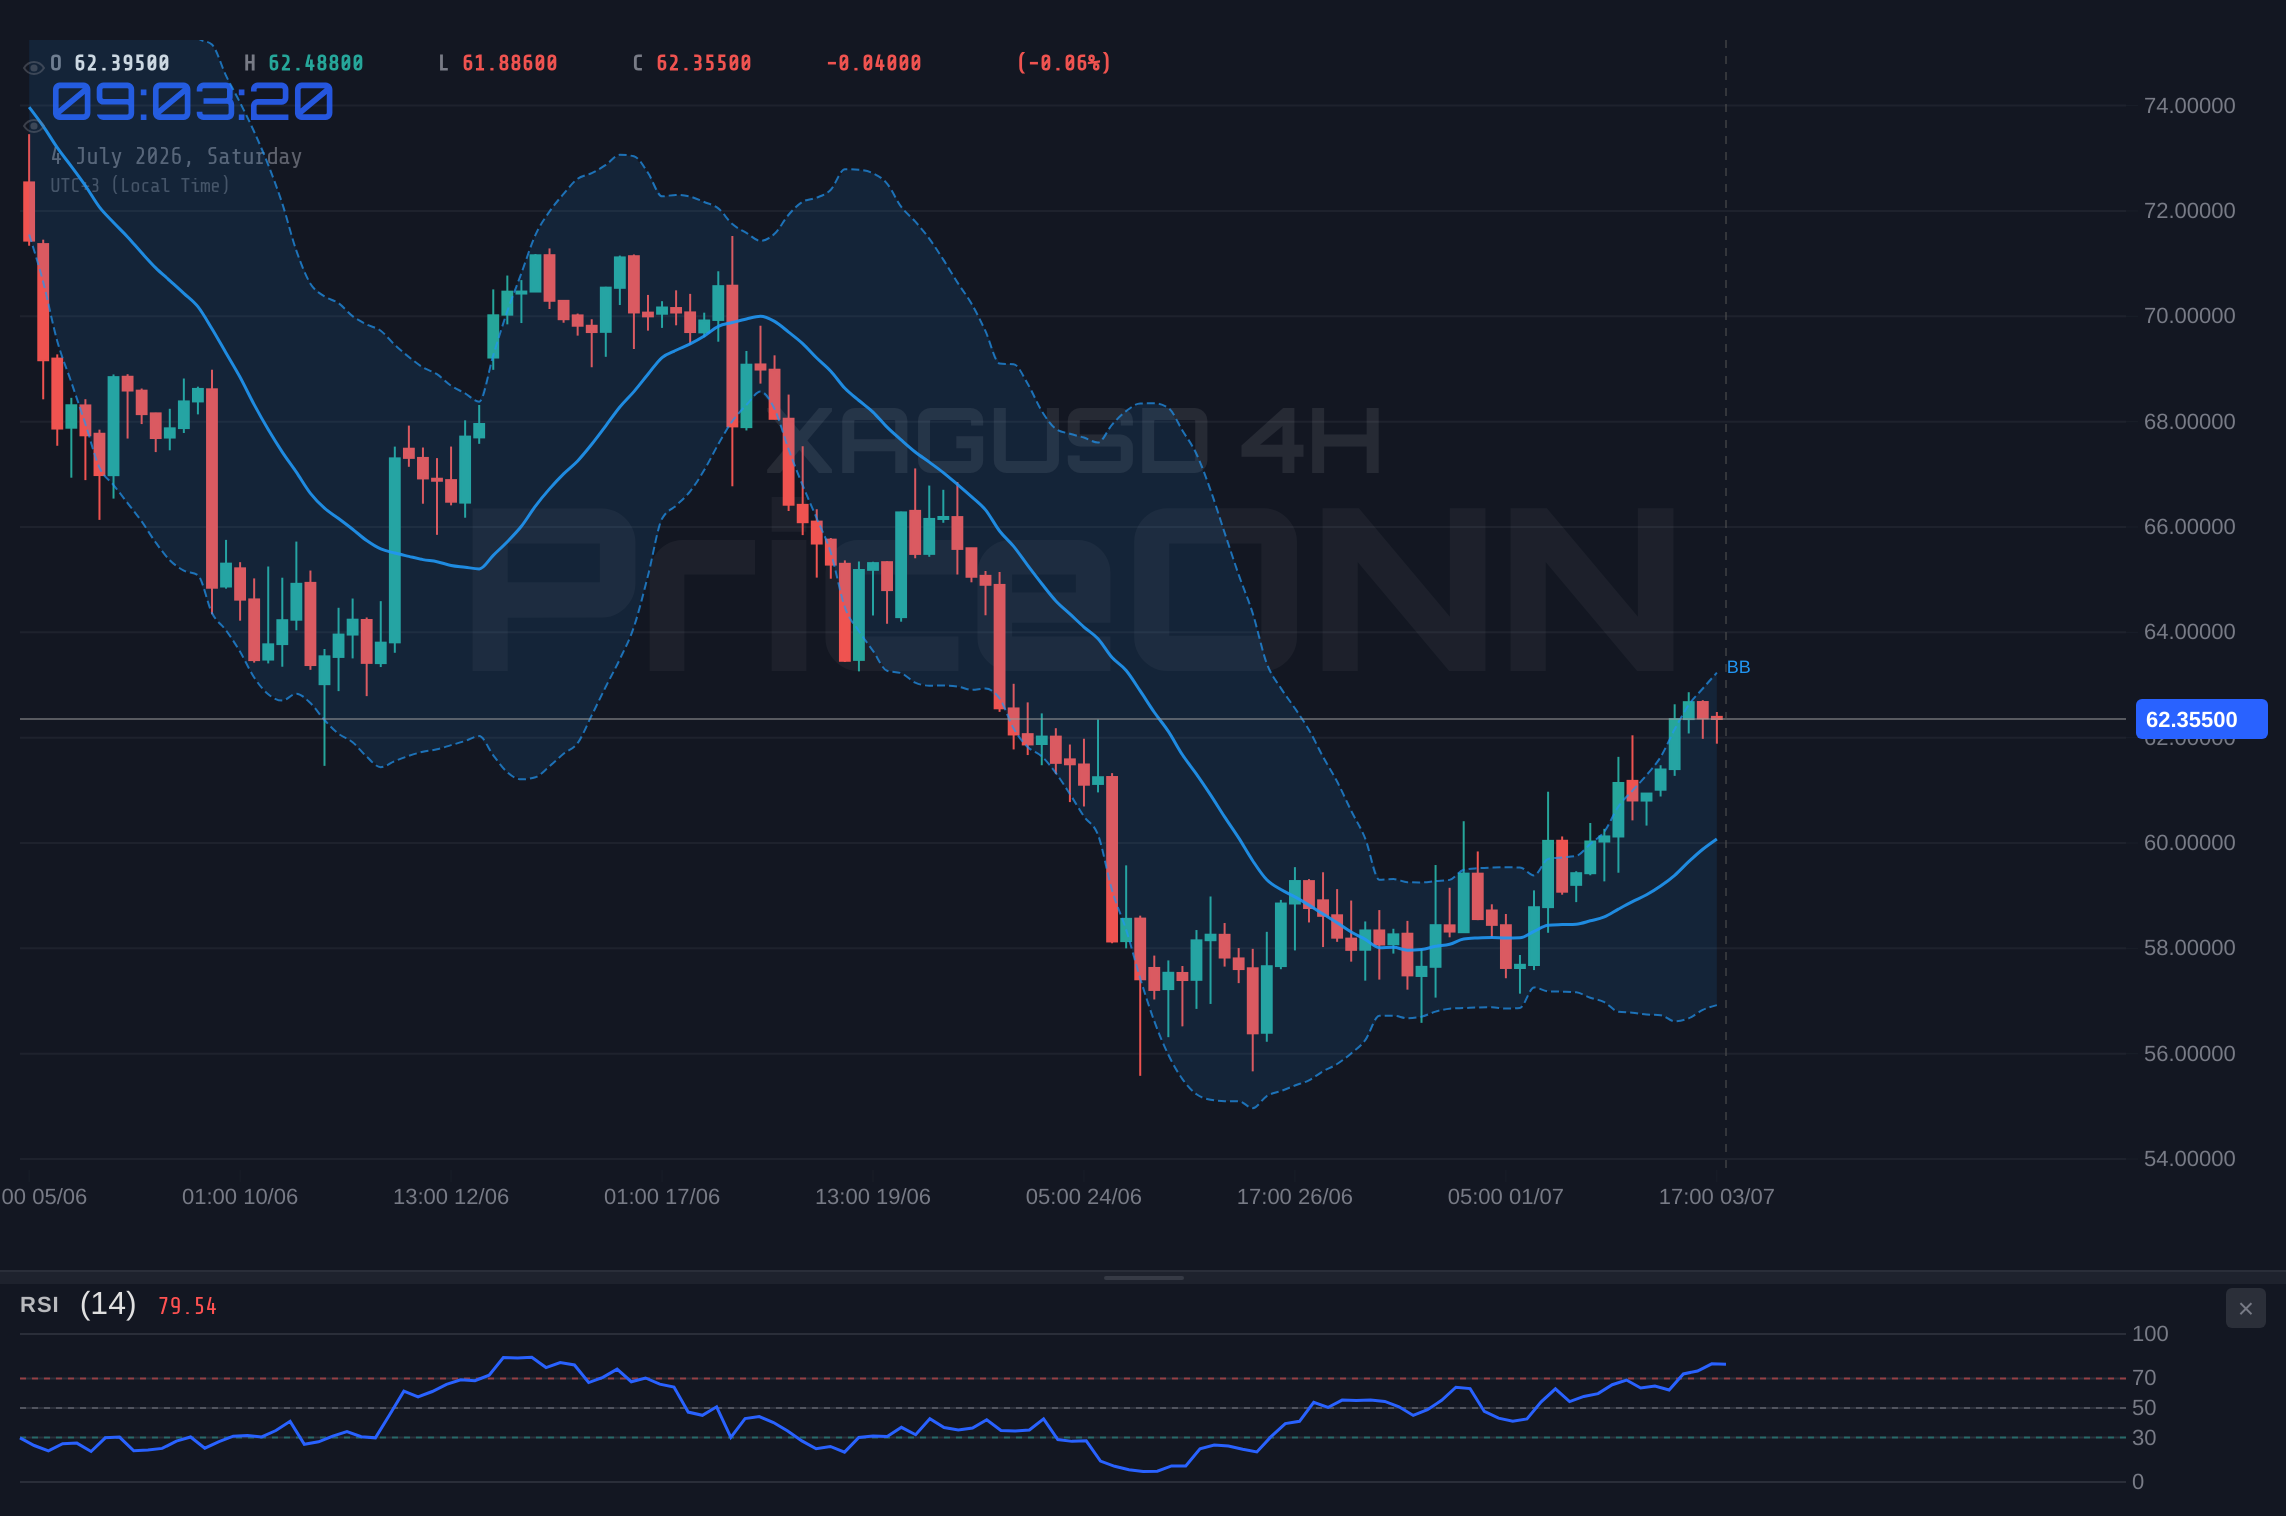
Shifting to the 4-hour timeframe, the picture for XAGUSD becomes more decisively bullish, with a trend strength of 93%. The support levels are found at $61.99, $61.62, and $61.26, which are slightly lower than the 1-hour supports, indicating a potential area of accumulation if price were to pull back. Resistance remains in focus at $62.73, $63.09, and $63.46. The RSI(14) climbs to 65.5, still within the neutral zone but clearly trending upwards, suggesting growing bullish conviction. The MACD here is firmly positive, with the MACD line above its signal line, reinforcing the bullish momentum. The Bollinger Bands show the price trading above the middle band, indicating an upward bias, and the Stochastic oscillator is in overbought territory with %K at 89.39 and %D at 85.25, signaling that the upward momentum might be nearing exhaustion or consolidation.
The ADX at 35.45 on the 4-hour chart confirms a strong uptrend, aligning with the MACD and RSI. However, the extremely overbought Stochastic readings warn of potential pullbacks or sideways action. Traders should be cautious of chasing extended moves and look for consolidation patterns or pullbacks to key support levels before considering fresh entries on the bullish side.
The 4-hour general signal is also 'BUY' (6 buys, 2 sells, 0 neutral), reinforcing the short-to-medium term bullish outlook. This timeframe's data suggests that while caution is warranted due to overbought conditions, the overall sentiment is leaning towards further upside potential, provided key resistance levels can be breached decisively. The strength of the trend indicated by ADX at 35.45 is significant, suggesting that any pullbacks might be shallow and followed by a resumption of the upward move, assuming broader market conditions remain supportive.
However, the daily timeframe introduces a significant counterpoint to the bullish narrative emerging from the shorter timeframes. Here, XAGUSD exhibits a neutral trend with a power of 50%, but the ADX at 40.35 signals a strong *downward* trend. This is a critical divergence that cannot be overlooked. The daily support levels are substantially lower, at $59.20, $57.45, and $56.03, highlighting the significant risk if the bullish momentum falters. Resistance on the daily chart is identified at $62.36, $63.79, and $65.53. The RSI(14) at 46.8 is in the neutral zone but trending downwards, indicating a bearish bias on the daily perspective. The MACD is positive, with the line above the signal, which conflicts with the RSI and ADX, adding to the complexity.
The Stochastic on the daily chart, with %K at 59.82 and %D at 36.53, shows a bullish signal, as %K crosses above %D, and it is moving out of oversold territory. This is perhaps the most contradictory signal within the daily timeframe. Bollinger Bands indicate price is above the middle band, suggesting an upward bias, yet the ADX's strong downward trend signal cannot be dismissed. The overall signal on the daily chart is 'SELL' (3 buys, 5 sells, 0 neutral), strongly suggesting that the longer-term outlook is more cautious, if not outright bearish, despite the short-term strength.
This conflict between timeframes is a classic scenario in technical analysis, often leading to periods of consolidation or whipsaws. The bullish signals on the 1-hour and 4-hour charts might represent a short-term bounce or a corrective move within a larger downtrend suggested by the daily timeframe. Alternatively, the strength of the uptrend signals on the shorter frames could be indicative of a reversal, with the daily chart lagging behind. The ADX readings are particularly noteworthy: a strong uptrend signal on the 1H and 4H (31.57 and 35.45 respectively) versus a strong downtrend signal on the 1D (40.35). This suggests the current upward momentum might be powerful in the short term but faces significant headwinds from longer-term bearish structural forces.
For active traders, the 1H and 4H charts offer opportunities for short-term bullish plays, targeting resistance levels like $62.73 and potentially $63.09. However, any position taken should be managed with tight stop-losses just below the nearest support levels, such as $61.99 or $61.72, anticipating that the daily bearish bias could reassert itself. A daily close below $61.72 would significantly increase the probability of the bearish scenario playing out.
Delving deeper into the macroeconomic drivers, the recent US Non-Farm Payrolls (NFP) data, while not explicitly provided here, has been a significant catalyst in shaping market expectations. News reports indicate that softer US jobs data has weighed on the US Dollar, potentially providing a tailwind for commodities like silver. Reports suggest that cooling US labor market data is lowering the odds of further Federal Reserve rate hikes, which typically benefits non-interest-bearing assets and riskier markets. The GBP/USD pair strengthening above 1.3350 on this news is indicative of the broader dollar weakness narrative. If this trend of dollar weakness persists, it could provide the necessary fuel for XAGUSD to challenge higher resistance levels.
The correlation between the US Dollar Index (DXY) and XAGUSD is a critical factor to monitor. With the DXY currently at 100.85, representing a relatively stable but potentially weakening dollar, silver has room to breathe and potentially advance. Historically, a weaker dollar often correlates with higher prices for gold and silver, as they become relatively cheaper for holders of other currencies and as inflation hedging becomes more attractive. Conversely, any resurgence in dollar strength, perhaps driven by unexpected hawkish commentary from Fed officials or stronger-than-anticipated economic data, could quickly reverse silver's fortunes.
Geopolitical tensions, particularly those in the Middle East, continue to act as a background 'risk-on' or 'risk-off' driver. Reports of lingering Middle East tensions, as mentioned in the context of WTI crude oil prices, can elevate safe-haven demand for precious metals. While the direct impact on silver might be less pronounced than on gold, any escalation of regional conflicts typically correlates with increased volatility across financial markets and a potential flight to perceived safety. Colombia's shrinking oil reserves, while a specific regional issue, highlight broader concerns about energy supply stability, which can feed into inflation concerns and indirectly support precious metals.
Bearish Scenario: Consolidation Breakdown
60% ProbabilityNeutral Scenario: Range-Bound Trading
25% ProbabilityBullish Scenario: Upside Breakout
15% ProbabilityLooking ahead to the next week, the technical landscape for XAGUSD remains balanced on a knife's edge. The conflicting signals between the shorter and longer timeframes necessitate a cautious approach. The $61.99 support level is paramount; a decisive breach of this level on the daily chart would significantly increase the probability of the bearish scenario, targeting lower levels such as $61.62 and $61.26. This would align with the strong downward trend indicated by the daily ADX at 40.35.
Conversely, a sustained move above the $62.73 resistance, particularly on the 4-hour chart with increasing volume and positive MACD momentum, could signal a continuation of the short-term bullish trend. In this case, traders would look towards $63.09 and $63.46 as potential upside targets. The RSI moving out of the neutral zone and the Stochastic showing less extreme readings would further validate this bullish outlook. However, the daily chart's bearish undertones suggest that such a move might face significant selling pressure higher up, potentially capping gains.
The macroeconomic calendar will undoubtedly play a crucial role. The release of the June FOMC meeting minutes next week is a key event that could provide further insight into the Federal Reserve's monetary policy stance. Any hints of a more hawkish tone could strengthen the dollar and pressure silver, while a more dovish outlook could support precious metals. Additionally, any significant developments in geopolitical hotspots or major shifts in energy market dynamics could inject volatility and influence safe-haven flows, potentially breaking silver out of its current neutral range.
The current technical setup, characterized by the ADX readings suggesting strong trends on multiple frames but in opposing directions (1H/4H up, 1D down), indicates a market in flux. The RSI levels are hovering in a zone that is neither definitively overbought nor oversold on the daily, but leaning towards caution on the shorter frames. This suggests that while there's potential for short-term gains, the longer-term trend remains uncertain and heavily influenced by macro factors. Traders should pay close attention to the price action around the $61.99 and $62.73 levels, as these will likely dictate the short-to-medium term direction.
Frequently Asked Questions: XAGUSD Price Analysis
What happens if XAGUSD breaks below the $61.99 support level this week?
A daily close below $61.99 would invalidate the short-term bullish bias and align with the daily chart's bearish trend signals. This could trigger a sell-off towards the next key support levels at $61.62 and potentially $61.26, as indicated by the 4-hour timeframe analysis.
Should traders consider buying XAGUSD at current levels of $62.39 given the mixed signals?
Aggressive traders might look for short-term opportunities on pullbacks to $61.99, targeting a move towards $62.73 with tight stops below $61.72. However, a more conservative approach would be to wait for a clear break above $62.73 or a confirmed daily trend signal, given the conflicting indicators.
Is the RSI at 62.05 on the 1H chart a buy signal for XAGUSD?
An RSI reading of 62.05 on the 1-hour chart suggests mild bullish momentum but is not yet in overbought territory. While it supports a short-term upward bias, it should be considered alongside other indicators and price action, especially the daily chart's trend, for a comprehensive trading decision.
How will the upcoming FOMC meeting minutes affect XAGUSD's price this week?
The FOMC minutes could significantly impact XAGUSD by influencing US Dollar strength. If the minutes reveal a more hawkish Fed stance, it could lead to dollar appreciation and pressure silver prices downwards. Conversely, dovish undertones might weaken the dollar and support silver's advance.
Technical Outlook Summary
| Indicator | Value | Signal | Interpretation |
|---|---|---|---|
| RSI (14) | 62.05 | Neutral | Leaning bullish on 1H, but cautious on daily |
| MACD Histogram | -0.03 | Bearish | Negative momentum on 1H, conflicting signals |
| Stochastic | 43.5 / 40.89 | Bullish | Bullish crossover on 1H, but watch for overbought on 4H |
| ADX | 31.57 | Bullish | Strong uptrend on 1H, but daily trend is down (40.35) |
| Bollinger | Middle Band | Watch | Price above middle band on 1H/4H, below on 1D |
Key Levels for XAGUSD
Support Levels
Resistance Levels
Track markets in real-time
AI-powered analysis, technical indicators and real-time price data.
Join Our Telegram Channel
Breaking market news, AI analysis and trading signals instantly.
Join Channel