

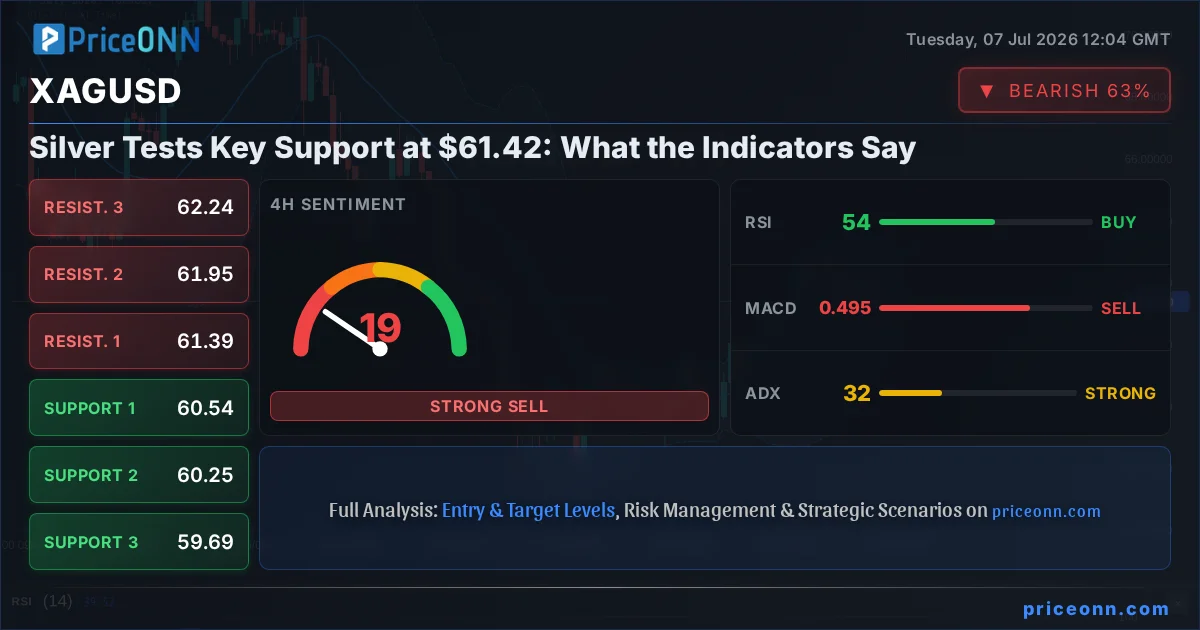
Silver, or XAGUSD, is currently navigating a crucial juncture, trading at $61.42. This price point finds the metal testing significant support levels, a scenario that demands close attention from traders and investors alike. The past few days have seen a notable shift in momentum, with the daily change registering a -0.95% decline, translating to a $0.59 drop. This movement has pushed XAGUSD towards its immediate support zones, making the current price action a critical watch for discerning the next directional bias. The interplay between macroeconomic factors and technical indicators is particularly sharp here, offering a complex but potentially rewarding landscape for those who can decipher the signals.
- XAGUSD is currently trading at $61.42, testing key support levels.
- The RSI(14) is at 50.47 on the 1H chart, indicating a neutral stance but with an upward lean.
- ADX readings suggest a strengthening trend across multiple timeframes, with 32.14 on the 4H chart pointing to significant trend power.
- Key support is identified at $60.64, while resistance looms at $60.98 on the 1H timeframe.
- The interplay between the DXY's strength and broader market sentiment will be crucial for silver's next move.
Navigating the Support Levels: A Tactical Breakdown
The immediate price action for XAGUSD reveals a challenging environment as it hovers around the $61.42 mark. On the 1-hour chart, the trend is decidedly bearish with a high conviction power of 92%, a stark contrast to the neutral 50% power on the 4-hour and daily charts. This divergence in trend strength across timeframes suggests a battleground where short-term sentiment is currently favoring sellers. The immediate support levels are clearly defined: $60.64, $60.51, and $60.29. A break below these levels on increased volume could signal a deeper correction. Conversely, resistance on the 1-hour chart is capped at $60.98, $61.20, and $61.33. The current price of $61.42 sits precariously close to the highest resistance on this timeframe, indicating that any immediate upward push will face strong headwinds. This proximity to resistance, while testing support, creates a tight range that often precedes a significant price move.
The 4-hour technical picture presents a more balanced, albeit still cautious, outlook. While the trend is officially neutral, the ADX at 33.59 indicates a strong trend is in play, a common occurrence during periods of consolidation before a breakout. Here, support is found at $60.54, $60.25, and $60.29. Resistance is higher up, at $61.39, $61.95, and $62.24. The RSI(14) at 53.55 on this timeframe suggests a neutral leaning with a slight upward tendency, a subtle hint that buyers might be lurking. However, the Stochastic indicator, with its %K line at 15.4 and %D at 27.54, presents a bearish signal, suggesting that downward momentum might persist in the short to medium term. This conflicting signal between RSI and Stochastic on the 4H chart underscores the indecision in the market, making it crucial to monitor price action around the key levels.
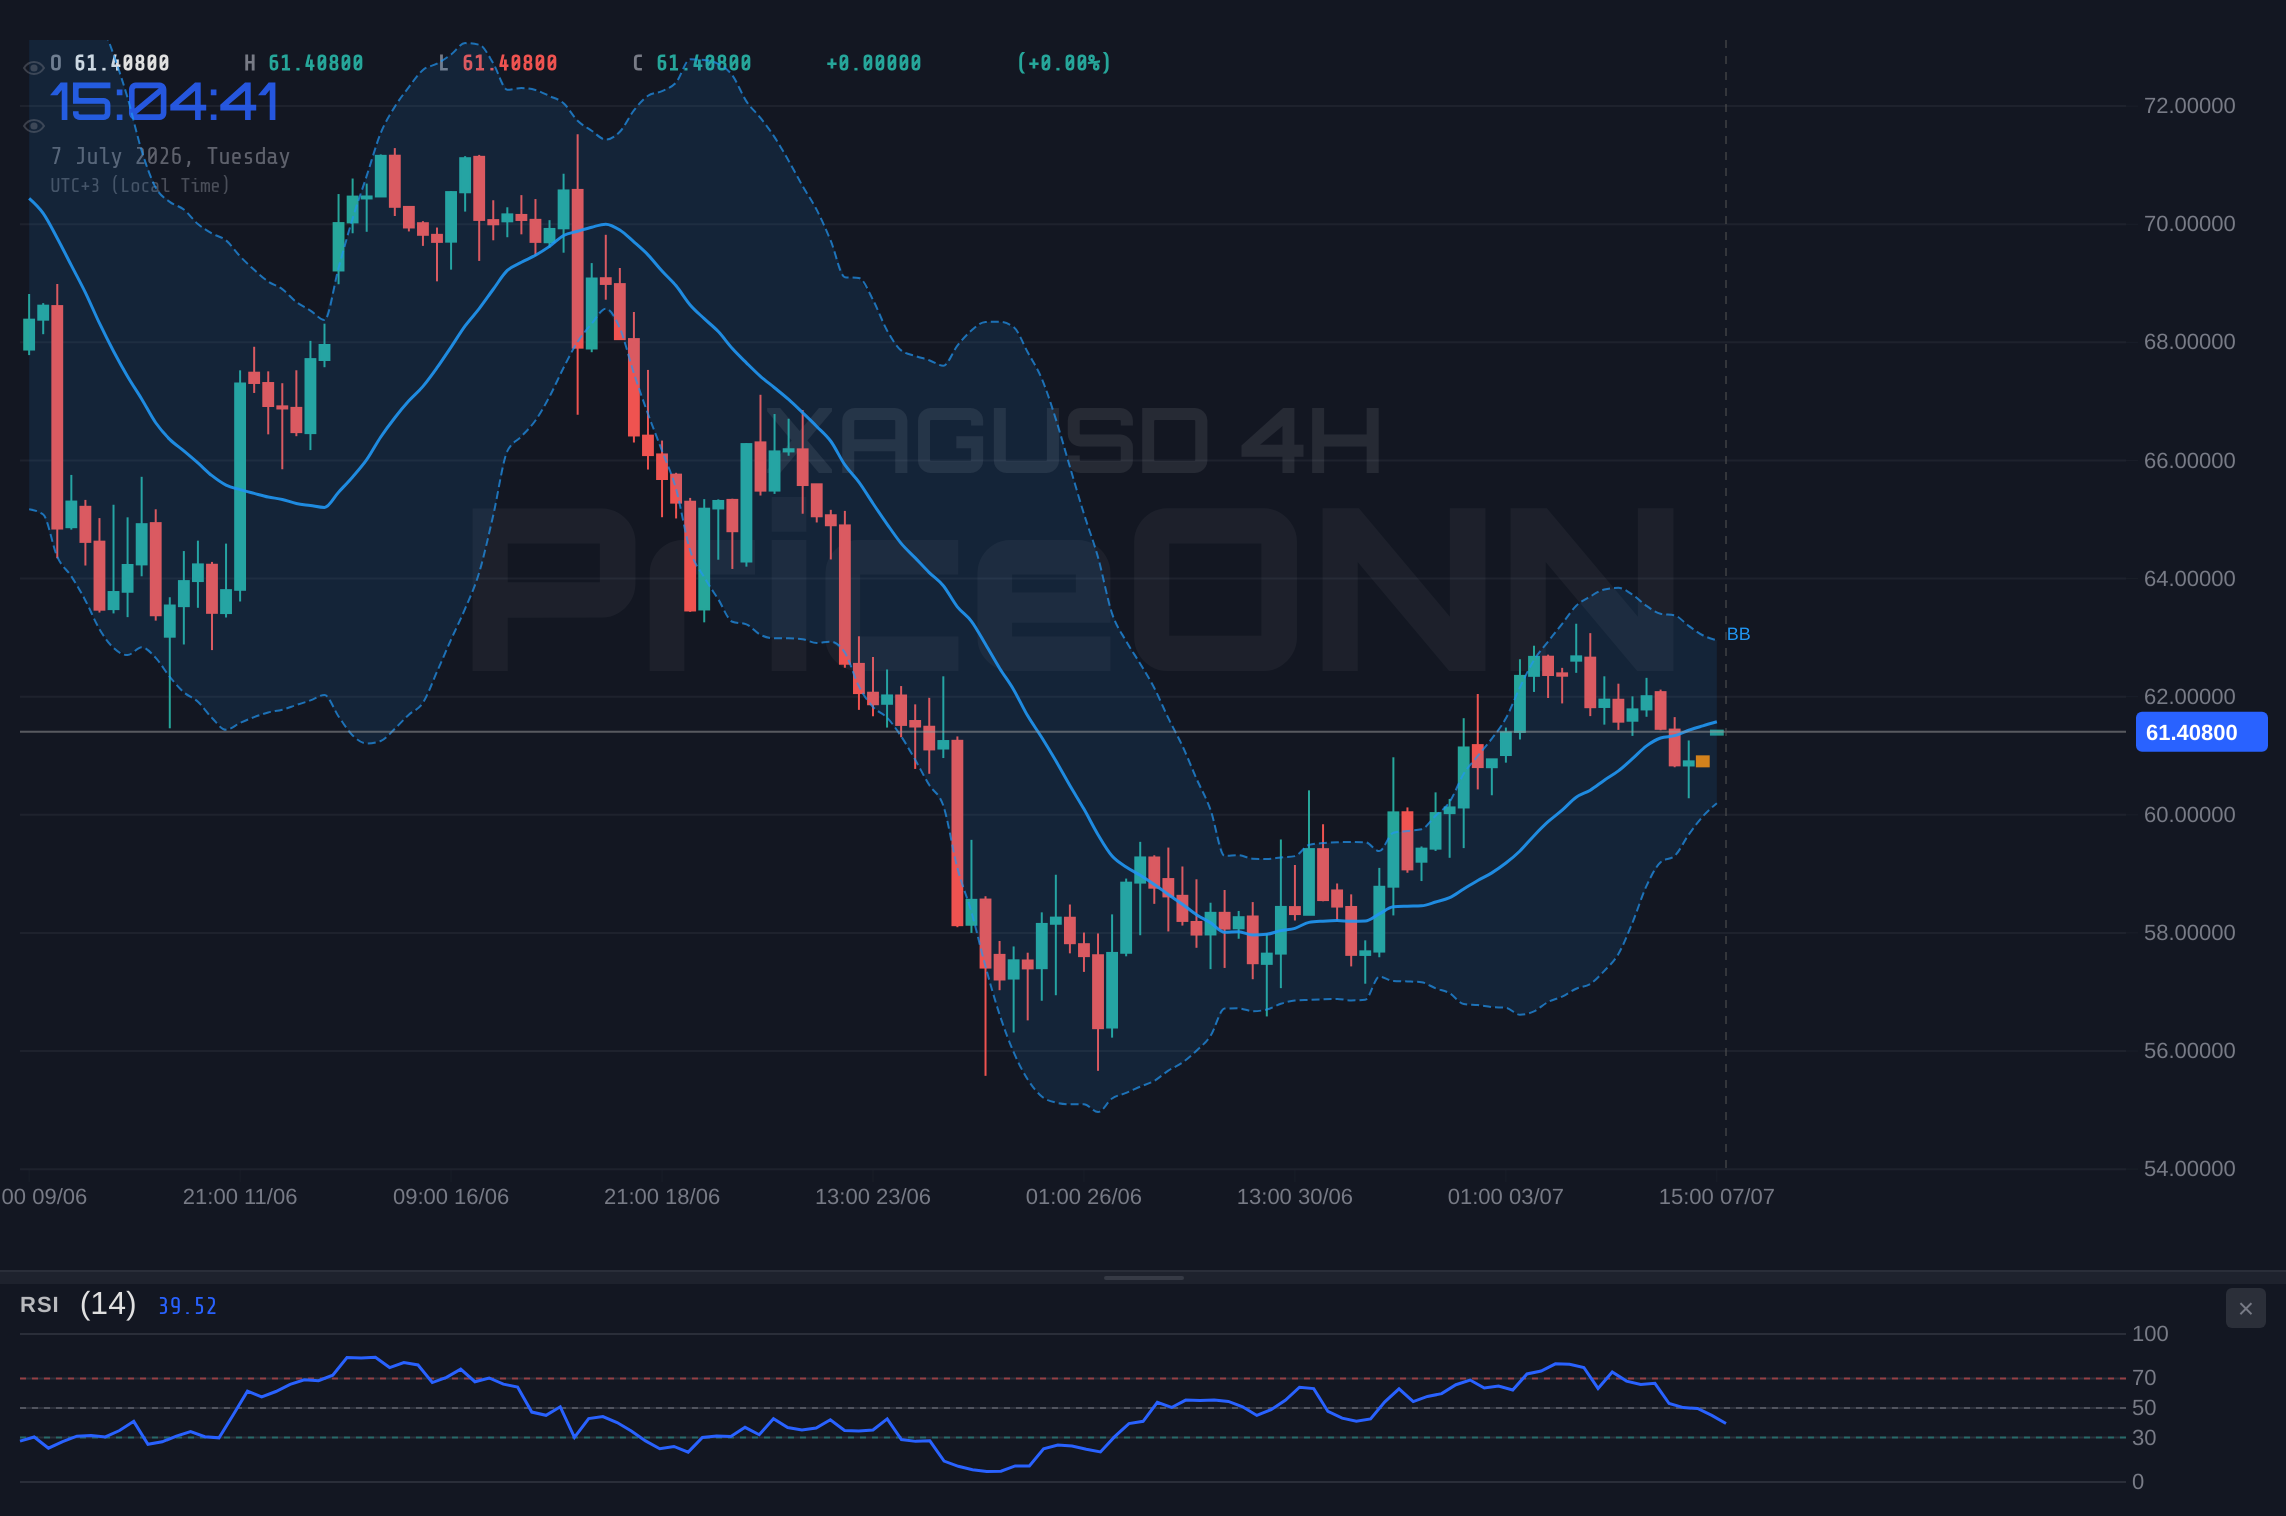
Zooming out to the daily chart, the trend is also neutral, but the ADX at 38.17 signifies a strong trend, which is somewhat contradictory given the neutral trend classification. This suggests a powerful underlying trend that might be consolidating or retesting prior moves. Support levels are more substantial here, found at $61.15, $60.29, and $59.25. The price of $61.42 is well above these significant floors. Resistance, however, is considerably higher, starting at $63.05, then $64.09, and extending to $64.95. The daily RSI(14) at 45.77 indicates a slight bearish tilt, suggesting that sellers have had an edge recently, but it's far from oversold territory. The MACD shows positive momentum with its line above the signal line, and the Stochastic K=86.47, D=51.21, is in overbought territory, pointing towards potential upside but also hinting at a possible pullback soon. This daily chart analysis paints a picture of a market that has pulled back but is holding above crucial long-term support, with indicators offering mixed signals that require careful interpretation.
Indicator Symphony: Decoding the Signals
Delving deeper into the technical indicators across different timeframes provides a richer tapestry of XAGUSD's potential path. On the 1-hour chart, the RSI(14) at 50.47 sits squarely in neutral territory, offering little directional bias but showing a slight upward inclination. This is complemented by a MACD that, while showing negative momentum, has its histogram above the signal line, suggesting that the selling pressure might be abating. The Stochastic oscillator on this timeframe presents a bullish signal with %K at 59.05 and %D at 36.46, indicating that buyers could be stepping in. However, the ADX at 23.87 points to a moderately strong trend in play, which, given the prevailing bearish sentiment on this timeframe, leans towards continuation of the current move. The overall signal for the 1H leans 'BUY' with 6 buy, 2 sell, and 0 neutral signals, a surprising strength given the price action.
The 4-hour chart offers a more bearish technical outlook, despite the neutral trend classification. The RSI(14) at 53.55 is again neutral but leans upward. However, the MACD here is definitively bearish, with negative momentum and its line below the signal line, indicating that sellers are in control on this intermediate timeframe. The Stochastic oscillator is bearish, with %K at 15.4 and %D at 27.54, firmly in oversold territory and signaling potential downside. The ADX at 32.14 confirms a strong trend, and in this context, points towards further downside. The overall signal here is 'SELL' (3 buy, 5 sell, 0 neutral), aligning more closely with the immediate price pressure observed.
On the daily chart, the indicators present a complex picture. The RSI(14) at 45.77 suggests a bearish bias, but it's well off oversold conditions. The MACD shows positive momentum, with the MACD line above its signal line, indicating that longer-term buyers might be accumulating positions. The Stochastic oscillator is strongly bullish, with %K at 86.47 and %D at 51.21, indicating a strong upward signal, albeit in overbought territory which could precede a reversal. The ADX at 37.92 signifies a strong trend, and given the RSI's bearish lean, this likely points to a strong downward trend in play. The overall signal for the daily timeframe is 'NEUTRAL' (4 buy, 4 sell, 0 neutral), reflecting the conflicting signals and the market's indecision on the longer horizon. This multi-timeframe analysis reveals a clear short-term bearish pressure battling against potential longer-term bullish undercurrents, with the 4-hour chart providing the most bearish indication.
Correlations and Macroeconomic Currents
Understanding XAGUSD's price action requires looking beyond its own charts to its correlations with major market drivers, particularly the US Dollar Index (DXY) and broader equity markets like the S&P 500 and Nasdaq. The DXY is currently at 100.92, showing a slight upward bias with a 0.08% daily increase. Historically, a strengthening dollar often exerts downward pressure on silver prices, as precious metals become more expensive for holders of other currencies. The current DXY level, while not excessively high, is in a zone that can contribute to headwinds for silver. The S&P 500 is trading at 6572.87 with a 0.74% daily gain, and the Nasdaq at 29406.02 with a -1.01% daily loss. The divergence between these two major indices is noteworthy. The S&P 500's strength suggests some risk appetite, which could be supportive of riskier assets, while the Nasdaq's decline might indicate a rotation away from growth stocks, potentially leading to a slight risk-off sentiment that could indirectly benefit safe-haven assets like silver, although its price action is currently bearish.
The relationship between silver and oil prices also warrants attention. Brent crude is trading at $72.62, up 0.88%, and WTI at $69.37, up 0.76%. Rising oil prices can be an indicator of inflationary pressures, which historically tend to be supportive of precious metals like silver, as they are seen as a hedge against inflation. The current upward move in oil prices, while moderate, could provide a subtle underlying support for silver, counteracting some of the dollar's strength. However, the immediate technical picture for silver suggests that this inflationary hedge narrative is not currently dominating price action. The conflicting signals from the DXY, equities, and oil prices highlight the complexity of the current market environment, where multiple macro factors are pulling silver in different directions.
Geopolitical tensions, though not explicitly detailed in the provided market data, always play a background role for precious metals. Any escalation in global conflicts or significant political uncertainty can increase demand for safe-haven assets, providing a potential boost to silver prices. Conversely, periods of geopolitical calm can reduce this safe-haven demand. Without specific news events highlighted in the provided data, we rely on the current market sentiment reflected in the indices and DXY. The mixed signals from equities and the dollar suggest that geopolitical risk appetite is currently in a state of flux, neither strongly risk-on nor risk-off, leaving silver vulnerable to its own technical drivers and currency movements.
Trade Scenarios: Mapping the Path Forward
Given the current technical configuration and prevailing market conditions, several scenarios for XAGUSD's price movement emerge. The key lies in how price action interacts with the identified support and resistance levels, and whether the conflicting indicator signals resolve in a clear direction.
Bearish Scenario: Testing Lower Supports
60% ProbabilityNeutral Scenario: Consolidation Around $61.42
25% ProbabilityBullish Scenario: Reclaiming Higher Ground
15% ProbabilityThe current technical setup, particularly the bearish signals on the 4-hour chart and the short-term bearish trend on the 1-hour, makes the bearish scenario the most probable outcome in the immediate future. However, the presence of strong support levels on the daily chart and some bullish undertones in longer-term indicators mean that a sustained breakdown is not guaranteed. Traders should exercise caution and wait for clear confirmation before committing to a direction. The ADX readings across timeframes suggest that a trend is indeed developing; the question is whether it will be to the downside or if the current support levels will hold, leading to a reversal.
The conflicting signals across timeframes and indicators mean that XAGUSD is currently in a high-volatility zone. Traders should prioritize risk management, utilizing tight stop-losses and considering smaller position sizes. The proximity of key support and resistance levels on the 1-hour chart suggests that intra-day traders may find opportunities, but longer-term positions should await clearer directional confirmation. The strength of the ADX indicator across multiple timeframes indicates that a trend is likely to emerge soon; the challenge is identifying its direction correctly.
| Indicator | Value | Signal | Interpretation |
|---|---|---|---|
| RSI (14) 1H | 50.47 | Neutral | Slight upward bias |
| MACD 1H | Positive Momentum | Bullish | Selling pressure abating |
| Stochastic 1H | K=59.05, D=36.46 | Bullish | Buyers stepping in |
| ADX 1H | 23.87 | Moderate Trend | Trend in play |
| RSI (14) 4H | 53.55 | Neutral | Slight upward bias |
| MACD 4H | Negative Momentum | Bearish | Sellers in control |
| Stochastic 4H | K=15.4, D=27.54 | Bearish | Potential downside |
| ADX 4H | 32.14 | Strong Trend | Supports downside move |
| RSI (14) 1D | 45.77 | Bearish Bias | Sellers had edge |
| MACD 1D | Positive Momentum | Bullish | Long-term buyers active |
| Stochastic 1D | K=86.47, D=51.21 | Bullish | Overbought, potential reversal |
| ADX 1D | 37.92 | Strong Trend | Confirms trend, likely down |
Key Levels and Price Action Dynamics
The immediate battleground for XAGUSD is clearly defined by the $60.64 support and $61.33 resistance on the 1-hour chart. A decisive break below $60.64, particularly if accompanied by increasing volume and bearish divergence on shorter timeframes, would validate the bearish scenario and open the door towards $60.51 and the more significant $60.29 support. This level ($60.29) is crucial as it appears on multiple timeframes and represents a more substantial floor. Conversely, a strong push above $61.33, ideally with bullish confirmation from indicators like the RSI moving out of neutral territory and MACD showing renewed positive momentum, could signal a shift. In such a case, the immediate targets would be the 4-hour resistance levels at $61.39 and $61.95. The current price of $61.42 is caught in this tight range, highlighting the importance of patience and waiting for a clear breakout or breakdown signal. The strength indicated by the ADX across timeframes suggests that this consolidation is unlikely to last indefinitely, and a significant price move is likely on the horizon.
The influence of the US Dollar Index (DXY), currently at 100.92, cannot be overstated. A sustained rise in the DXY typically correlates with a fall in silver prices, as the dollar's strength makes silver more expensive for international buyers. While the DXY's current move is modest, any further appreciation could add pressure on XAGUSD, reinforcing the bearish technical signals. The performance of major equity indices also provides context. The S&P 500's gain at 6572.87 contrasts with the Nasdaq's loss at 29406.02, indicating a mixed risk sentiment. This can sometimes lead to a flight to safety, which could support silver, but the current technical setup leans more towards dollar strength and specific asset weakness.
The oil market, with Brent at $72.62 and WTI at $69.37, presents a potential inflationary signal that could support silver. Rising energy prices often correlate with increased inflation expectations, a scenario where precious metals typically perform well as a hedge. However, for silver to capitalize on this, the bearish technical signals need to abate, and the dollar's influence needs to lessen. The current price action suggests that the dollar's impact and the immediate bearish technicals are overriding the inflationary narrative for now. Traders should remain attuned to upcoming economic data, particularly any releases that could influence Federal Reserve policy expectations, as these will likely be key drivers for both the DXY and XAGUSD.
Frequently Asked Questions: XAGUSD Analysis
What happens if XAGUSD breaks below the $60.64 support level?
A decisive break below $60.64 on the 1-hour chart would invalidate the immediate bullish consolidation and likely target the $60.51 and $60.29 support levels. This scenario is currently favored with a 60% probability, given the bearish signals on the 4-hour chart and the ADX indicating a strong trend is in play.
Should I consider buying XAGUSD at current levels around $61.42, given the mixed signals?
Buying at current levels ($61.42) carries significant risk due to the bearish technicals on the 4-hour chart and strong resistance at $61.33. A more prudent approach would be to wait for a clear confirmation, such as a hold above $61.42 with bullish indicator divergence, or a confirmed bounce from the $60.29 support level. The neutral scenario (25% probability) suggests consolidation, offering limited upside potential without a clear catalyst.
Is the RSI at 50.47 on the 1H chart a sell signal for XAGUSD?
An RSI reading of 50.47 is considered neutral, indicating neither overbought nor oversold conditions. While it shows a slight upward inclination, it does not, on its own, constitute a sell signal. It suggests a balanced market sentiment on the 1-hour timeframe, which is currently overshadowed by stronger bearish signals from other indicators like the 4-hour Stochastic and ADX.
How will the DXY's movement at 100.92 affect XAGUSD's price forecast this week?
The current DXY level of 100.92, showing a slight upward trend, generally exerts downward pressure on XAGUSD. If the DXY continues to strengthen, it will likely reinforce the bearish technical outlook for silver, potentially pushing it towards lower support levels. Conversely, a weakening DXY would offer some relief and could support a potential bounce from current price levels.
The path forward for XAGUSD hinges on its ability to either decisively break through immediate resistance at $61.33 or hold firm above the critical support zone starting at $60.64. The prevailing bearish sentiment on shorter timeframes, supported by the strong trend indication from the ADX, suggests that further downside is the more probable immediate outcome. However, the presence of significant support on the daily chart and mixed long-term indicator signals mean that a sharp reversal cannot be entirely dismissed. Traders must remain vigilant, employing strict risk management protocols and waiting for clear confirmation before entering positions. The market is at a crossroads, and the next few trading sessions will be pivotal in determining whether silver succumbs to selling pressure or finds footing to rebound.
| Indicator | Value | Signal | Interpretation |
|---|---|---|---|
| RSI (14) | 50.47 | Neutral | Balanced momentum |
| MACD | -0.59 | Bearish | Negative momentum developing |
| Stochastic | K=59.05, D=36.46 | Bullish | Potential upside indicated |
| ADX | 32.14 | Strong Trend | Trend continuation likely |
| Bollinger | Middle Band | Watching | Price holds above mid-band |
Track markets in real-time
AI-powered analysis, technical indicators and real-time price data.
Join Our Telegram Channel
Breaking market news, AI analysis and trading signals instantly.
Join Channel