

Gold just did something the bulls have been waiting months for, but is it a sustainable shift or a fleeting moment? As XAUUSD hovers around the critical $4,150 mark, the market is grappling with a complex interplay of factors, from a strengthening Dollar Index to diverging technical signals across different timeframes. The current price of $4,150.06 tells a story of caution, with the precious metal flirting with a significant support level at $4,132. Understanding the nuances of this price action is paramount for any trader aiming to navigate the volatile landscape of the gold market.
- XAUUSD is currently trading at $4,150.06, showing a downward trend on the 1-hour chart with RSI at 45.45.
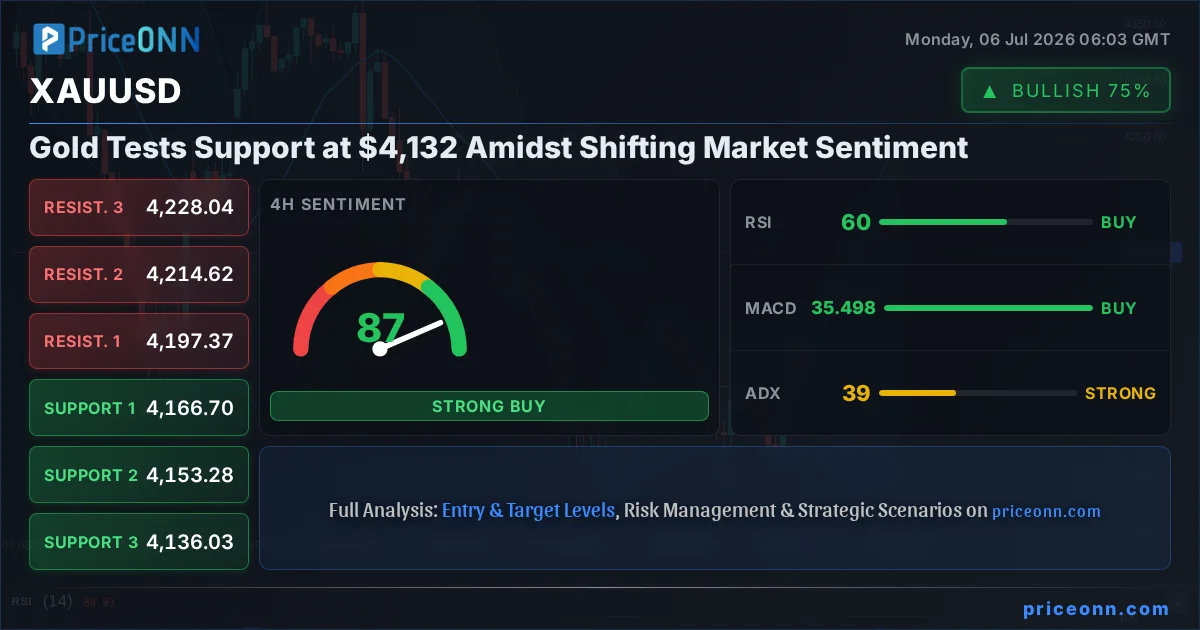
- The critical support level to watch is $4,132.11 on the daily chart, while resistance looms at $4,206.23.
- Divergent signals across timeframes – 1H shows bearish momentum, while 4H and 1D lean bullish technically, creating a mixed picture.
- The Dollar Index (DXY) at 101 is strengthening, typically exerting downward pressure on gold prices, adding another layer of complexity.
The Tug-of-War: Bulls vs Bears at $4,150
The precious metal has been caught in a delicate balance, with conflicting forces pulling it in opposite directions. On one hand, the daily chart paints a picture of resilience, showing a neutral trend with a strong bullish bias on the 4-hour timeframe. The RSI at 61.13 on the 4-hour chart suggests upward momentum is still present, and the MACD is positive, indicating that buyers have been in control over the medium term. This 4-hour strength, reflected in the overall signal of 'BUY' with 6 buys, 2 sells, and 0 neutrals, suggests that underlying demand might still be in play. However, this optimism is tempered by the immediate 1-hour picture, which paints a decidedly more bearish scenario. With an RSI of 45.45 and a 'SELL' signal dominated by 6 sells to 2 buys, the short-term sentiment is decidedly negative. This divergence is where the real trading opportunity lies – understanding which timeframe's signal will prevail.
Furthermore, the broader economic context adds another layer of complexity. The Dollar Index (DXY) is currently trading at 101, showing a clear upward trajectory on the 1-hour and 1-day charts. Historically, a stronger dollar often correlates with weaker gold prices, as the metal becomes more expensive for holders of other currencies. This macro headwind cannot be ignored. The market is essentially at a crossroads, with short-term bearish momentum clashing with medium-term bullish technicals, all while facing the headwind of a strengthening dollar. This is precisely the kind of environment where price action at key levels becomes the most crucial determinant of the next move.
Decoding the Technical Signals: A Multi-Timeframe Conundrum
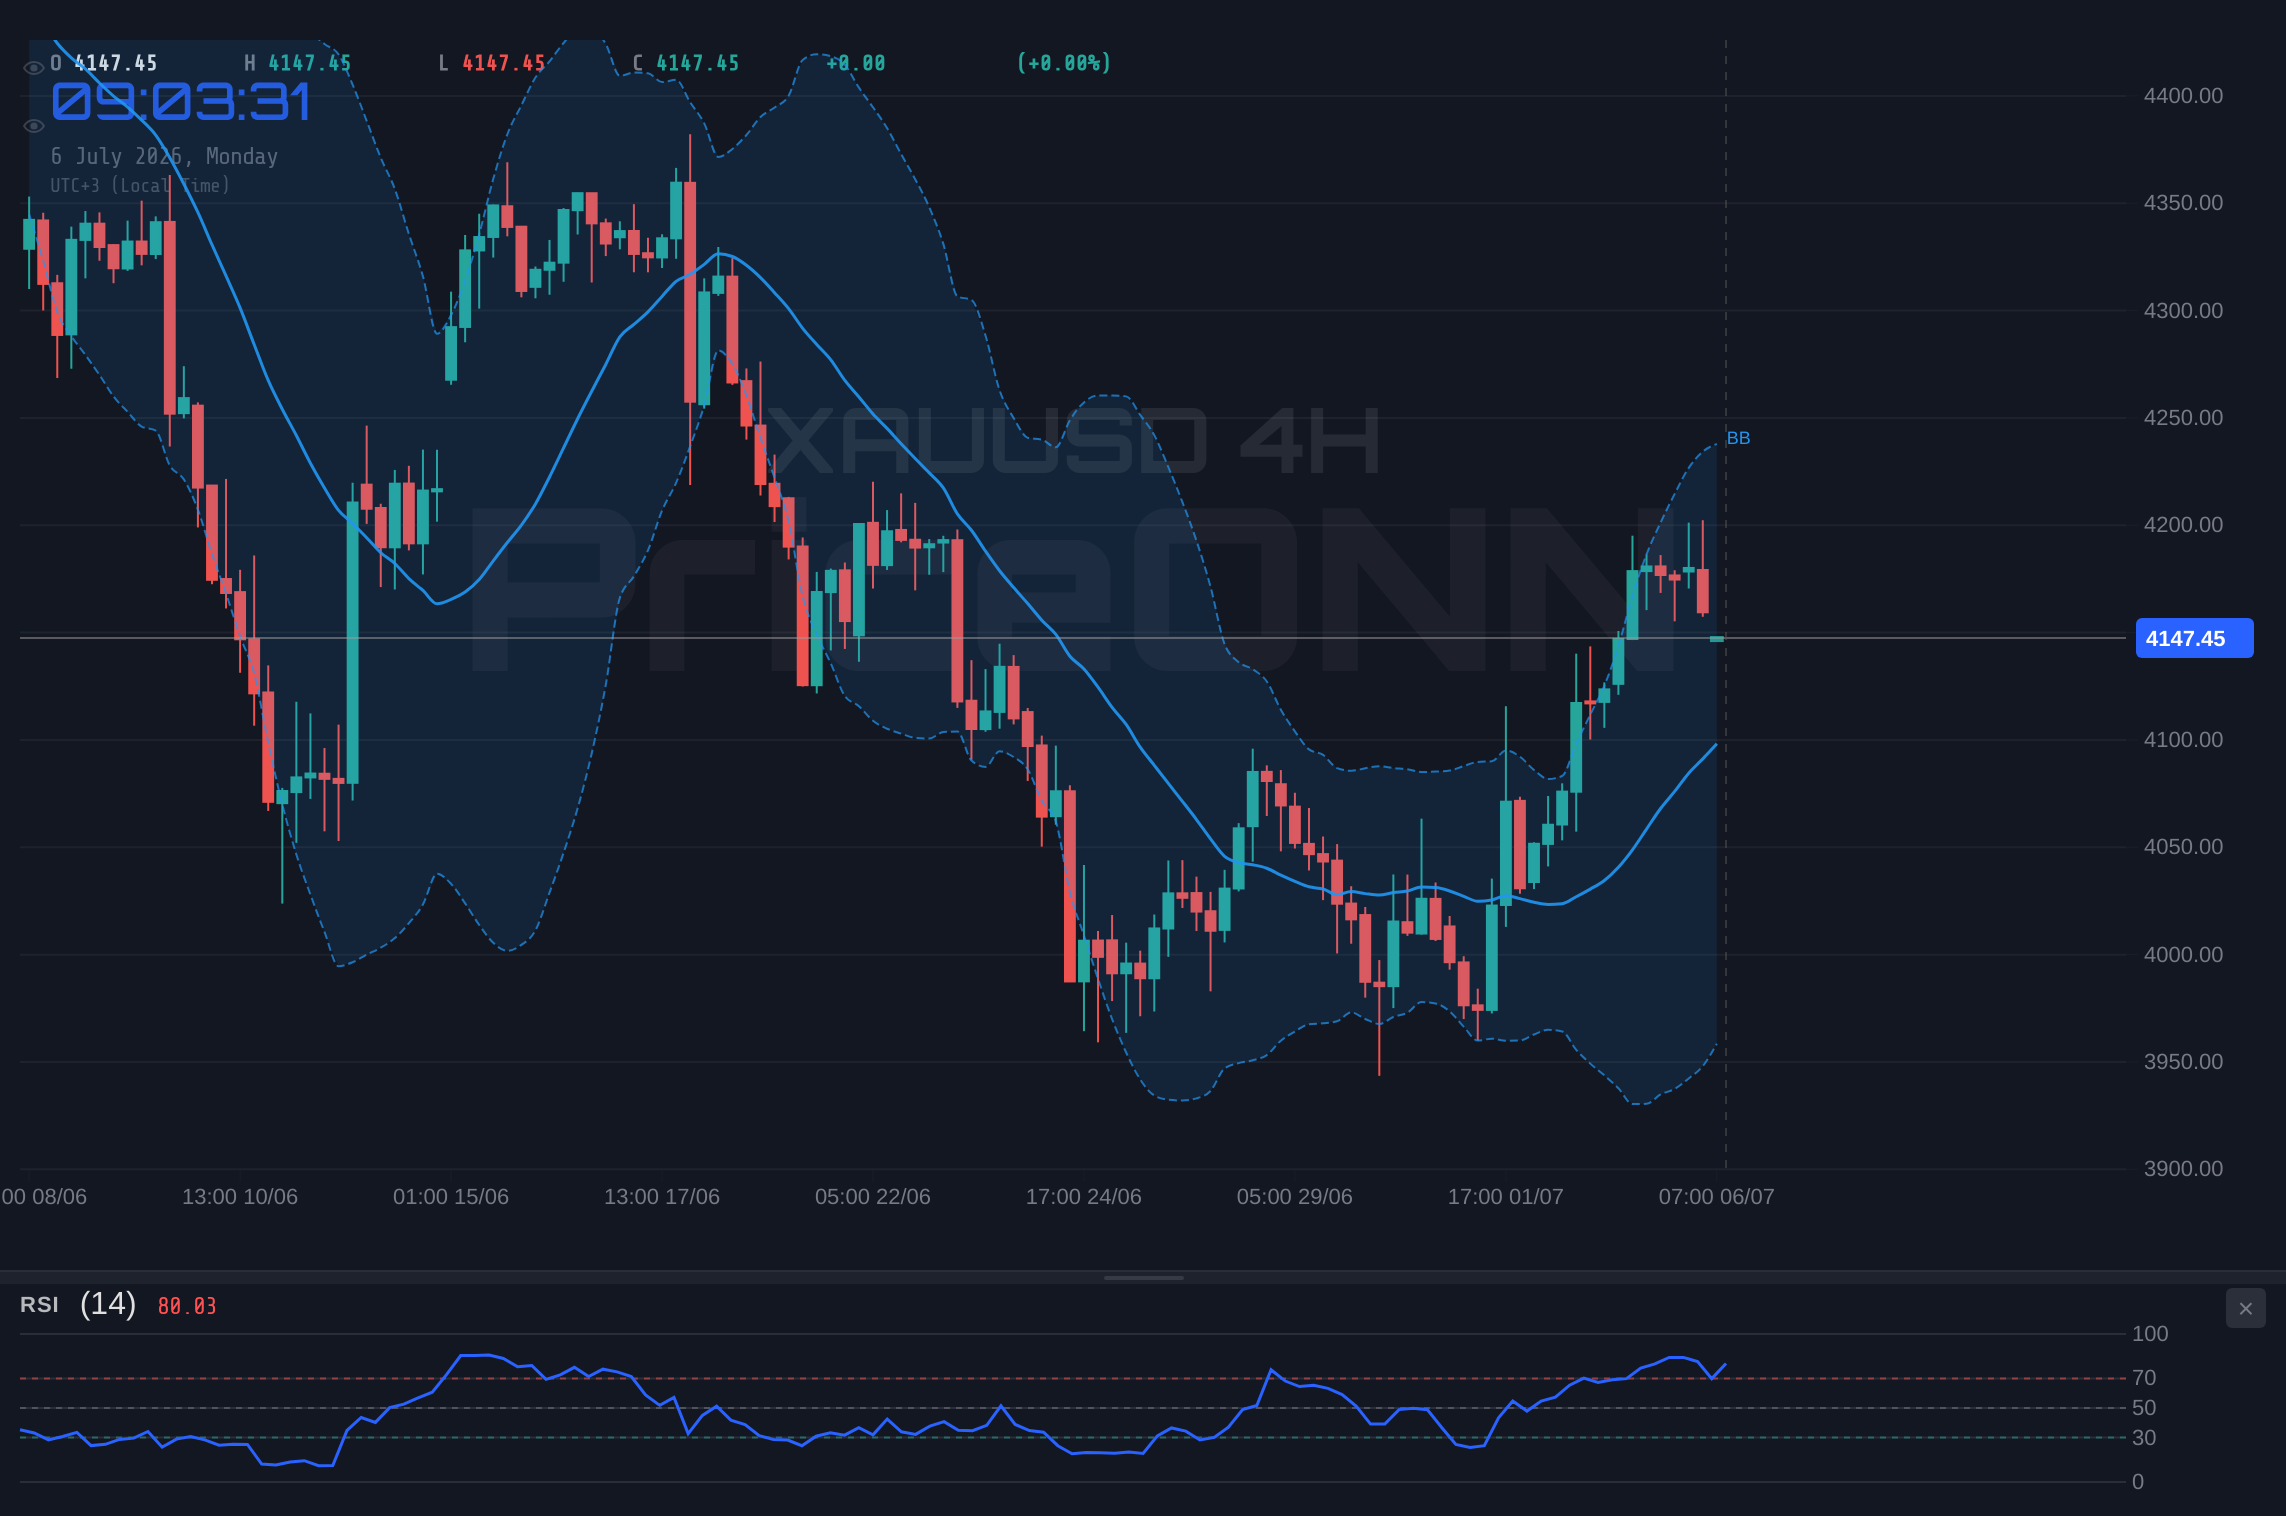
Delving deeper into the technical indicators reveals a market in flux. The 1-hour chart for XAUUSD is flashing clear sell signals. The RSI at 45.45 indicates a leaning towards bearish momentum, and the MACD being below its signal line reinforces this short-term pessimism. Bollinger Bands are also showing the price below the lower band, suggesting potential oversold conditions on this very short timeframe, or perhaps the beginning of a sharper downtrend. The Stochastic Oscillator, with K=11.63 and D=42.7, further confirms this bearish sentiment on the hourly chart, with the %K line well below the %D line.
However, shift your gaze to the 4-hour timeframe, and the narrative transforms. Here, the trend is predominantly bullish, with an overwhelming 6-2-0 signal in favor of buyers. The RSI at 61.13 is in bullish territory, and the MACD is positive, above its signal line. Bollinger Bands are trading above the middle band, indicating an upward bias. Even the Stochastic Oscillator, while showing %K (73.25) below %D (87.09), is in the upper half of its range, suggesting that while a pullback might be due, the overall trend remains strong. This 4-hour picture is the one that has supported gold's recent stability, hinting at potential buying interest emerging around current levels.
The daily chart, while showing a neutral overall trend strength of 50%, also presents a mixed bag. MACD is positive and above its signal line, suggesting underlying bullish momentum. Bollinger Bands are above the middle band, indicating an upward inclination. Yet, the RSI at 45.29 leans bearish, and the ADX at 39.03, while indicating a strong trend, is applied to a daily chart that is currently neutral, implying that the trend might be losing steam or consolidating. The Stochastic Oscillator on the daily is bullish (%K > %D), adding yet another layer of conflicting information. This multi-timeframe divergence is the key challenge: short-term weakness versus medium-to-long-term potential.
The $4,132 Level: A Line in the Sand?
The current price of $4,150.06 brings XAUUSD precariously close to a significant support zone. On the daily chart, the first support level is clearly defined at $4,132.11. This level is not just an arbitrary number; it represents a price point where buying interest has historically emerged, potentially halting further declines. If gold prices were to breach this level decisively, it would signal a stronger bearish sentiment and could open the door for a steeper correction towards the next support at $4,089.51, and potentially even $4,057.99.
Conversely, if $4,132.11 holds as a floor, it could provide the necessary springboard for a recovery. The bullish signals from the 4-hour chart, coupled with the potential for short-covering on the 1-hour chart as it approaches oversold territory, could combine to drive prices higher. The immediate resistance on the 1-hour chart is at $4,164.77, followed by $4,170.07. A break and hold above these levels would suggest that the short-term bearish sentiment is dissipating, and buyers are regaining control. The ultimate test on the daily chart lies at the resistance of $4,206.23. A sustained move above this level would confirm a bullish continuation and open up further upside potential, possibly targeting $4,237.75 and beyond.
Correlation Analysis: DXY and Equities
The influence of the Dollar Index (DXY) on gold cannot be overstated. As the DXY strengthens, it typically exerts downward pressure on gold prices. Currently, the DXY is showing a bullish trend across multiple timeframes, trading at 101. This strength, particularly evident on the 1-hour and 1-day charts, acts as a significant headwind for gold. If the dollar continues its ascent, it will make gold more expensive for international buyers, potentially dampening demand and contributing to price declines. The RSI on the DXY's 1-hour chart is at 62.27, indicating upward momentum, while the 1-day chart shows ADX at 38.01, confirming a strong trend. This persistent dollar strength suggests that any bullish moves in gold might face significant resistance unless there's a clear catalyst to weaken the dollar.
Equities, represented by the S&P 500 (SP500) and Nasdaq 100 (Nasdaq), also play a crucial role in the risk appetite narrative. The SP500 is currently showing a mixed picture: a strong bullish trend on the 1-hour and 4-hour charts, but a bearish trend on the daily chart. The Nasdaq 100, on the other hand, is showing bearish trends across its 1-hour and 4-hour timeframes, despite a bullish daily trend. This divergence in equity markets suggests that investor sentiment is not uniformly bullish. Generally, a decline in risk appetite (as suggested by the bearish Nasdaq signals) can lead investors to seek safe-haven assets like gold. However, the simultaneous strength in the DXY complicates this. If the dollar is strengthening *and* equities are declining, it might signal a broader risk-off environment where even safe havens could face selling pressure, or it could indicate a flight to the dollar as the ultimate safe haven, indirectly pressuring gold.
Geopolitical Landscape and Inflationary Pressures
While the immediate price action is driven by technicals and dollar strength, the underlying fundamental factors remain critical. Geopolitical tensions, though not explicitly detailed in the provided data, often act as a background driver for gold prices. Any escalation in global conflicts or significant political instability can increase safe-haven demand for gold. Currently, there are no specific geopolitical events highlighted in the provided news snippets that directly impact XAUUSD, but the general awareness of ongoing global uncertainties provides a baseline support for gold as a safe asset. The mention of oil prices potentially rising due to AI data centers' energy demands also hints at potential inflationary pressures down the line, which historically benefits gold.
The energy markets, with Brent crude at $72.14 and WTI at $69.23, are showing mixed signals. Brent is in a downtrend on the daily chart with oversold RSI, while WTI is also in a downtrend with oversold RSI, though both show some short-term bullish momentum. Higher energy prices can contribute to inflationary concerns, which typically supports gold prices as an inflation hedge. However, the current price action in oil doesn't present a clear inflationary surge narrative that would strongly propel gold higher on its own. The focus remains on the interplay between dollar strength, equity market direction, and the immediate technical levels for gold itself. The lack of overt inflationary spikes from energy prices means that gold's movement is more likely to be dictated by monetary policy expectations and safe-haven flows for now.
Navigating the Conflicting Signals: What Traders Should Watch
The current market environment for XAUUSD is a trader's dilemma: conflicting signals across timeframes and macro headwinds from a strong dollar. The 1-hour chart suggests a potential for further downside, with key support at $4,132.11 being the immediate focus. A break below this level would invalidate any short-term bullish thesis and could trigger a more significant sell-off. On the other hand, the 4-hour chart indicates underlying strength, suggesting that buyers might step in around current levels or the $4,132 support. The daily chart remains neutral but leans towards bullish potential if the $4,132 support holds firm.
For scalpers and short-term traders, the bearish signals on the 1-hour chart might present opportunities to fade rallies or play for a break of the $4,132 support. Confirmation would be key, perhaps waiting for a decisive close below $4,132.11 on the 1-hour or 4-hour chart. For swing traders and longer-term investors, the focus should be on the 4-hour and daily charts. The $4,132.11 level is a critical juncture. A hold here, followed by a break above the 1-hour resistance levels like $4,164.77, could signal a resumption of the bullish trend, with targets around $4,206.23. Patience and disciplined risk management are essential. Waiting for confirmation of either a support hold and bounce or a breakdown below $4,132.11 will be crucial for strategic positioning.
Looking Ahead: Economic Calendar and Potential Catalysts
The economic calendar will be crucial in determining the next direction for gold. While specific upcoming events are not detailed in the provided data, general market expectations around central bank policies, particularly the US Federal Reserve, will heavily influence the dollar and, by extension, gold. If upcoming economic data, such as inflation reports or employment figures, suggest a stronger economy or persistent inflation, it could lead to expectations of higher-for-longer interest rates, strengthening the dollar and pressuring gold. Conversely, weaker economic data could lead to expectations of rate cuts, weakening the dollar and supporting gold.
The recent forex news mentions the ECB's Moulin stating the bank is in a "good position" after its June rate hike, suggesting a potential pause or data-dependent approach from the ECB. This might offer some support to EUR/USD, which is currently trading at 1.14261 and facing a tough climb. However, the primary focus for gold's direction will likely remain on the US economic outlook and Fed policy. Traders will be closely watching any hints from Fed officials regarding future policy moves. The divergence in equity markets, with Nasdaq showing bearish short-term trends, also adds an element of uncertainty that could spill over into gold if risk aversion increases significantly.
Trading Scenarios for XAUUSD
Bearish Scenario: Support Breakdown
60% ProbabilityBullish Scenario: Support Holds and Recovers
30% ProbabilityConsolidation: Range-Bound Action
10% ProbabilityFrequently Asked Questions: XAUUSD Analysis
What happens if XAUUSD breaks below the $4,132.11 support level?
A decisive break below $4,132.11 on the daily chart would likely trigger further selling pressure, potentially pushing XAUUSD towards the next support at $4,089.51. This would invalidate the bullish outlook from the 4-hour timeframe and signal increased bearish momentum.
Should I buy XAUUSD at current levels around $4,150 given the mixed signals?
Buying at current levels carries risk due to the bearish 1-hour signals and DXY strength. A more prudent approach might be to wait for confirmation: either a hold and bounce from $4,132.11 with bullish divergence, or a clear break above $4,164.77. Patience is key in this environment.
Is the RSI at 45.45 on the 1-hour chart a sell signal for XAUUSD?
An RSI of 45.45 on the 1-hour chart indicates bearish momentum, leaning towards a sell signal in the short term. However, it's not yet in oversold territory, and its validity depends on the prevailing trend on higher timeframes, where signals are more mixed.
How will the strengthening DXY at 101 affect XAUUSD this week?
The strengthening DXY, currently at 101 and showing upward momentum, typically exerts downward pressure on gold prices. This macro factor suggests that any bullish attempts in XAUUSD might face significant headwinds unless countered by strong safe-haven demand or dovish shifts in Fed policy expectations.
Track markets in real-time
AI-powered analysis, technical indicators and real-time price data.
Join Our Telegram Channel
Breaking market news, AI analysis and trading signals instantly.
Join Channel