

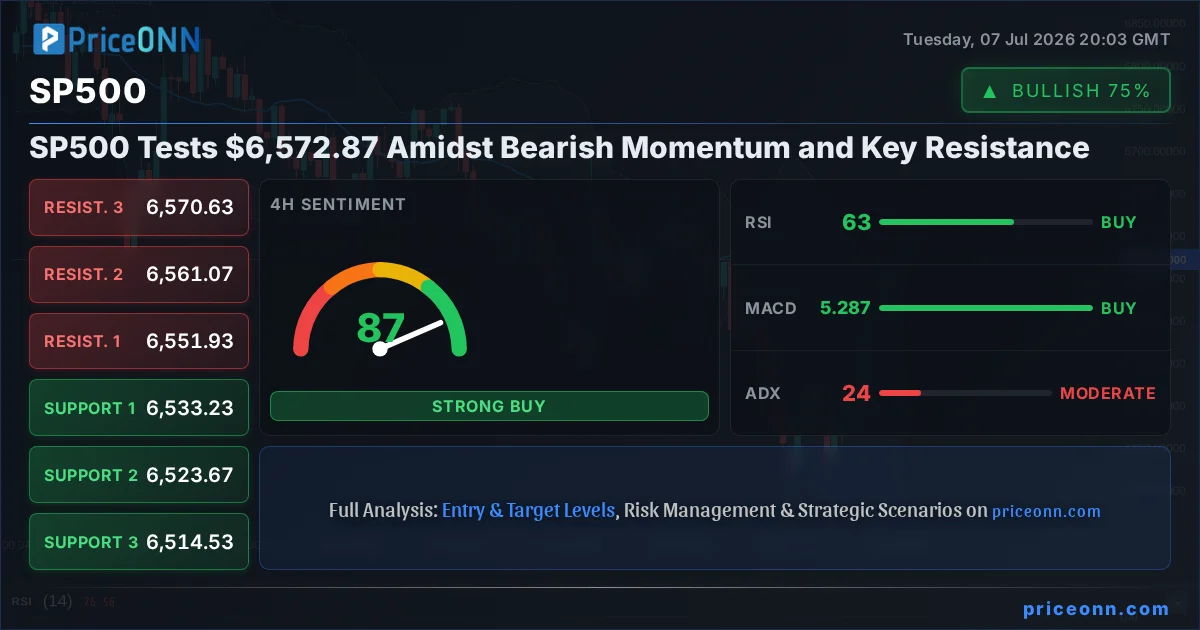
The S&P 500 is currently navigating a critical juncture, trading at $6,572.87. This price point finds the index hovering near significant resistance levels, while a confluence of technical indicators suggests a prevailing bearish sentiment. The question on traders' minds is whether the current weakness signals a deeper correction or a temporary pause before the next upward move. Understanding the interplay between the index's internal dynamics and broader market correlations is paramount for deciphering its immediate future.
- The S&P 500 is trading at $6,572.87, facing resistance at $6,570.63 on the 4H chart.
- Bearish signals are dominant across multiple timeframes, with RSI readings below 50 on 1H and 1D charts.
- The ADX indicates strong downward trends on the 1D (47.51) and Nasdaq 100 (37.96) charts, suggesting persistent selling pressure.
- Key support for the SP500 is identified at $6,533.23 (4H) and $6,377.47 (1D), while resistance at $6,570.63 (4H) and $6,605.07 (1D) remains a significant hurdle.
The Technical Tapestry: Weaving a Bearish Narrative
Divergent Signals Across Timeframes
On the 1-hour chart, the S&P 500 shows a strong upward trend (Power: 100%), yet the underlying momentum appears to be flagging. The Relative Strength Index (RSI) at 70.95 is firmly in overbought territory, flashing a warning sign that bulls might be losing their grip. This is further corroborated by the Stochastic oscillator, where the %K line (65.73) has crossed below the %D line (73.5), signaling a potential downturn. While the Moving Average Convergence Divergence (MACD) histogram is still positive, its position below the signal line hints at waning bullish momentum. The Average Directional Index (ADX) at 49.72, however, paints a picture of a strong existing uptrend, suggesting that any pullback might be a correction within a larger trend rather than a reversal.
However, delving into the 4-hour timeframe reveals a more nuanced picture. The trend is categorized as neutral (Power: 50%), indicating a potential shift in market sentiment. Here, the RSI at 62.83 is still in the upper half of the neutral zone, suggesting room for further upside, but it's moving away from the extreme overbought conditions seen on the 1-hour chart. The Stochastic shows an extreme overbought reading with %K at 97.85 and %D at 86.96, strongly indicating a potential reversal or at least a period of consolidation. The MACD is positive and above its signal line, supporting the bullish inclination on this timeframe, while the ADX at 24.23 points to a moderately strong uptrend. This divergence between the 1H and 4H charts highlights the immediate uncertainty.
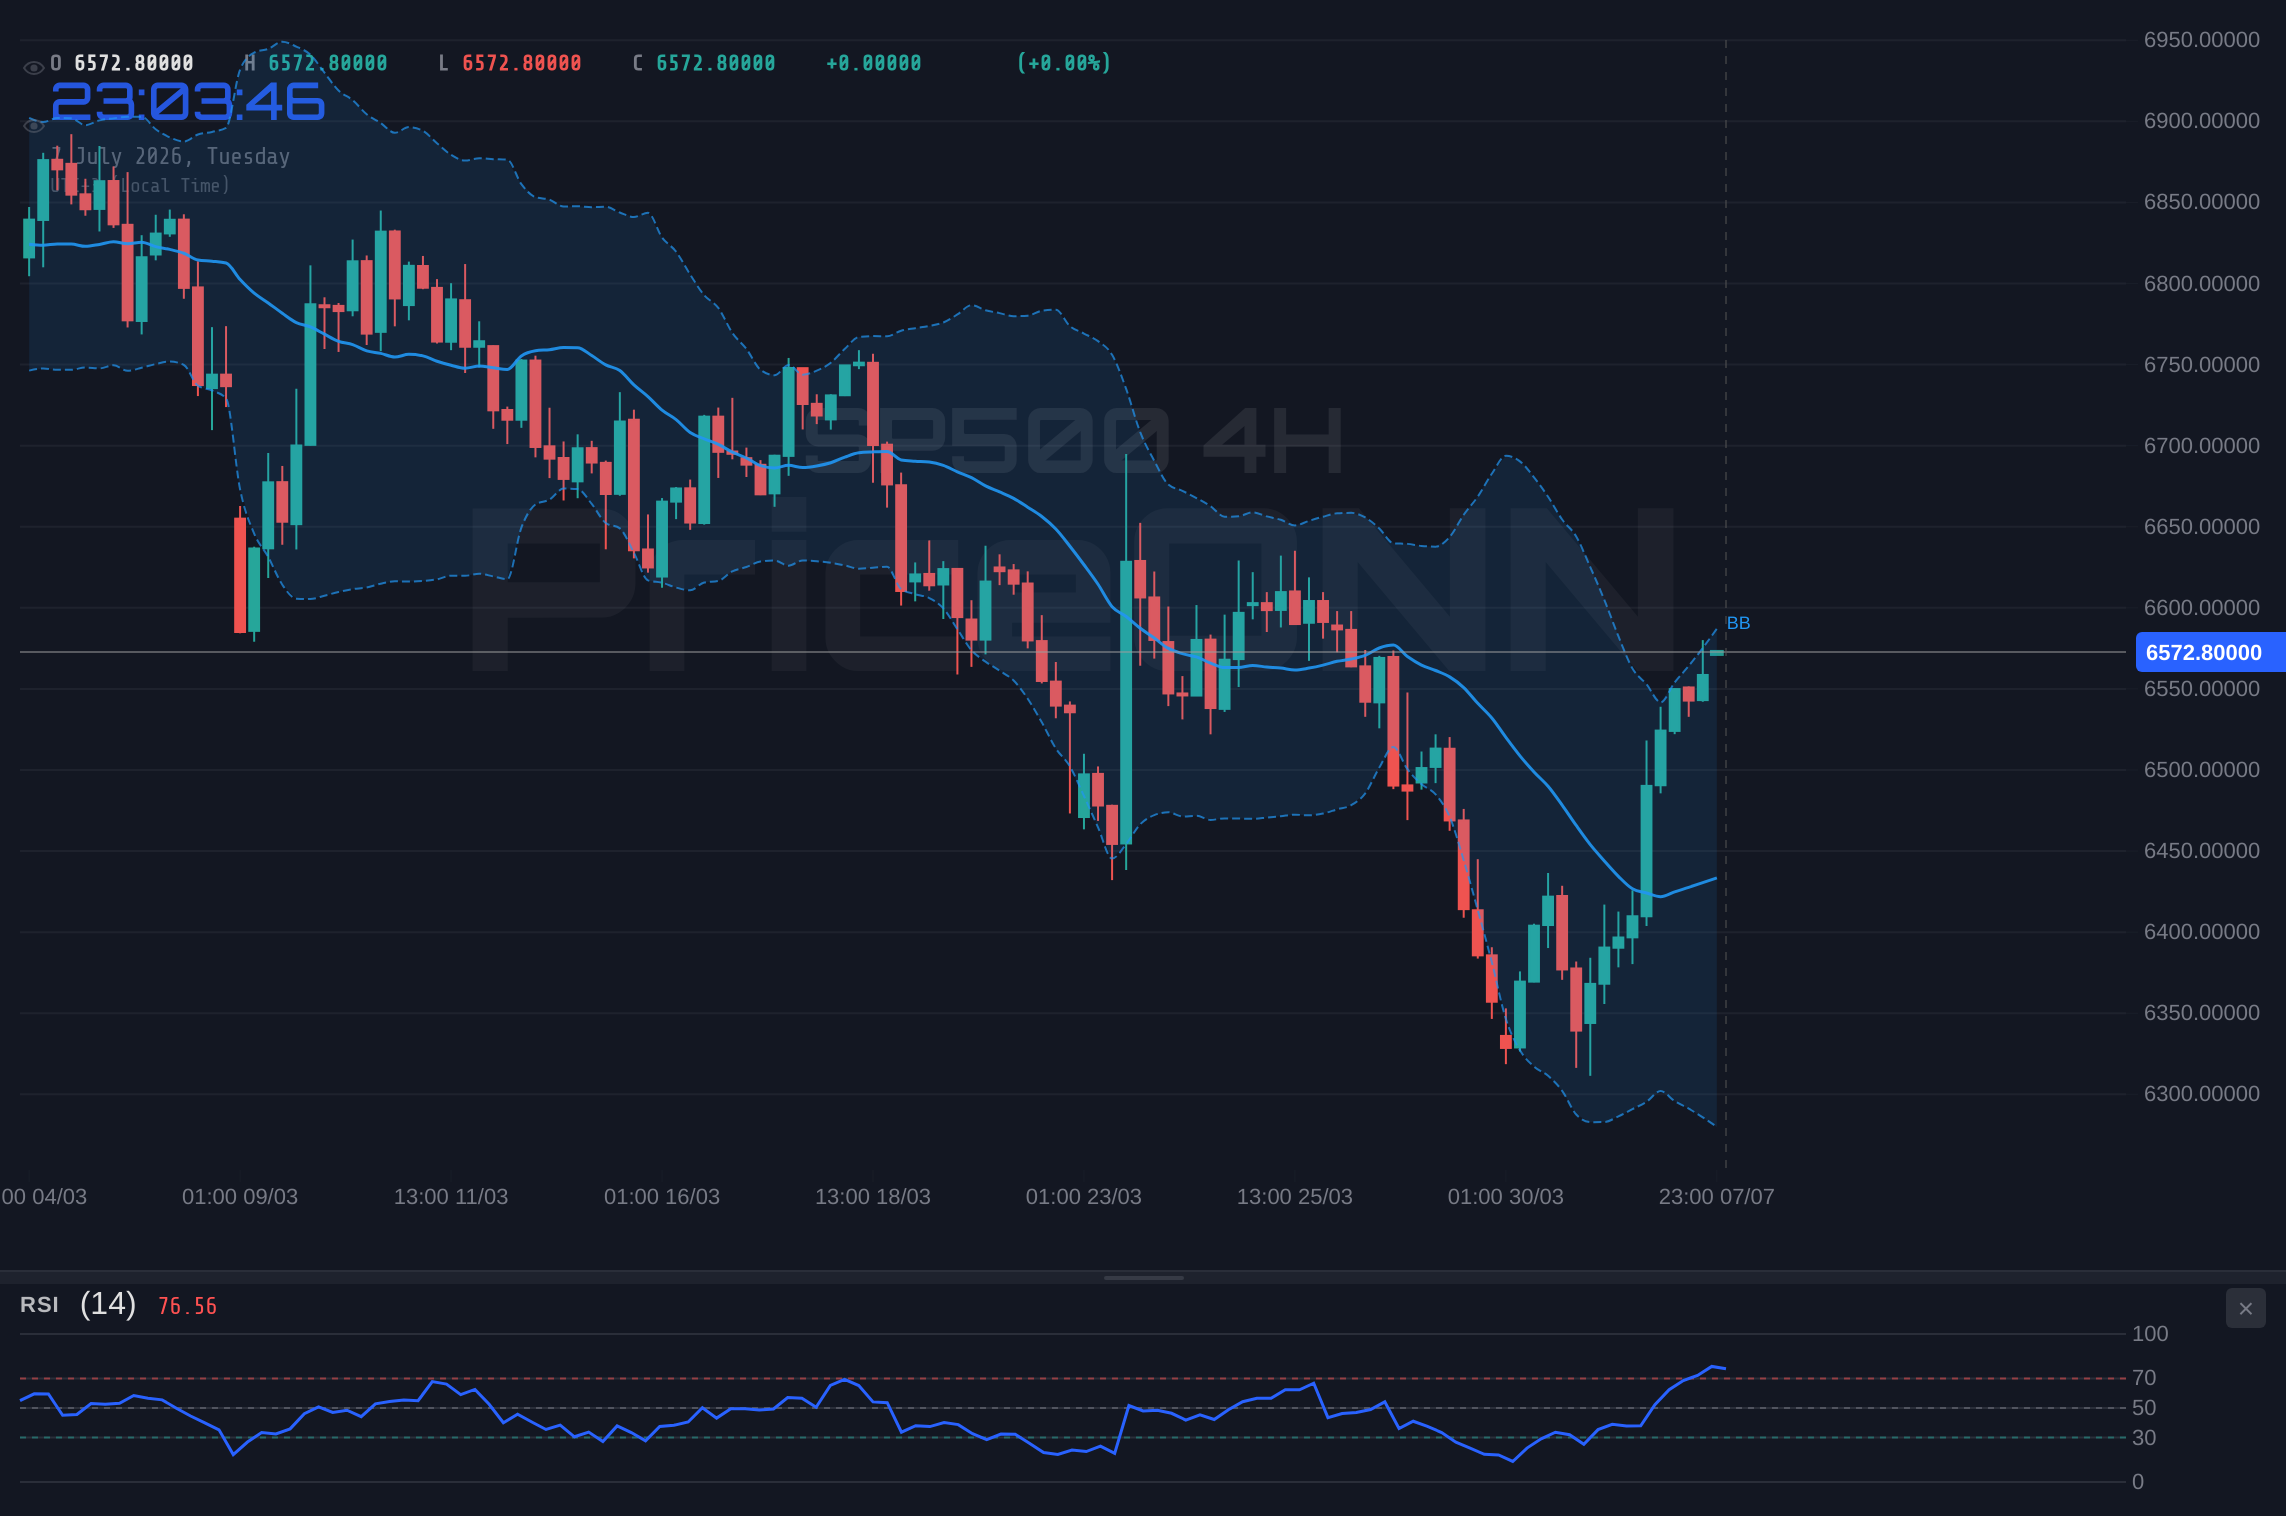
The daily chart presents a starkly different outlook, leaning heavily bearish. The trend is definitively down (Power: 100%), with the RSI at 45.35 firmly in the neutral zone but trending lower, suggesting sellers are gaining an upper hand. The MACD histogram is negative and below its signal line, a classic bearish signal indicating downward momentum. The Bollinger Bands are positioned below the middle band, reinforcing the bearish sentiment. Stochastic is showing a bullish signal with %K (42.97) above %D (29.88), but this is occurring in oversold territory and might be a sign of a weaker correction rather than a strong reversal. The ADX at 47.51 signifies a very strong downtrend, underscoring the prevailing bearish pressure on the daily scale. This multi-timeframe analysis reveals a market at a crossroads, with short-term strength battling longer-term bearish pressures.
Correlation Analysis: The Dollar's Grip and Equity Sentiment
The Dollar Index (DXY) is currently trading at 101.06, showing a modest increase. Historically, a strengthening dollar often correlates with pressure on major equity indices like the S&P 500, as it makes US assets more expensive for foreign investors and can signal tighter global liquidity. The DXY's upward movement on the 1-hour chart, with RSI at 64.6 and Stochastic in overbought territory, suggests continued dollar strength might be on the horizon. This external factor adds another layer of caution for S&P 500 bulls. If the dollar continues to strengthen, it could exacerbate the selling pressure on equities, particularly if accompanied by rising Treasury yields.
The performance of other major indices also provides context. The Nasdaq 100, currently at 29,165.33, is experiencing a significant downturn (-1.82%), with its 1-hour and 4-hour charts showing strong bearish signals. The ADX for Nasdaq is high on the 1-hour chart (37.96), indicating a strong downtrend. Similarly, the Dow Jones Industrial Average, trading at 52,889.50, is also showing a bearish bias on its 1-hour chart, despite a bullish 1D trend. This broad weakness across major US indices suggests a systemic risk-off sentiment is taking hold, which typically weighs on the S&P 500. The correlation between these indices is usually high, and the current synchronized decline amplifies the bearish case for the S&P 500.
Key Levels: The Battleground for Direction
The S&P 500's immediate price action hinges on key support and resistance levels. On the 4-hour chart, the critical resistance is situated at $6,570.63, with further hurdles at $6,561.07 and $6,551.93. A break above these levels would be necessary to challenge the bearish narrative. Conversely, support is found at $6,533.23, followed by $6,523.67 and $6,514.53. A decisive close below the $6,533.23 support level on the 4-hour chart would likely trigger further selling pressure, potentially retesting the daily support levels.
Looking at the daily chart, the resistance zone is more pronounced, starting at $6,605.07, then $6,685.83, and extending to $6,832.67. These levels represent significant psychological and technical barriers that have historically capped upward moves. On the downside, the daily support levels are located at $6,377.47, $6,230.63, and $6,149.87. A break below the $6,377.47 level would signal a more significant bearish trend continuation, potentially opening the door for a deeper correction towards the lower support zones. The current price of $6,572.87 sits precariously between these short-term and long-term battlegrounds, making the next directional move crucial.
The Bull's Roadmap: Conditions for a Rebound
For the bulls to regain control, several conditions must be met, primarily involving a decisive break above immediate resistance levels and a shift in underlying momentum. The first hurdle is the 4-hour resistance at $6,570.63. A sustained move above this level, ideally with increasing volume and positive RSI divergence, would be the initial sign of strength. Following this, the bulls must conquer the $6,577.27 and $6,589.83 resistance levels on the 1-hour chart. If these are cleared, the next significant target becomes the daily resistance at $6,605.07. A break and hold above this daily resistance would invalidate the immediate bearish outlook and potentially signal the start of a new upward leg.
Confirmation of a bullish reversal would also require a positive shift in technical indicators across multiple timeframes. On the 1-hour chart, the RSI needs to move decisively out of the overbought zone without immediately turning down, and the MACD histogram should maintain its positive momentum above the signal line. Crucially, the daily chart's bearish signals must abate. This means the daily RSI needs to climb back above 50, the MACD histogram should turn positive and cross above its signal line, and the ADX needs to show a weakening downtrend (below 25). A sustained move above the 4-hour middle Bollinger Band would also provide further confirmation. The probability of this scenario playing out hinges on a significant catalyst, perhaps a surprisingly dovish tone from the Fed or a positive shift in geopolitical sentiment, that can overcome the current risk-off appetite.
Where Bears Take Control: The Downside Scenario
The bearish scenario appears more probable given the current technical setup and broader market sentiment. The immediate trigger for a downside move would be a failure to hold the current price levels, specifically a break below the 1-hour support at $6,547.63. If this level gives way, the next target would be the 4-hour support at $6,533.23. A decisive close below $6,533.23 on the 4-hour chart would confirm the bearish bias and likely accelerate the decline towards the daily support levels.
The primary daily support lies at $6,377.47. A break below this significant level would confirm a bearish trend continuation, potentially leading to a test of the lower daily supports at $6,230.63 and $6,149.87. This scenario is supported by the strong bearish ADX readings on the daily charts for both SP500 (47.51) and Nasdaq (37.96), indicating robust downtrend momentum. Furthermore, the negative MACD on the daily charts and RSI readings below 50 reinforce the view that sellers are in control. The strengthening DXY at 101.06 also adds weight to the bearish argument, as a stronger dollar often accompanies equity market weakness. This downside scenario gains further traction if upcoming economic data proves weaker than expected or if geopolitical tensions escalate, prompting a flight to safety.
The Waiting Game: Consolidation and Uncertainty
A neutral scenario, characterized by range-bound trading and indecision, is also a possibility, especially if key economic data releases fail to provide a clear direction or if conflicting signals persist across different timeframes. In this scenario, the S&P 500 might oscillate between the immediate 4-hour resistance at $6,570.63 and support at $6,533.23. Price action could become choppy, with false breakouts and breakdowns as market participants digest mixed signals.
This consolidation phase could persist until a significant catalyst emerges. Factors such as upcoming central bank communications (like the Fed minutes mentioned in recent news), crucial economic data releases (such as inflation or employment figures), or geopolitical developments could eventually force a breakout. During this period, traders might adopt a more cautious approach, focusing on short-term opportunities within the range or waiting for a clearer directional signal. The ADX readings across multiple timeframes, particularly the weaker ones on the 1-hour and 4-hour charts (16.69 and 24.23 respectively), can sometimes indicate a lack of strong trend, lending credence to the possibility of a sideways market in the short term, though the daily ADX remains strong.
The Most Probable Path Forward
Considering the confluence of bearish technical signals on the daily chart, the strong downtrend momentum indicated by ADX, the negative MACD, and the prevailing risk-off sentiment suggested by correlated index movements and a strengthening dollar, the bearish scenario appears to hold the highest probability. The immediate resistance at $6,570.63 is likely to cap further upside, especially given the overbought RSI on the 1-hour chart. A break below the $6,533.23 support level on the 4-hour chart would likely confirm this bias, paving the way for a retest of the daily support at $6,377.47.
The probability assigned to the bearish scenario is estimated at 65%. This reflects the weight of evidence from the daily chart's technicals and the broader market correlations. The neutral scenario, where the index consolidates between $6,533.23 and $6,570.63, is assigned a 25% probability. This accounts for the possibility of indecisive data releases or short-term technical bounces. The bullish scenario, requiring a decisive break above $6,605.07 with confirmation from indicators turning positive across all timeframes, is given the lowest probability of 10%, as it would require a significant shift in market fundamentals or sentiment.
Bearish Scenario: The Downside Path
65% ProbabilityNeutral Scenario: The Waiting Game
25% ProbabilityBullish Scenario: A Surprising Rally
10% ProbabilityWhat I'm Watching This Week
The immediate focus will be on the S&P 500's reaction to the current price level around $6,572.87. Key triggers to monitor include:
- The 4-hour close relative to $6,570.63: A close below this level would confirm the bearish bias and likely lead to a test of $6,533.23.
- Daily RSI movement: A continued slide below 45 would reinforce the bearish outlook, while a bounce back above 50 would signal potential stabilization.
- DXY action: Sustained strength in the dollar index above 101.06 could add pressure on equities, while a pullback in DXY might offer some respite to the S&P 500.
Traders should remain vigilant for any shifts in market sentiment, especially around these critical levels. The interplay between technical signals and macroeconomic news will be crucial in determining the next significant move.
Frequently Asked Questions: SP500 Analysis
What happens if SP500 breaks below the $6,533.23 support level?
A break below the $6,533.23 support on the 4-hour chart would validate the bearish scenario, likely triggering further selling pressure. The next key target would be the daily support level at $6,377.47, with the potential to extend towards $6,230.63 if the downtrend gains significant momentum.
Should I consider buying SP500 at current levels of $6,572.87 given the mixed signals?
Buying at $6,572.87 is currently a high-risk proposition given the resistance at $6,570.63 and the prevailing bearish signals on longer timeframes. A more prudent approach would be to wait for confirmation, such as a decisive break above $6,605.07, or a clear bounce from a lower support level like $6,377.47, with improved technical indicators.
Is the RSI at 70.95 a sell signal for SP500 right now?
An RSI of 70.95 on the 1-hour chart indicates overbought conditions, suggesting potential selling pressure or a pause in the uptrend. However, it's not a definitive sell signal on its own, especially with the strong ADX suggesting an existing trend. Confirmation from other indicators and price action breaking below immediate support would be needed for a stronger sell signal.
How might the DXY's rise to 101.06 affect SP500 this week?
The strengthening DXY at 101.06 typically exerts downward pressure on the S&P 500, as it often correlates with risk-off sentiment and tighter global liquidity. If the dollar continues its ascent, it could exacerbate the current bearish trend in the S&P 500, making it harder for the index to overcome resistance levels.
| Indicator | Value | Signal | Interpretation |
|---|---|---|---|
| RSI (14) | 70.95 | Neutral | Overbought on 1H, Neutral on 4H/1D |
| MACD Histogram | -0.15 | Bearish | Negative momentum on 1H/4H, Positive on 1D |
| Stochastic | K=65.73, D=73.5 | Bearish | Bearish cross on 1H, Overbought on 4H/1D |
| ADX | 47.51 | Bullish | Strong downtrend on 1D, Strong uptrend on 1H/4H |
| Bollinger Bands | Middle Band | Watch | Below middle band on 1H/1D, Above on 4H |
Track markets in real-time
AI-powered analysis, technical indicators and real-time price data.
Join Our Telegram Channel
Breaking market news, AI analysis and trading signals instantly.
Join Channel