

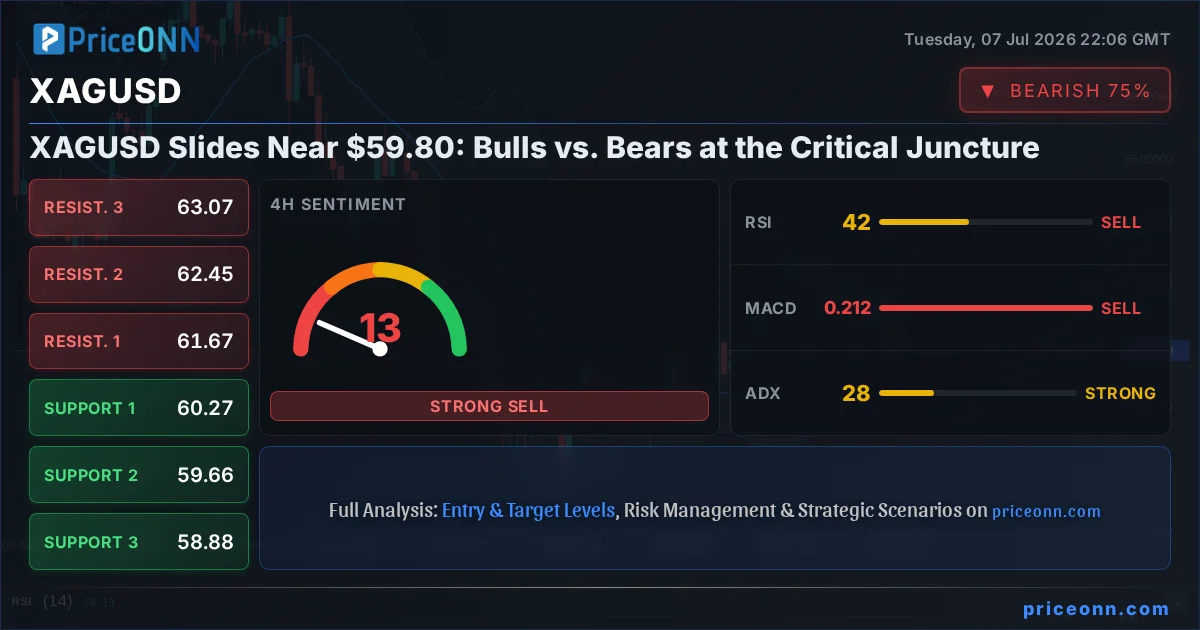
Silver is staring down the barrel of $59.80, a price point that's becoming a battleground for bulls and bears alike. The metal has seen a sharp decline, shedding 3.56% of its value in what appears to be a significant bearish push. This isn't just a random dip; it's a story unfolding at critical technical levels, influenced by a complex interplay of macroeconomic forces and market sentiment. Today, we're diving deep into the tug-of-war shaping the immediate future of silver, examining the arguments for both a sustained downturn and a potential rebound. XAGUSD today analysis reveals a market at a crossroads, where every tick of the price action carries significant weight.
- Silver (XAGUSD) is currently trading at $59.80, showing a sharp 3.56% daily decline.
- Critical support is being tested near $59.60, with further levels at $59.00 and $58.58 on the 1-hour chart.
- The RSI(14) at 32.59 on the 1-hour chart indicates oversold conditions, but the overall trend remains bearish.
- The Dollar Index (DXY) is showing strength around 101.08, exerting downward pressure on precious metals like silver.
The Bears' Grip Tightens: Why Silver is Feeling the Heat
The immediate narrative for silver is undeniably bearish, and the data paints a clear picture of sellers taking control. On the 1-hour timeframe, the trend is overwhelmingly downwards with an 88% strength, and the general signal is a definitive 'SELL'. This isn't just about a single indicator; it's a confluence of technical signals suggesting further downside potential. The RSI(14) at 32.59, while nearing oversold territory, is still firmly embedded in a downward trend. MACD is printing negative momentum, with the MACD line below its signal line, confirming the bearish bias. Bollinger Bands are showing the price trading below the lower band, a classic sign of strong selling pressure or potential exhaustion. Stochastic oscillators are also aligned, with the %K line at 17.09 and the %D line at 25.75, reinforcing the bearish signal as %K is below %D. The ADX, a measure of trend strength, sits at 26.01, indicating a solid downward trend is in place. These aren't isolated events; they are synchronized signals screaming caution for any potential buyers.
Looking at the 4-hour chart, the picture becomes slightly more nuanced but still leans bearish. While the trend is classified as 'Neutral' (50% strength), the overall signal remains 'SELL'. The RSI(14) at 41.82, though higher than the 1-hour, continues to trend downwards, suggesting that any rallies are likely to be met with selling pressure. MACD continues to show negative momentum, and Bollinger Bands remain below the lower band, indicating the strong downward move is still in play. However, the Stochastic oscillator here shows a slight divergence, with %K at 30.07 and %D at 22.1, suggesting a potential for a short-term bounce as %K crosses above %D. Yet, the ADX at 27.71 still points to a significant trend, albeit one that has seen some consolidation. The daily chart, while also 'Neutral' (50% strength), presents a similar story. The RSI(14) is at 37.77, trending down, and MACD shows negative momentum. The Bollinger Bands are below the middle band, and the Stochastic shows a bullish crossover (%K at 69.75, %D at 43.41), but this is occurring within a broader bearish context, especially with the ADX at a robust 38.37 indicating a strong existing trend, which in this case, is still predominantly downwards despite the daily chart's mixed signals.
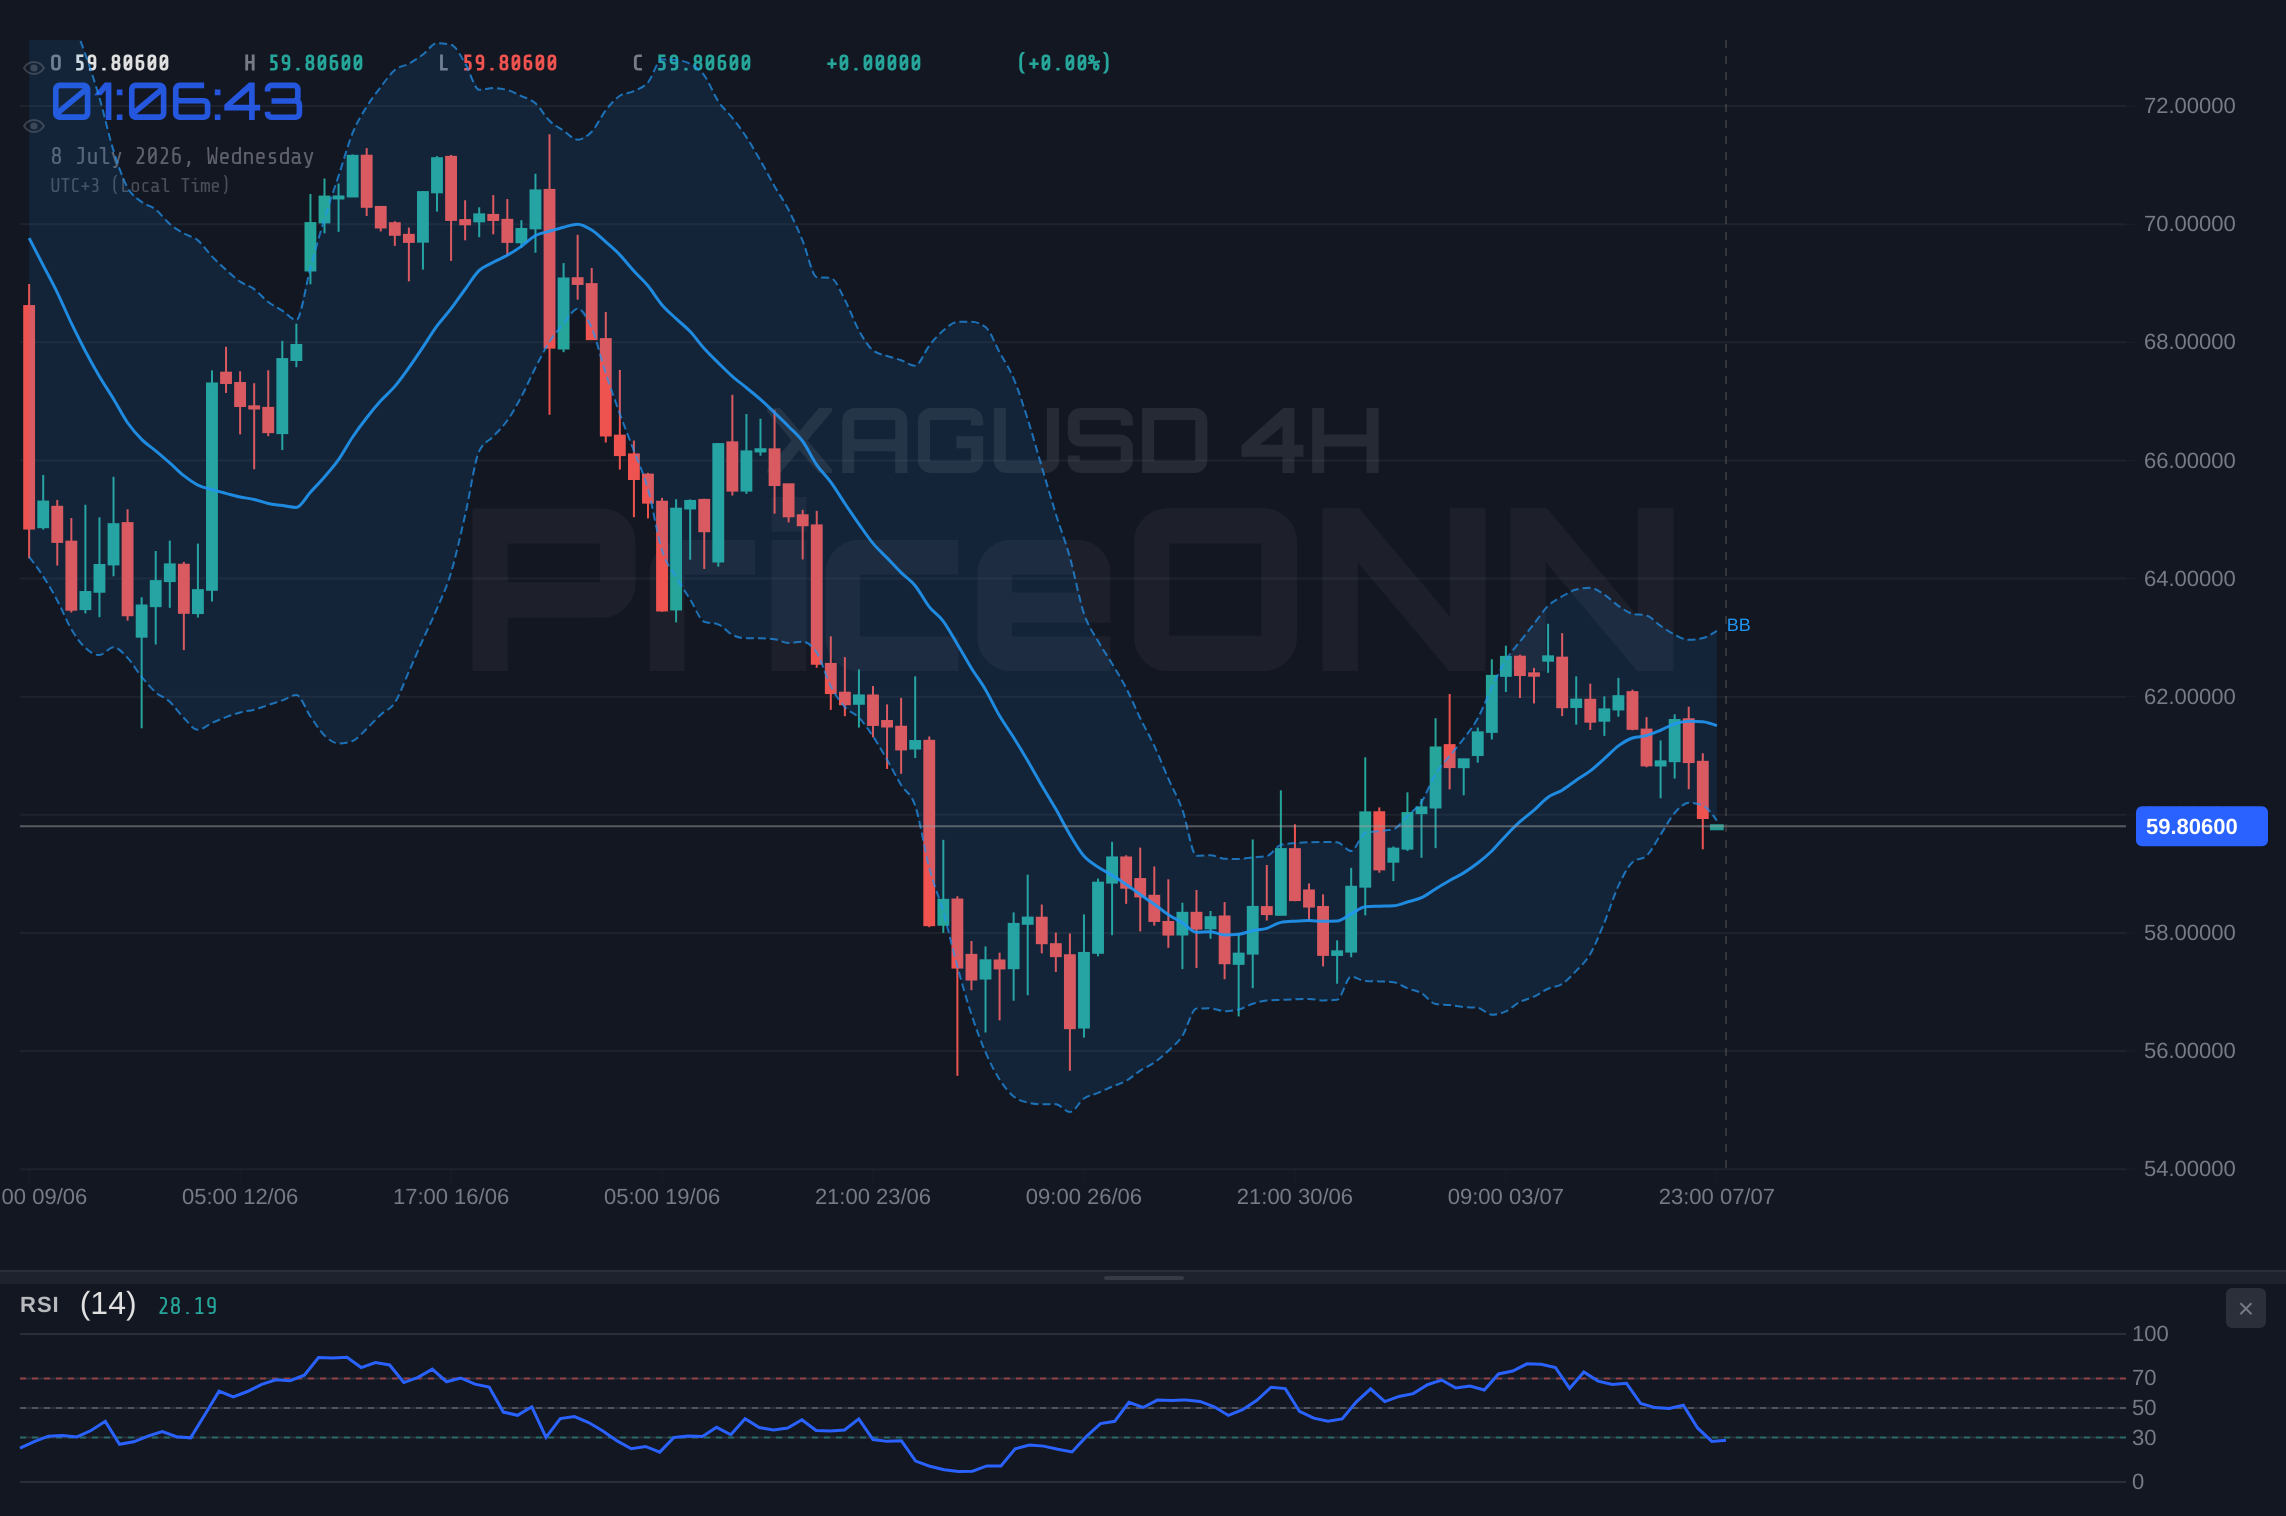
The correlation with the broader market environment further supports the bearish case for silver. The Dollar Index (DXY) is showing strength, currently trading at 101.08 and having gained 0.24% on the day. A stronger dollar typically exerts downward pressure on precious metals like silver, as they become more expensive for holders of other currencies. Furthermore, risk appetite in the broader markets, as indicated by the S&P 500's current price of 6572.87 (up 0.74%), doesn't necessarily translate into a flight to safety that would benefit silver in the short term. While the S&P 500 is showing some upward movement, its daily chart trend is classified as 'Down' with 100% strength and an ADX of 47.51, suggesting underlying weakness and potential for a reversal. This mixed risk sentiment, coupled with a strengthening dollar, creates headwinds for silver. The recent news also provides context; a report noting that Gold found support at $4,000 after a disappointing US payrolls report triggered dollar selling suggests that macro data can indeed influence precious metals, and a stronger dollar, as seen now, works against them. The lack of a clear, sustained risk-off sentiment in equities means that silver isn't benefiting from its safe-haven status as much as it might otherwise.
The Bull Case: Can Silver Find Its Footing Near $59.80?
Despite the overwhelming bearish signals across shorter timeframes, there are glimmers of hope for silver bulls, particularly when examining longer-term trends and potential oversold conditions. The daily chart, while showing a strong 38.14 ADX indicating a powerful trend, also presents a Stochastic oscillator with a bullish crossover (%K at 69.75, %D at 48.44). This suggests that while the trend might be strong, the market may be entering a phase where upward momentum could build. The RSI(14) on the daily chart at 37.77, though trending down, is still some distance from extreme oversold territory, leaving room for a potential bounce before hitting critical levels. Historically, significant price drops often lead to sharp, albeit temporary, reversals as short-sellers take profits and dip-buyers step in. The price of $59.80 itself is a psychological level, and a failure to decisively break and hold below it could trigger a short-covering rally.
Furthermore, the underlying fundamentals that typically support silver demand remain largely intact, even if they are being overshadowed by current market dynamics. Inflationary pressures, though perhaps moderating in some economies, are still a concern globally. Central bank policies, while hawkish in some instances, are also being closely watched for any signs of dovish pivots or pauses, which could reignite demand for hard assets like silver. The recent news about Ternium and Nucor ranking as top metals picks among analysts, while specific to steel, indicates a general positive outlook for the metals sector, which could eventually spill over into precious metals. If upcoming economic data, such as inflation reports or employment figures, surprise to the downside, it could fuel expectations for central bank easing, thereby boosting silver's appeal as an inflation hedge and a store of value. The current dip might simply be an overreaction, creating a potential buying opportunity for those with a longer-term perspective.
From a technical perspective, the 1-hour chart, despite its bearish signals, shows the RSI at 32.59 and Stochastic with a clear oversold reading. While this doesn't negate the trend, it highlights that the selling momentum might be reaching an extreme on this very short timeframe. If sellers become exhausted near the $59.80 mark, a bounce could be swift. The support levels identified on the 1-hour chart at 59.60, 59.00, and 58.58 represent potential areas where buying interest could emerge. A failure to break these levels decisively could signal a short-term bottom. The 4-hour chart also shows a Stochastic bullish crossover, which, if confirmed by follow-through buying, could initiate a move higher. This internal conflict between shorter-term oversold conditions and longer-term bearish trends is precisely what defines a battleground market, where bulls are looking for any sign of weakness in the bear's armor.
The Critical Levels: Where the Battle Will Be Won or Lost
The $59.80 price point is more than just a number; it's a critical area of interest for both sides of the market. On the immediate 1-hour chart, the first line of defense for the bulls is the support at $59.60. A break below this level would immediately target the next support at $59.00, and then further down to $58.58. These are the trenches where the bears will likely try to dig in. Conversely, for the bulls to regain any semblance of control, they need to push silver back above immediate resistance levels. The first significant hurdle is at $60.63, followed by $61.05 and then $61.66 on the 1-hour chart. A decisive move and sustained hold above these levels would be the first sign that the bearish momentum is faltering.
On the 4-hour chart, the support levels shift slightly, with the price currently hovering near the 4-hour support of $59.66. Below this lies $58.88. Resistance on this timeframe is seen at $61.67, $62.45, and $63.07. These are the levels that will dictate the short-to-medium term trajectory. The daily chart offers a broader perspective, with key support identified at $61.15, $60.29, and $59.25. Resistance on the daily chart stands at $63.05, $64.09, and $64.95. The price action around these daily levels will be crucial in determining the longer-term trend. A sustained break below the daily support at $59.25 would likely signal a deeper correction, while a push above the daily resistance at $63.05 could indicate a reversal of the recent downtrend.
The interplay between these levels and the prevailing technical indicators is key. For instance, if silver bounces from the 1-hour support of $59.60 and the RSI starts to climb out of its oversold condition, it could signal a short-term bullish opportunity. However, if the price breaks through the 1-hour support at $59.00 and the daily ADX continues to hold above 35, confirming a strong trend, then the bearish case remains dominant. Traders will be watching the DXY closely; if it falters from its current perch around 101.08, it could provide a much-needed tailwind for silver, potentially helping it reclaim some of its lost ground and test higher resistance levels.
The Verdict: A Precarious Balance
The current technical setup for XAGUSD presents a precarious balance, heavily tilted towards the bears in the short term but with underlying factors that could support a recovery. The overwhelming 'SELL' signals on the 1-hour timeframe, coupled with the strengthening DXY and the inherent weakness suggested by the S&P 500's daily trend, paint a challenging picture for silver bulls. The price action near $59.80 is critical; a decisive break below this psychological level and the immediate support at $59.60 could trigger further liquidation, pushing prices towards the $59.00 and $58.58 zones. The ADX readings across multiple timeframes reinforce the idea that a strong trend is in play, and currently, that trend is downwards.
However, markets are rarely one-sided. The potential for oversold conditions on shorter timeframes, highlighted by the Stochastic crossovers on the 1-hour and 4-hour charts, and the bullish Stochastic signal on the daily chart, cannot be ignored. If broader market sentiment shifts towards risk aversion, or if key economic data points to a potential easing of inflation or a pause in central bank tightening, silver could find a strong bid. The resilience of gold, finding support above $4,000 in response to softer data, serves as a precedent. For silver to stage a meaningful recovery, it would likely need to break decisively above the 1-hour resistance at $60.63 and then challenge the more significant daily resistance at $63.05. Until then, the path of least resistance appears to be downwards, with $59.80 serving as a crucial, albeit potentially temporary, line in the sand.
⚠️ Bearish Momentum Dominates
The preponderance of 'SELL' signals on the 1-hour and 4-hour charts, combined with a strengthening DXY and the bearish trend on the S&P 500's daily chart, suggests that further downside pressure on XAGUSD is likely in the immediate term. Traders should remain cautious and look for confirmation before considering long positions.
The battle at $59.80 is far from over. While the bears currently hold the advantage, any shift in macroeconomic winds or a failure to break key support could quickly turn the tide. Patience and disciplined risk management will be paramount for traders navigating this volatile environment. The market is currently favoring sellers, but the potential for a sharp reversal, driven by oversold technicals or a macro catalyst, remains a distinct possibility.
💡 Key Level Watch
The $59.80 price point is crucial. A sustained break below $59.60 on the 1-hour chart could accelerate declines towards $59.00 and $58.58. Conversely, a decisive move above $60.63 could signal a short-covering rally, targeting higher resistance levels.
The coming days will be critical. All eyes will be on key economic releases and central bank commentary for clues about the future direction of interest rates and inflation. These factors, more than anything, will likely dictate whether silver can find sustained support or succumbs to the prevailing bearish pressure. For now, it's a tightrope walk above $59.80.
Bearish Scenario: Downside Acceleration
70% ProbabilityNeutral Scenario: Consolidation Around $59.80
20% ProbabilityBullish Scenario: Short-Covering Rally
10% ProbabilityFrequently Asked Questions: XAGUSD Analysis
What happens if XAGUSD breaks decisively below the $59.60 support level?
A confirmed break below $59.60 on the 1-hour chart would likely trigger stop-loss orders, accelerating declines towards the $59.00 and potentially the $58.58 support levels. This would reinforce the bearish trend, especially if the ADX remains elevated.
Should I buy XAGUSD at current levels near $59.80 given the oversold RSI on the 1-hour chart?
Buying at $59.80 requires caution. While the 1-hour RSI at 32.59 suggests oversold conditions, the overall trend remains bearish. A confirmed bounce with bullish Stochastic confirmation and a break above $60.63 resistance would be needed to validate a short-term bullish entry.
Is the Stochastic bullish crossover on the daily chart (K=69.75, D=43.41) a reliable buy signal for XAGUSD?
The daily Stochastic crossover is a potentially bullish signal, but it's occurring within a broader trend that still shows strong bearish momentum on shorter timeframes (ADX 38.37). This divergence suggests caution; a confirmed break above daily resistance at $63.05 would be needed for higher conviction.
How will the strengthening DXY around 101.08 affect XAGUSD this week?
The rising DXY exerts downward pressure on silver by making it more expensive for holders of other currencies. If the DXY continues to climb, it will likely hinder any attempts by XAGUSD to rally and could contribute to further price declines unless a significant risk-off event boosts safe-haven demand for silver.
| Indicator | Value | Signal | Interpretation |
|---|---|---|---|
| RSI (14) | 32.59 | Bearish | Oversold on 1H, downtrending on 4H/1D |
| MACD | Negative | Bearish | Below signal line on 1H/4H/1D |
| Stochastic | K=17.09, D=25.75 | Bearish | Oversold on 1H, K |
| ADX | 26.01 | Bullish Trend | Strong downtrend on 1H, moderate on 4H/1D |
| Bollinger Bands | Below Lower Band | Bearish | Strong selling pressure on 1H/4H |
While the immediate outlook for silver remains challenging, the market always presents opportunities for those who are patient and well-prepared. The current volatility, though unsettling, is also creating specific setups that, with careful analysis and risk management, could prove profitable. The key is to wait for clear signals and avoid chasing price action. Remember, disciplined trading, coupled with a solid understanding of market drivers and technical levels, is the foundation for long-term success in any market environment.
Track markets in real-time
AI-powered analysis, technical indicators and real-time price data.
Join Our Telegram Channel
Breaking market news, AI analysis and trading signals instantly.
Join Channel