

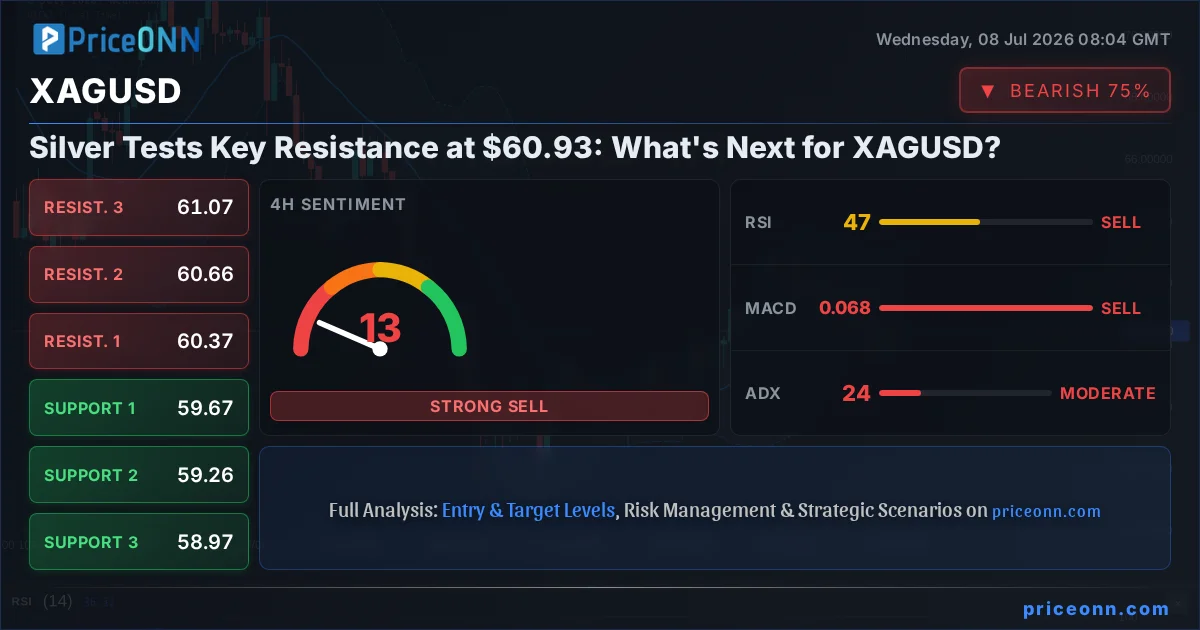
The financial markets are a complex tapestry, woven with threads of economic data, geopolitical tensions, and shifting investor sentiment. In this intricate landscape, silver (XAGUSD) is currently poised at a critical juncture, testing a significant resistance level around $60.93. Its trajectory is not unfolding in isolation; it's deeply intertwined with the broader macroeconomic environment, including the performance of the US Dollar Index (DXY), the health of major equity indices like the S&P 500, and the persistent undercurrents of inflation expectations, often reflected in oil prices. Understanding these intermarket dynamics is paramount for navigating the potential moves ahead for this precious metal.
- XAGUSD is testing resistance at $60.93, with its immediate direction influenced by broader market sentiment.
- The RSI at 48.43 suggests a neutral stance on the 1-hour chart, while ADX at 24.21 indicates a moderate trend strength.
- The US Dollar Index (DXY) is showing mixed signals, currently trading around 100.99, impacting safe-haven assets like silver.
- Geopolitical risks and inflation concerns remain underlying factors that could drive demand for silver.
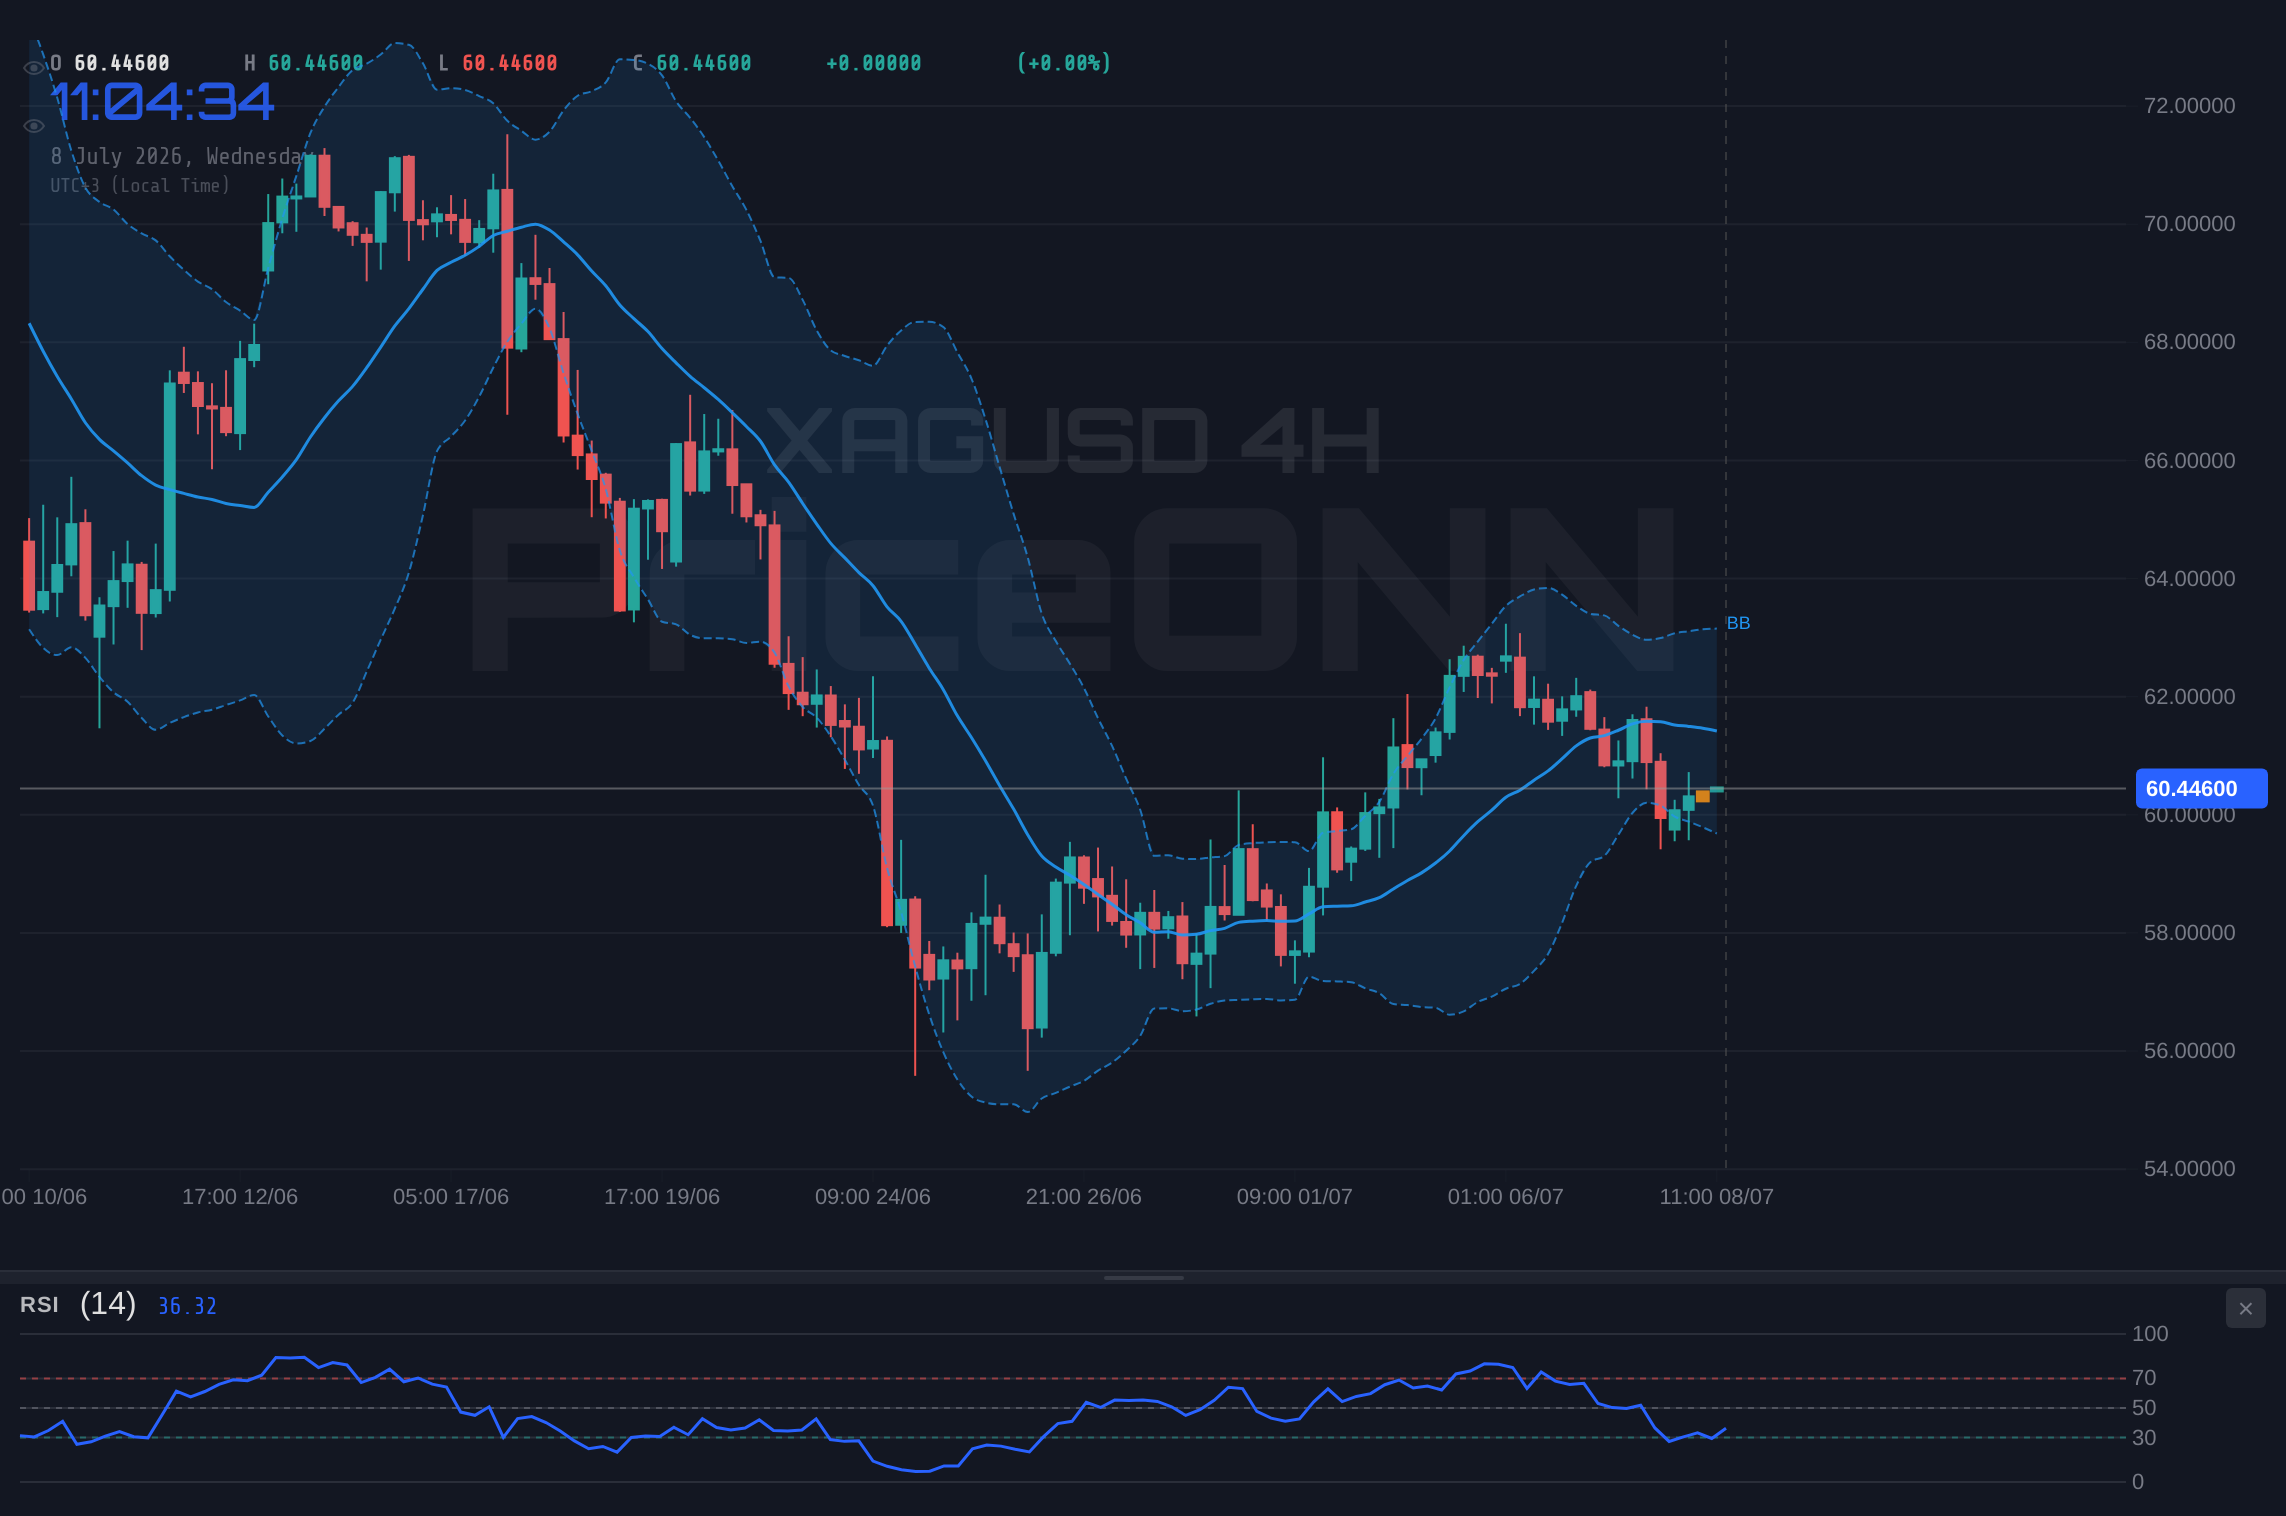
The current price action for XAGUSD, hovering around $60.55, presents a compelling case for multi-timeframe analysis. On the 1-hour chart, the Relative Strength Index (RSI) sits at 48.43, indicating a neutral market condition with a slight downward inclination. This suggests that neither buyers nor sellers are firmly in control in the very short term. However, the Average Directional Index (ADX) at 24.21 points to a moderately trending market, implying that while there isn't a runaway trend, there is some directional impetus. The MACD indicator showing positive momentum, with the MACD line above the signal line, offers a counterpoint, suggesting potential for upward movement. Conversely, the Bollinger Bands are positioned above the middle band, indicating an upward bias in the short term, but the Stochastic oscillator, with K=72.88 and D=61.73, signals a strong upward momentum and is approaching overbought territory, hinting at a potential pause or pullback.
Navigating the Cross-Market Currents
To truly grasp the forces shaping XAGUSD's price, we must look beyond its immediate chart patterns and examine its correlations with major market indices. The US Dollar Index (DXY) is a crucial barometer. Currently trading around 100.99 with a slight downward bias on the 1-hour chart, its movements have a significant inverse relationship with silver. A weakening dollar typically fuels demand for commodities like silver, as they become cheaper for holders of other currencies. However, the DXY's 4-hour chart shows a bullish signal with ADX at 19.83, indicating a nascent trend, while the daily chart shows a strong upward trend (ADX 36.2) despite a current bearish stochastic signal. This mixed picture for the dollar adds a layer of uncertainty to silver's outlook.
Furthermore, the performance of equity markets, particularly the S&P 500 and Nasdaq, provides insights into risk appetite. The S&P 500 is currently showing a strong upward trend on the 1-hour chart (ADX 49.72), trading at 6572.87. This suggests a healthy risk appetite in the broader market, which can sometimes divert capital away from safe-haven assets like silver. However, the daily chart for the S&P 500 shows a bearish trend (ADX 47.51), indicating underlying weakness despite the short-term strength. This divergence between short-term optimism and longer-term caution in equities could create a tug-of-war for silver, potentially supporting it if risk sentiment deteriorates.
Oil prices, a key indicator of inflation expectations and geopolitical risks, also play a vital role. Brent crude is trading around $75.83, showing a strong upward trend on the 1-hour chart (ADX 49.32) and is in overbought territory on the 4-hour chart (Stochastic K=89.82). Rising oil prices often correlate with increased inflation fears, which historically can drive demand for silver as an inflation hedge. The fact that Brent is exhibiting strong bullish momentum while showing signs of overextension suggests that inflationary pressures are afoot, potentially providing a tailwind for silver, even if other indicators suggest caution.
Technical Crossroads: 1-Hour vs. 4-Hour Divergence
Delving deeper into XAGUSD's technicals, we observe notable divergences across timeframes. On the 1-hour chart, the overall signal leans towards 'SELL' (Sell: 5, Buy: 3), with the RSI at 48.43 indicating a slight bearish tilt. The MACD shows positive momentum, but the Stochastic oscillator is nearing overbought conditions, suggesting potential for a short-term pullback. The ADX of 15.81 points to a weak trend, reinforcing the idea of consolidation or a potential reversal in the immediate hours. This paints a picture of a market that is hesitant to make a decisive move.
However, the 4-hour timeframe presents a different narrative, with an overall 'SELL' signal (Sell: 7, Buy: 1) and a stronger trend confirmation from the ADX at 26.69. The RSI here is at 49.29, still in neutral territory but with a downward inclination. The MACD shows negative momentum, and the Stochastic oscillator (K=22.32, D=28.28) is in oversold territory with a bearish crossover, reinforcing the selling pressure on this timeframe. The Bollinger Bands are also below the middle band, suggesting a downward bias. This confluence of bearish indicators on the 4-hour chart suggests that the immediate upward pressure seen on the 1-hour chart might be temporary, and the medium-term trend could be shifting downwards.
The daily chart adds another layer to this complex picture. It shows an overall 'SELL' signal (Sell: 6, Buy: 2), with the ADX at a robust 37.31, confirming a strong trend – albeit a downward one on this timeframe. The RSI is at 43.6, continuing the bearish inclination, while the MACD displays positive momentum, creating a conflict. The Stochastic oscillator, however, is in bullish territory (K=71.91, D=58.79) with a bullish crossover, contradicting the longer-term bearish trend indicated by the ADX and RSI. This mixed signal on the daily chart suggests that while the overall trend might be down, there's a potential for a bounce or a period of consolidation before any significant directional move.
The $60.93 Line in the Sand: Scenario Planning
The immediate focus for XAGUSD traders will undoubtedly be the resistance level at $60.93. This is not just an arbitrary price point; it represents a confluence of technical factors and a psychological barrier. A decisive break above this level, supported by strong volume and positive momentum across multiple timeframes, could signal a continuation of the bullish trend. Conversely, a failure to breach $60.93, especially if accompanied by increasing selling pressure and a weakening dollar, could lead to a retracement towards the support levels identified around $60.37 and $59.67.
The recent news flow provides additional context. While there isn't direct breaking news specifically on XAGUSD in the last 48 hours, broader market themes are highly relevant. The mixed signals from central banks, with the ECB hiking rates and the Fed's path still debated, create currency volatility. The Pound's rally, driven by political stabilization, and EUR/USD trading in a narrow range ahead of Fed minutes, highlight the sensitivity of forex markets to central bank policy and political developments. The S&P 500's mixed signals from the labor market and its narrowing range also suggest underlying uncertainty. Gold finding support at $4,000 due to softer inflation expectations and a weaker dollar offers a parallel narrative for silver, suggesting that any signs of cooling inflation or a dovish shift from the Fed could bolster demand for precious metals.
Given the conflicting signals across timeframes and the broader market uncertainty, a scenario-based approach is crucial. The 1-hour chart shows some potential for upside towards $60.93, but the 4-hour and daily charts suggest underlying bearish pressure. The ADX values are moderate to strong on the 4-hour and daily charts (26.69 and 37.31 respectively), indicating that a trend is present, but the conflicting RSI and Stochastic signals prevent a clear directional call without further confirmation. The current price of $60.55 is caught between these conflicting forces, making the $60.93 resistance level a critical pivot point.
Bearish Scenario: Retreat Below Key Support
65% ProbabilityBullish Scenario: Resistance Breakout
15% ProbabilityNeutral Scenario: Consolidation Phase
20% ProbabilityThe Path Forward: Risk Management and Opportunity
The current technical setup for XAGUSD suggests a period of heightened volatility as it grapples with resistance at $60.93. The overall 'SELL' signals on the 4-hour and daily charts, coupled with a strong ADX on the daily timeframe (37.31), indicate that the path of least resistance might be downwards in the medium term. However, the short-term positive momentum on the 1-hour chart and the bullish Stochastic signal on the daily chart cannot be ignored. This means traders should exercise caution and prioritize risk management.
A break below the 1-hour support at $60.46 could confirm the bearish bias indicated by the longer timeframes, potentially leading to a test of the $60.37 and $59.67 levels. Conversely, a strong push above $60.93, backed by robust volume and broader market support (e.g., a weaker dollar), could signal a bullish reversal. The ADX values across timeframes (15.81 on 1H, 26.69 on 4H, 37.31 on 1D) show an increasing trend strength as we move to longer timeframes, but the conflicting RSI and Stochastic readings prevent a definitive call without further confirmation. The current environment demands patience and a focus on price action around these key levels.
Ultimately, the market's next move will be dictated by a confluence of factors: the strength of the US dollar, the direction of equity markets, inflation expectations, and any emerging geopolitical catalysts. For silver traders, the $60.93 resistance and the $60.46 support on the 1-hour chart are critical levels to watch. A clear break above resistance could open the door for further upside, while a failure and subsequent break below support would likely confirm the bearish sentiment suggested by the higher timeframes. The key takeaway is that the market is at a crossroads, and decisive action will likely follow a clear break of the current trading range.
Frequently Asked Questions: XAGUSD Analysis
What happens if XAGUSD breaks above the $60.93 resistance level?
A decisive break above $60.93, confirmed by strong volume and positive momentum on the 1-hour chart, could trigger a bullish scenario targeting $61.40 and potentially $62.00. However, this thesis would be invalidated if price fails to hold above $60.46.
Should I consider buying XAGUSD at current levels around $60.55 given the mixed signals?
Buying at current levels carries risk due to conflicting signals across timeframes. The 4-hour and daily charts suggest bearish pressure. A more prudent approach might be to wait for a confirmed break above $60.93 or a clear test of support around $60.37, with a probability estimate for the bearish scenario currently at 65%.
Is the RSI at 48.43 a sell signal for XAGUSD right now?
An RSI of 48.43 on the 1-hour chart indicates a neutral position with a slight downward inclination, not a direct sell signal. It suggests the market is not yet overextended in either direction, but the bearish sentiment from longer timeframes warrants caution.
How will the upcoming Fed minutes potentially affect XAGUSD trading this week?
The upcoming Fed minutes could significantly impact XAGUSD by influencing the US Dollar Index (DXY). If the minutes signal a more hawkish stance, a stronger dollar could pressure silver lower. Conversely, dovish signals might weaken the dollar and support silver prices, potentially driving it towards resistance levels.
Technical Outlook Summary
| Indicator | Value | Signal | Interpretation |
|---|---|---|---|
| RSI (14) | 48.43 | Neutral | Neutral territory, slight downward inclination on 1H. |
| MACD | Positive Momentum | Bullish | MACD line above signal line on 1H. |
| Stochastic | K=72.88, D=61.73 | Bullish | Approaching overbought on 1H, upward momentum. |
| ADX | 24.21 | Moderate Trend | Moderate trend strength on 1H, suggesting room for movement. |
| Bollinger Bands | Middle Band | Above | Suggests upward bias on 1H. |
Key Levels for XAGUSD
Track markets in real-time
AI-powered analysis, technical indicators and real-time price data.
Join Our Telegram Channel
Breaking market news, AI analysis and trading signals instantly.
Join Channel