

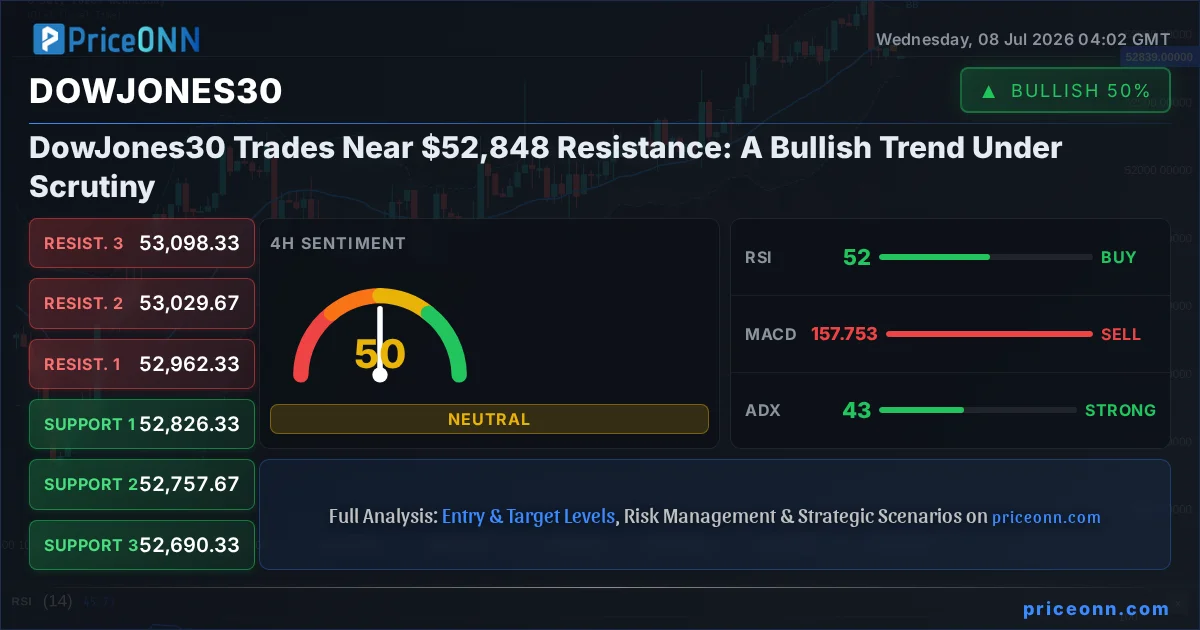
The DowJones30 is currently perched precariously near the $52,848 mark, a significant resistance level that traders are watching with bated breath. This pivotal juncture, where the bulls have driven the index to new heights yet face formidable selling pressure, sets the stage for a critical assessment of the market's immediate direction. Having seen a strong bullish trend on the daily chart, with ADX at 42.91 indicating a robust upward momentum, the question on everyone's mind is whether this ascent can be sustained or if a pullback is imminent. The interplay between the index's current position, its historical performance, and broader market dynamics, including the Dollar Index (DXY), S&P 500, and oil prices, will dictate the next move. This analysis delves into the multi-faceted scenarios shaping the DowJones30's path forward.
- The DowJones30 is testing resistance near $52,848, with the daily ADX at 42.91 signaling a strong trend.
- Critical support for the DowJones30 is identified at $52,664.67 (S1), with further levels at $52,434.33 (S2) and $52,094.67 (S3).
- The Stochastic indicator on the 1D chart is in the overbought zone (K=81.97, D=81.15), suggesting potential for a pullback.
- Correlation analysis shows the DXY at 101.09, indicating dollar strength that could pressure risk assets like the DowJones30.
Navigating the $52,848 Threshold: A Tale of Two Markets
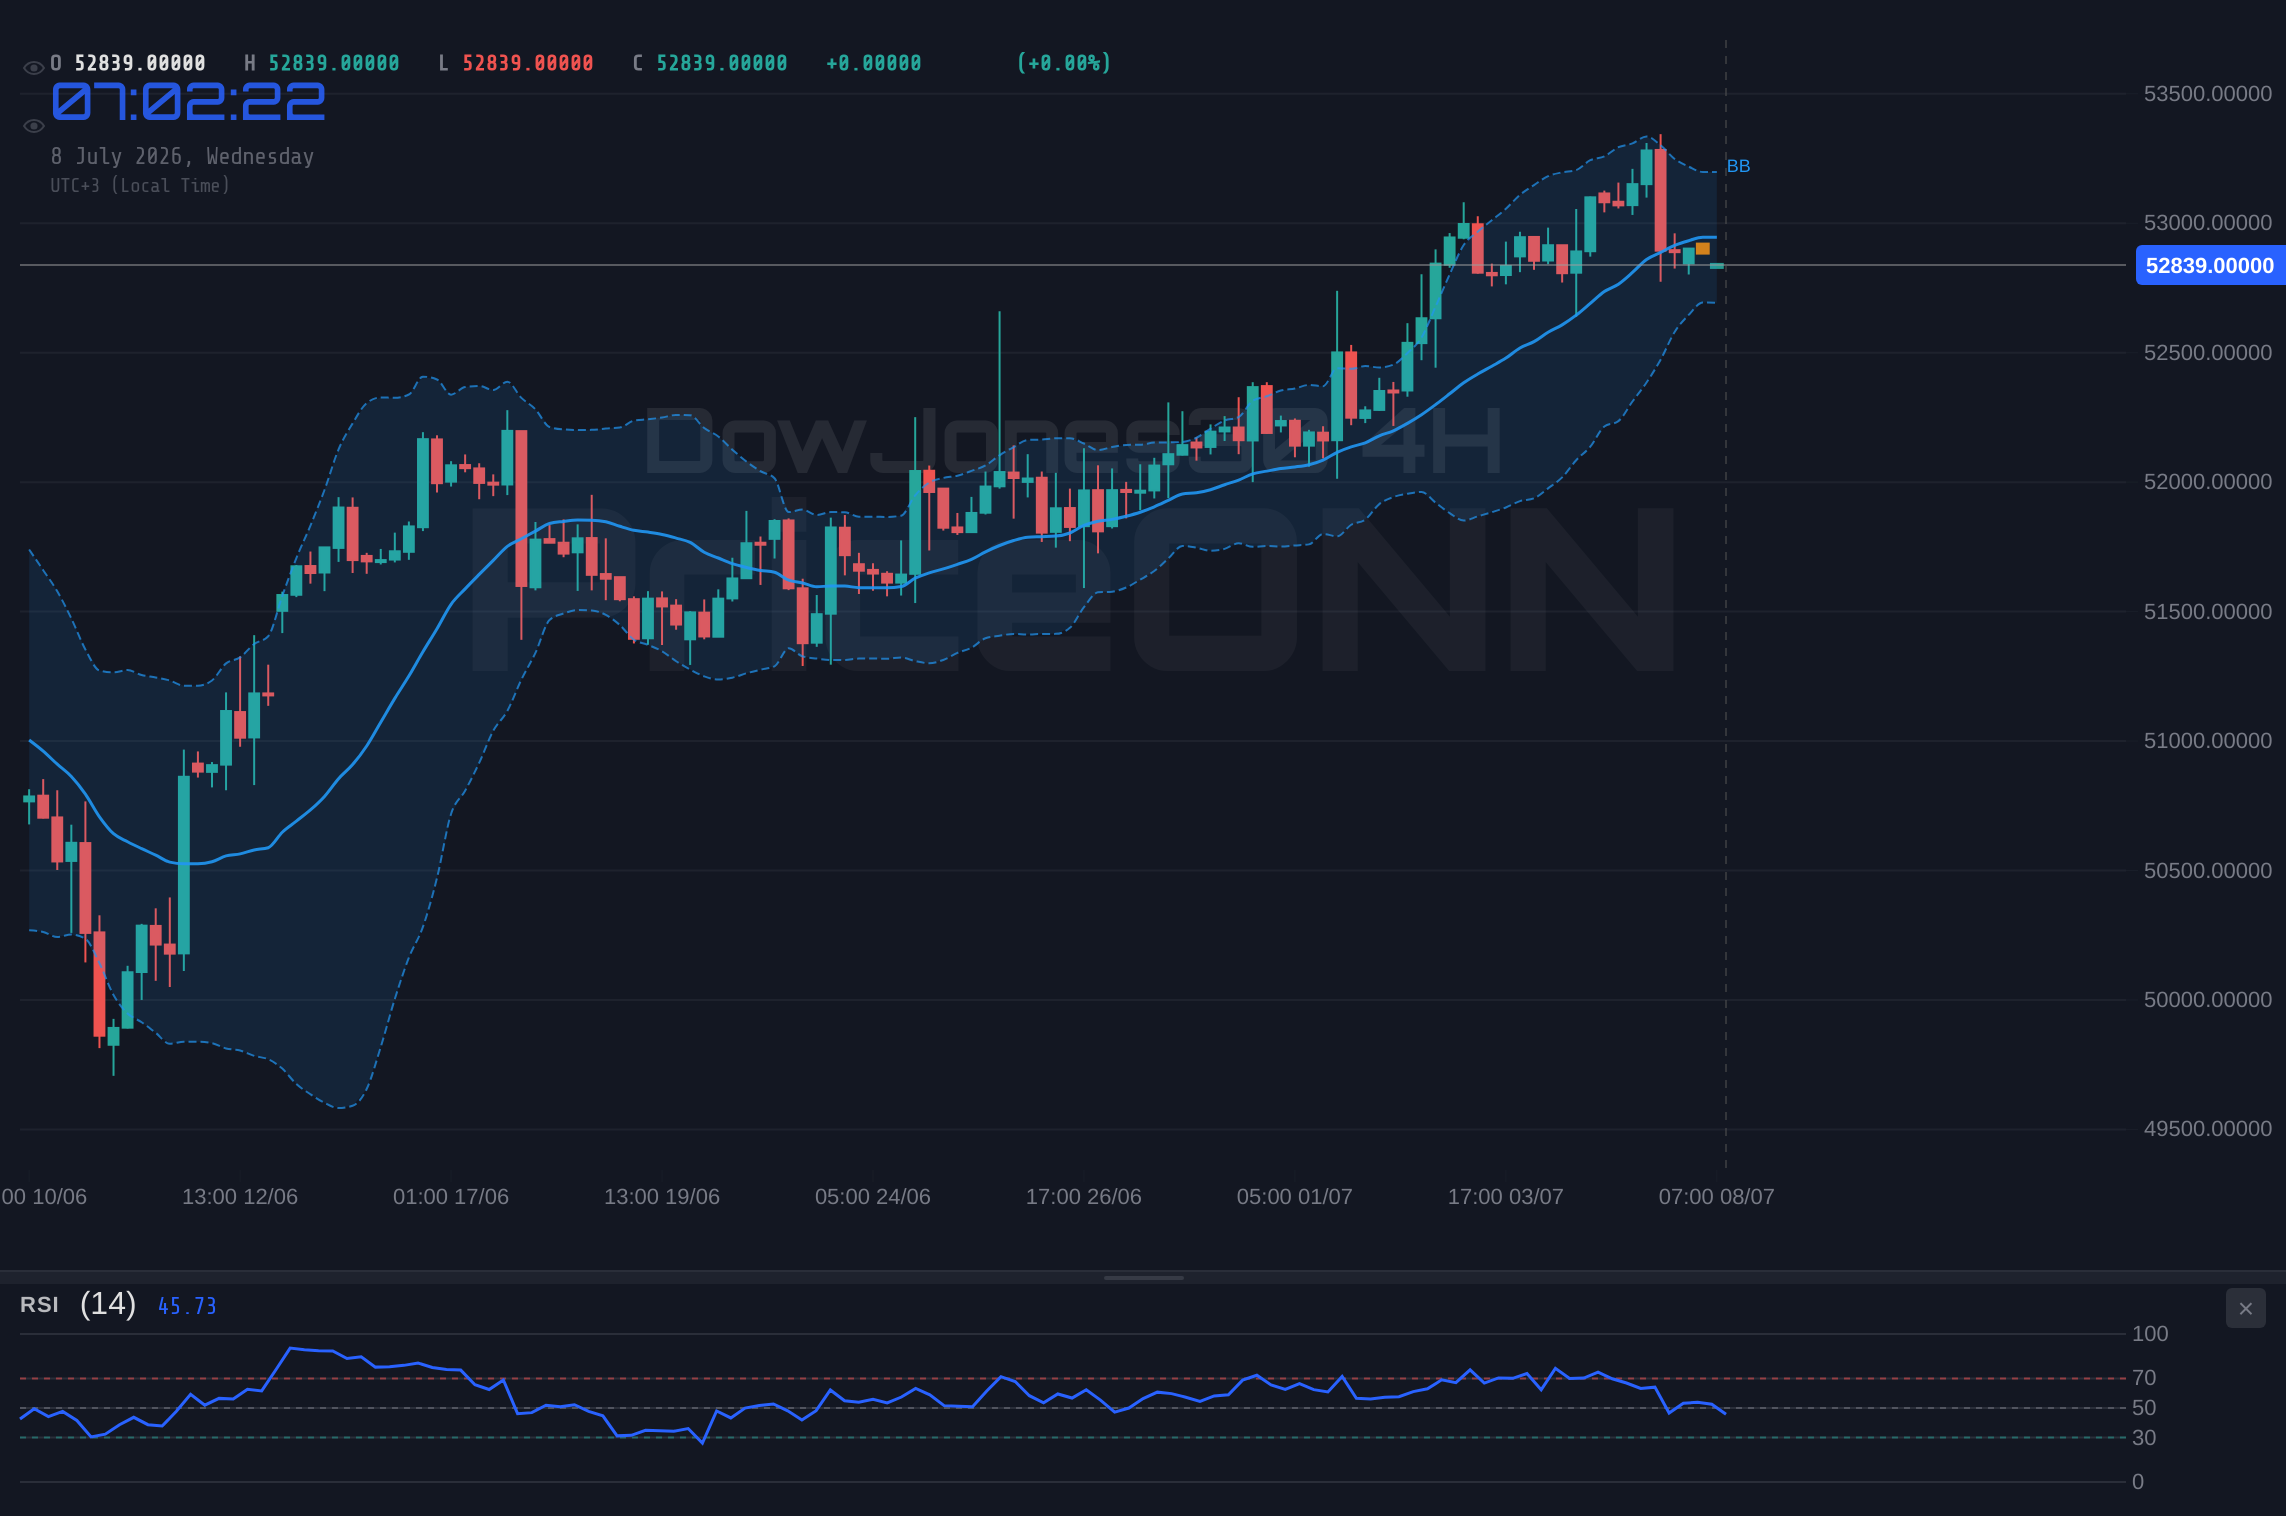
The DowJones30's current trading range, specifically its proximity to the $52,848 resistance level, encapsulates a broader market narrative. On the daily timeframe, the index exhibits a strong bullish trend, supported by an ADX reading of 42.91. This suggests that while momentum is high, the market is also susceptible to sharp reversals if key levels fail. The Stochastic oscillator, however, flashing overbought conditions with %K at 81.97 and %D at 81.15, adds a layer of caution. This divergence between trend strength and overbought indicators is often a precursor to consolidation or a correction. The 4-hour chart presents a more neutral picture, with an ADX of 42.91 still indicating a strong trend, but the RSI at 52.63 and Stochastic at 34.04 suggest a less extreme positioning. The 1-hour chart leans bearish with an RSI of 40.56 and a Stochastic crossover, indicating potential intraday weakness. This multi-timeframe conflict highlights the indecision at current levels.
The Bull's Roadmap: Pushing Past Resistance
For the bulls to maintain control, a decisive break above the $52,848 resistance is paramount. This would not only signal a continuation of the upward momentum but also potentially trigger a fresh wave of buying as the market pushes towards the $52,962.33 level (R1). A sustained move above this initial resistance could then target the $53,029.67 level (R2), and ultimately the psychological $53,098.33 area (R3). The confirmation for this bullish scenario would involve a significant increase in trading volume accompanying the price surge, coupled with a cooling-off of the overbought Stochastic readings on the daily chart. Furthermore, a weakening of the Dollar Index (DXY), currently at 101.09, and a risk-on sentiment reflected in the S&P 500 and Nasdaq showing upward momentum, would provide a favorable macro backdrop. The ADX on the 1-hour chart showing a strong trend (49.72) would need to align with bullish signals across shorter timeframes, rather than the current mixed signals.
Where Bears Take Control: The $52,664.67 Line in the Sand
Conversely, the bearish case gains traction if the DowJones30 fails to decisively break above the $52,848 resistance. The first line of defense for the bulls, and a crucial support level, is $52,664.67 (S1). A close below this level on the 1-hour chart, especially with increasing volume, would signal that the upward momentum is faltering. If this support gives way, the next target for bears would be $52,577.67 (S2), followed by $52,434.33 (S2). A breakdown below these levels would invalidate the bullish trend and potentially open the door for a more significant correction, targeting $52,094.67 (S3). This scenario would be amplified by a strengthening Dollar Index (DXY), a decline in risk appetite signaled by falling S&P 500 and Nasdaq futures, and any negative geopolitical developments. The current 1-hour RSI at 40.56 and negative MACD momentum would support this bearish outlook.
The Waiting Game: Consolidation Around Key Levels
It's also entirely plausible that the DowJones30 enters a period of consolidation, trading within a defined range between the immediate support at $52,664.67 and resistance at $52,848. This neutral scenario often occurs when market participants are awaiting further direction from key economic data or central bank commentary. The conflicting signals from various timeframes and indicators - a strong daily ADX versus overbought daily Stochastic, and mixed intraday signals - lend credence to this possibility. During such a phase, price action might become choppy, with attempts to break either the support or resistance levels being quickly reversed. Volume might dry up as traders hold back, waiting for a clearer catalyst. The 4-hour chart, with its neutral trend strength (50%) and ADX at 42.91, could be indicative of this indecision. A lack of significant news catalysts or unexpected shifts in macro sentiment could prolong this range-bound environment.
The Most Likely Scenario: A Test of Resolve
Considering the confluence of factors, the most probable scenario in the short term appears to be a continued test of the $52,848 resistance, with a heightened risk of a bearish reversal or consolidation. The daily chart's strong ADX (42.91) indicates that underlying trend strength is present, but the overbought daily Stochastic (K=81.97, D=81.15) presents a significant headwind. Intraday charts are showing mixed signals, with the 1-hour leaning bearish and the 4-hour showing a strong trend but also potential for pullbacks. Given the DXY is at 101.09, suggesting dollar strength, and the S&P 500's recent rotation, risk sentiment is not unequivocally bullish. Therefore, a high-probability scenario (approximately 60%) is that the DowJones30 will struggle to decisively break above $52,848 in the immediate term. Instead, we might see a period of consolidation or a test of the $52,664.67 support level. A bullish breakout scenario, while possible, appears less likely without a significant shift in market sentiment or macroeconomic data. The bearish scenario, triggered by a close below $52,664.67, holds a moderate probability (around 30%), while the consolidation scenario accounts for the remaining 10%.
What to Watch This Week: Key Triggers for the DowJones30
The coming week is packed with potential market-moving events that could resolve the current indecision surrounding the DowJones30. Firstly, all eyes will be on any significant shifts in the Dollar Index (DXY). A sustained move above 101.18 could increase pressure on the index. Secondly, traders will be closely monitoring the S&P 500 and Nasdaq for signs of risk appetite. A strong upward move in these indices could lift the DowJones30, while a decline would likely drag it lower. Thirdly, any unexpected geopolitical news or shifts in central bank policy expectations could dramatically alter the market's course. For instance, hawkish commentary from the Fed could strengthen the dollar and weigh on equities. The key technical trigger to watch will be a decisive close above $52,848 for a bullish continuation, or a firm break below $52,664.67 for a bearish outlook. These levels will likely define the DowJones30's trajectory in the short term.
Bearish Scenario: The Retreat Below Support
30% ProbabilityNeutral Scenario: The Waiting Game
10% ProbabilityBullish Scenario: Breaking the Ceiling
60% ProbabilityFAQ: DowJones30 Analysis
What happens if the DowJones30 fails to break above the $52,848 resistance level this week?
If the DowJones30 fails to break above $52,848, a period of consolidation or a pullback towards the $52,664.67 support level is likely. The overbought Stochastic on the daily chart suggests that upward momentum may be waning, increasing the probability of a bearish scenario playing out.
Should I consider buying DowJones30 at current levels near $52,848, given the conflicting signals?
Buying at current levels near $52,848 carries significant risk due to the resistance and overbought indicators. A more prudent approach would be to wait for confirmation: either a decisive breakout above $52,848 with strong volume or a pullback to a more attractive support level like $52,664.67, ideally with signs of bullish reversal.
Is the RSI at 40.56 on the 1-hour chart a strong sell signal for DowJones30 right now?
An RSI of 40.56 on the 1-hour chart indicates bearish momentum but is not yet in oversold territory. It suggests selling pressure is present, aligning with the potential for a short-term dip. However, confirmation from other indicators like MACD and price action breaking below immediate support would strengthen this sell signal.
How might the strengthening DXY at 101.09 affect the DowJones30's trend this week?
A strengthening DXY, currently at 101.09, typically exerts downward pressure on risk assets like the DowJones30. This correlation suggests that continued dollar strength could hinder the index's ability to break through resistance, potentially increasing the odds of a bearish scenario or at least prolonging consolidation.
Track markets in real-time
AI-powered analysis, technical indicators and real-time price data.
Join Our Telegram Channel
Breaking market news, AI analysis and trading signals instantly.
Join Channel