

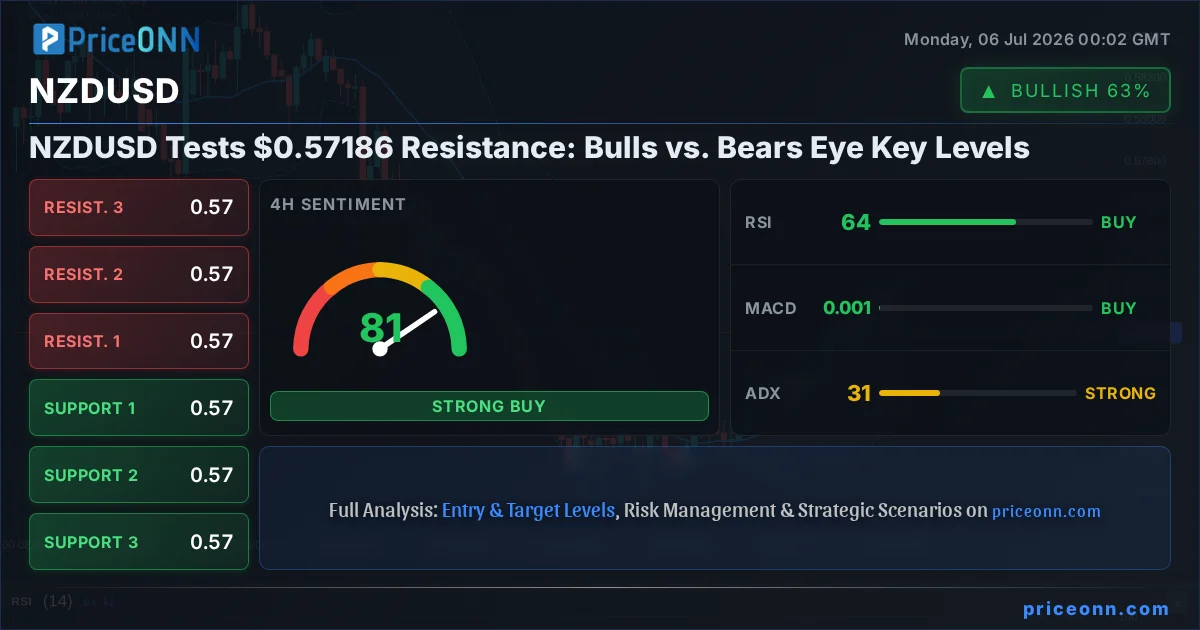
The currency pair NZDUSD is currently locked in a fierce tug-of-war, hovering just below the critical resistance level of $0.57186. With the current price at $0.57013, traders are closely watching to see if the recent upward momentum can break through this barrier or if sellers will step in, signaling a potential reversal. This tension highlights the ongoing battle between bullish and bearish forces, each with compelling technical arguments and market data supporting their case. Understanding this dynamic is crucial for navigating the short-term direction of the Kiwi dollar.
- NZDUSD is currently trading at $0.57013, approaching the 4H resistance level of $0.57186.
- The 1H RSI is at 64.55, signaling upward momentum but not yet overbought, while the 4H RSI sits at 67.5, nearing overbought territory.
- Key support levels are identified at $0.5699, $0.5668, and $0.5642, while resistance is eyed at $0.5719, $0.5747, and $0.5775.
- The ADX indicator across multiple timeframes (1H: 33.29, 4H: 35.64, 1D: 39.05) indicates strong trend conditions, suggesting a potential for decisive moves.
The market sentiment surrounding NZDUSD is currently divided, reflecting a classic bull vs. bear confrontation at a pivotal technical juncture. On one hand, buyers have managed to push the price higher from recent lows, aiming to breach the $0.57186 resistance. This move is supported by a generally positive trend signal on the 1-hour and 4-hour charts, with ADX readings consistently above 30, indicating a strong prevailing trend. The Stochastic Oscillator on the 1-hour chart also provides a bullish signal, with the %K line crossing above the %D line at 70.79 and 47.48 respectively. However, the daily timeframe presents a more neutral picture, with an RSI of 43.99 and an ADX of 39.05 suggesting a powerful downtrend that could reassert itself. This divergence across timeframes creates uncertainty, making the upcoming price action at the $0.57186 resistance level a critical determinant of the short-term outlook for the Kiwi.
The bullish thesis for NZDUSD hinges on the continuation of the intraday upward momentum and a decisive break above the immediate resistance. Buyers are likely encouraged by the fact that the 1-hour chart indicators, despite showing some caution, lean towards a buy signal (7 buy, 1 sell, 0 neutral). The RSI at 64.55, while approaching overbought territory, is not yet there, leaving room for further upside. Similarly, the Stochastic crossover on the 1-hour chart is a classic buy signal. The recent price action, seeing NZDUSD clear the $0.5700 figure as noted in recent market commentary, suggests that upward pressure is present. Furthermore, the ADX at 33.29 on the 1-hour chart and 35.64 on the 4-hour chart indicates that if a breakout occurs, it could be supported by a strong trend, leading to significant price movement. The ability to hold above the support levels of $0.5699 and $0.5668 would be crucial for this bullish scenario to play out, setting the stage for a potential test of higher resistance levels around $0.5747 and $0.5775.
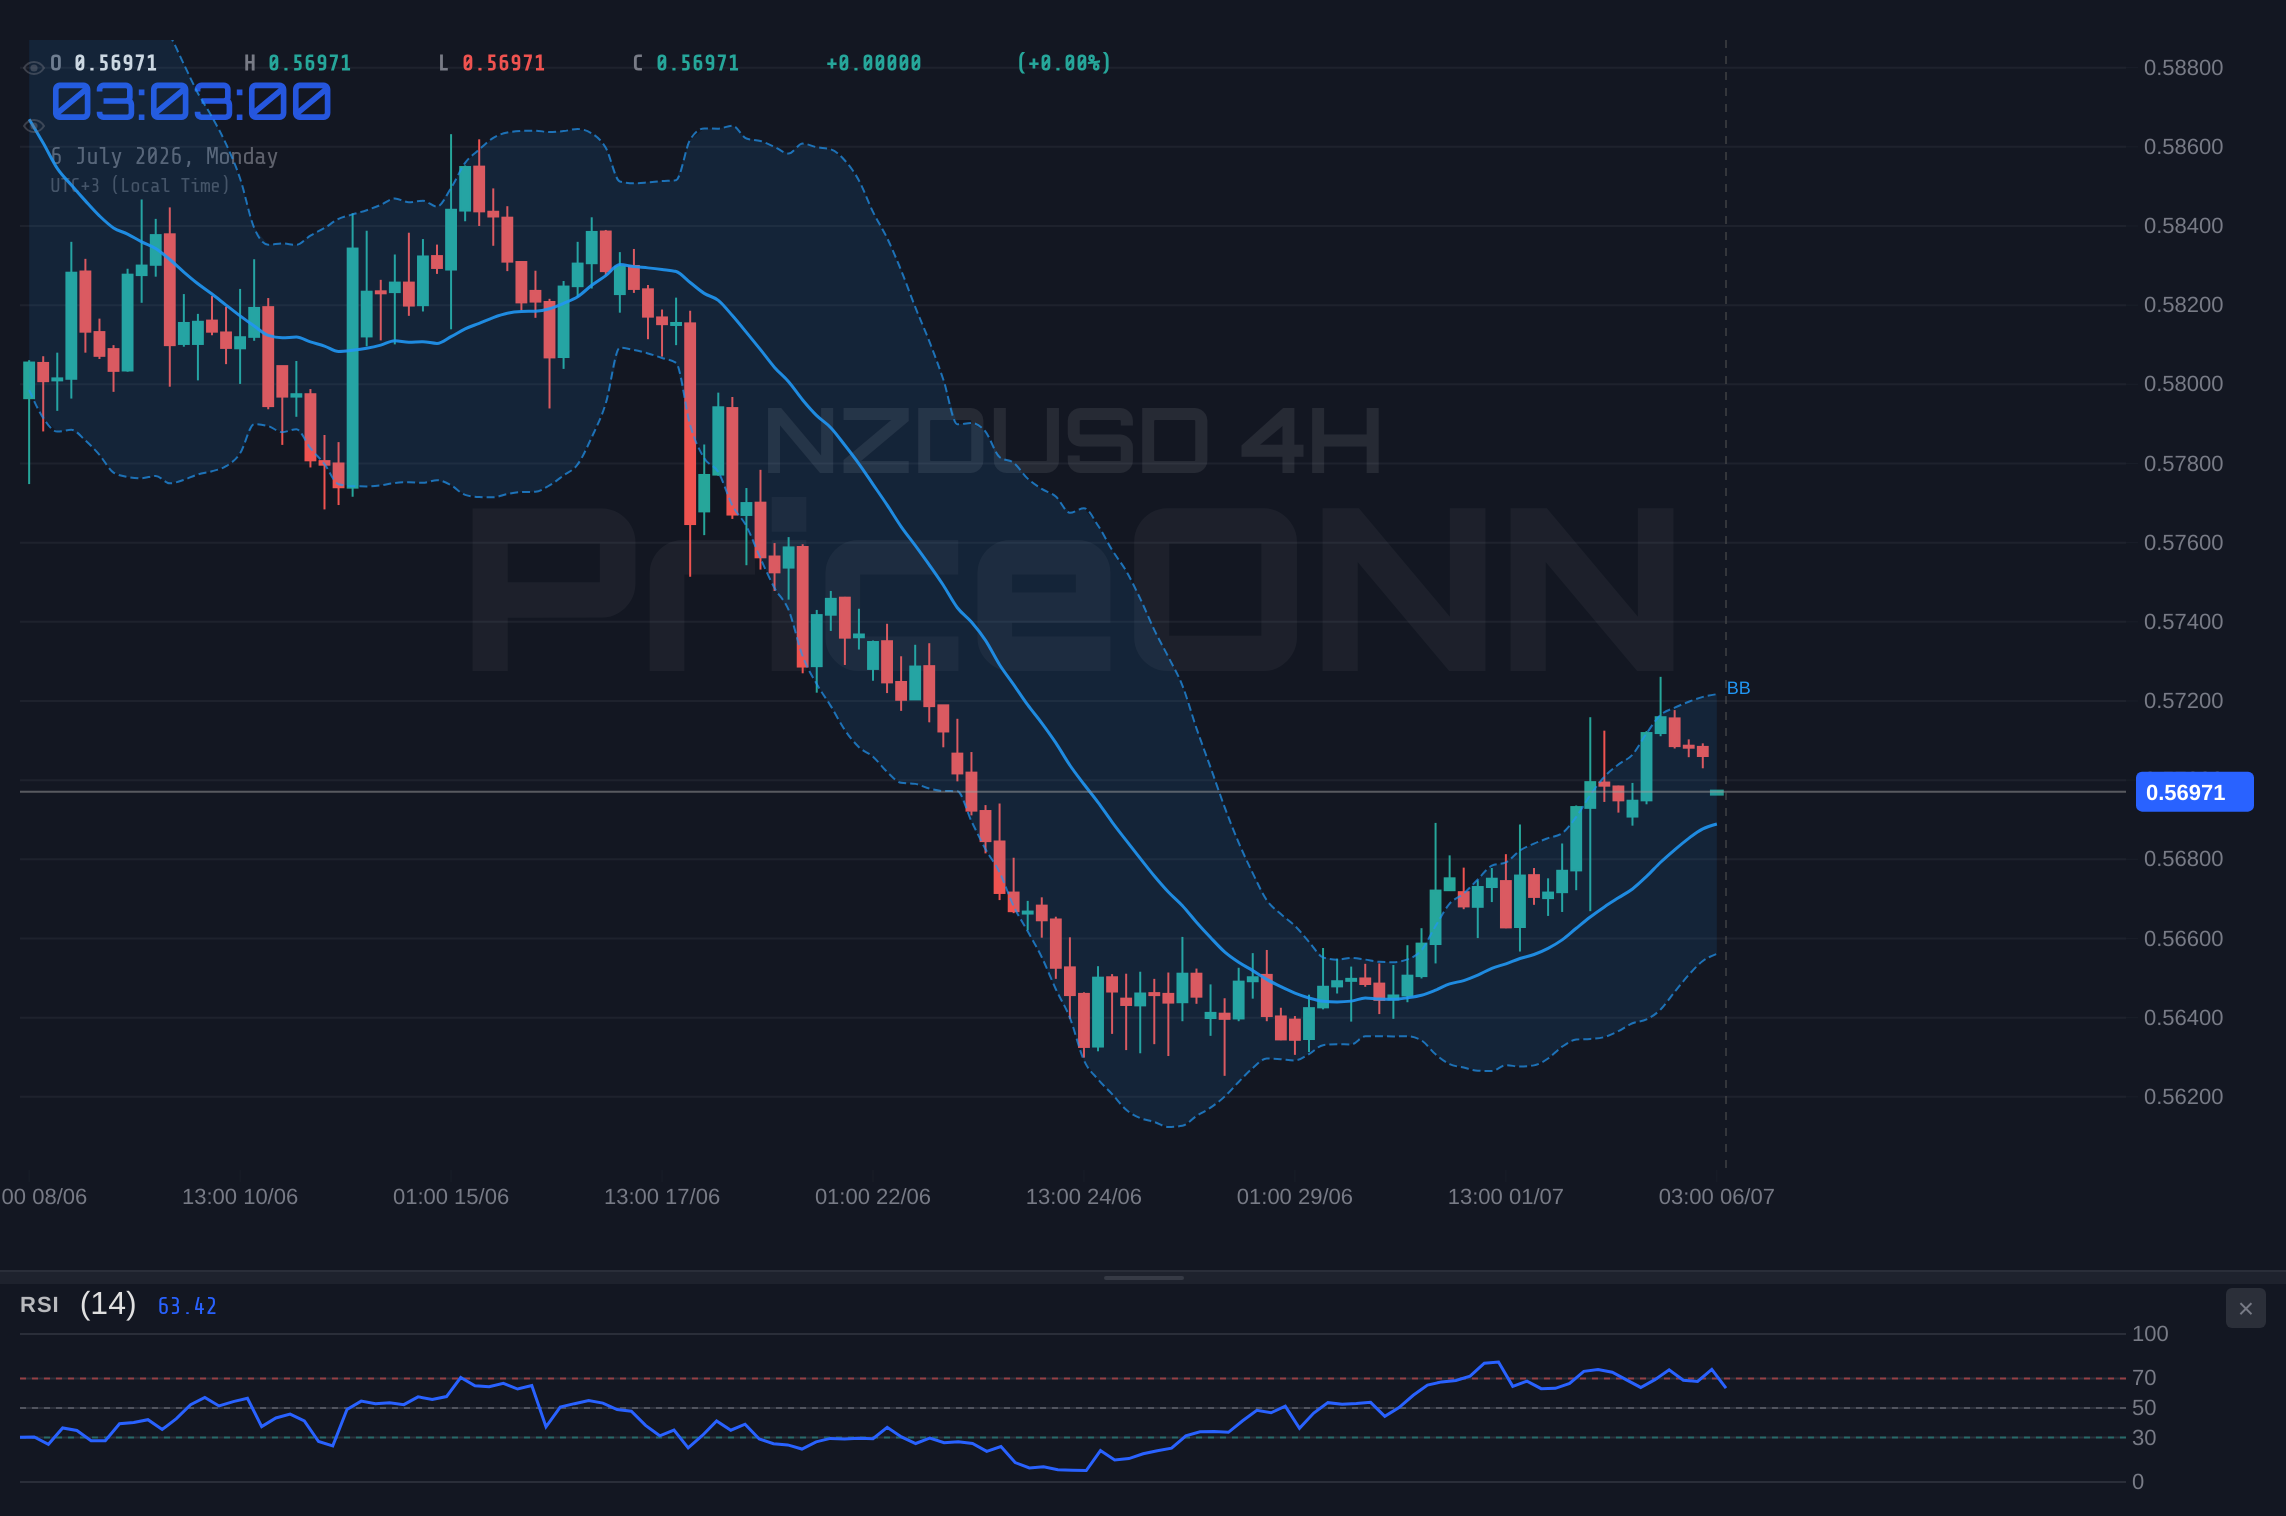
Conversely, the bearish argument rests on the strength of the daily timeframe and the potential for a rejection at the current resistance. The daily RSI at 43.99, while not deeply oversold, indicates a bearish lean, suggesting that the upward move might be a temporary correction within a larger downtrend. The ADX reading of 39.05 on the daily chart is particularly concerning for bulls, signifying a strong existing downtrend that could easily resume. While the 1-hour and 4-hour charts show bullish signals, they could be interpreted as mere pullbacks before a larger decline. The fact that the 4-hour RSI is at 67.5, nearing the 70 threshold, adds weight to the bearish case, as this often precedes a price consolidation or reversal. If NZDUSD fails to decisively break above $0.57186 and instead bounces lower, sellers could target the support levels at $0.5699, $0.5668, and ultimately the more significant daily support at $0.5642. The prevailing downtrend on the daily chart implies that any rallies are opportunities for sellers to re-enter the market at better prices.
Navigating the Technical Landscape: Indicators in Conflict
The technical indicators present a fragmented picture, creating a challenging environment for traders. On the 1-hour timeframe, the ADX at 33.29 and a strong buy signal from Stochastic (K=70.79, D=47.48) point towards potential upside. The RSI at 64.55 is also in bullish territory, albeit not yet overbought. This suggests that short-term traders might find opportunities on the buy-side, anticipating a push towards the $0.57186 resistance. However, the narrative shifts dramatically when we look at the daily chart. Here, the RSI at 43.99 indicates weakness, and the ADX at 39.05 signals a robust downtrend is in play. This stark contrast suggests that the intraday strength might be a counter-trend move, vulnerable to a sharp reversal. The MACD on the daily chart is also showing negative momentum, further supporting the bearish view on longer timeframes.
The 4-hour timeframe adds another layer of complexity. While the ADX remains strong at 35.64, indicating a trending market, the RSI at 67.5 is hovering close to the overbought zone. The Stochastic here (K=93.44, D=85.92) is firmly in overbought territory, flashing a warning sign for further immediate gains. This suggests that the upward move on the 4-hour chart might be losing steam and could be due for a pullback. The Bollinger Bands on the 1-hour and 4-hour charts are positioned above the middle band, indicating an upward bias in the short term. However, the daily Bollinger Bands are below the middle band, aligning with the bearish sentiment on the longer timeframe. This confluence of conflicting signals across different timeframes underscores the importance of price action at the key resistance level of $0.57186. A failure to break through could quickly invalidate the short-term bullish setups.
Correlation analysis provides additional context. The Dollar Index (DXY) is currently trading around 100.87, showing a slight upward bias on the 1-hour chart but a bearish lean on the 4-hour. A strengthening DXY typically puts pressure on riskier currencies like the NZD, suggesting that any significant DXY rally could cap NZDUSD's upside. Conversely, if the DXY falters, it could provide a tailwind for NZDUSD. The S&P 500 and Nasdaq are showing mixed signals, with the S&P 500 exhibiting a strong daily downtrend while the Nasdaq shows a neutral stance. This suggests that risk appetite is not uniformly strong, which could limit the appeal of the New Zealand dollar as a risk-on asset. The Brent crude oil price, trading around $71.64, is in a daily downtrend, indicating potential weakness in commodity-linked currencies if this trend continues. These broader market correlations suggest that while intraday momentum might favor the bulls, the longer-term macroeconomic backdrop presents headwinds.
The Bull Case: Riding the Intraday Wave
The bullish scenario for NZDUSD is predicated on the idea that the current upward momentum, driven by short-term technical signals, will prevail over longer-term bearish trends. The trigger for this scenario would be a decisive close above the $0.57186 resistance level, potentially fueled by strong intraday buying pressure. If this breakout occurs, the immediate target would be the next resistance at $0.5747. A successful breach of this level could then open the door for a move towards the subsequent resistance at $0.5775. The invalidation of this bullish thesis would occur if the price fails to hold above the $0.5700 handle and closes below the 1-hour support at $0.5699. In such a case, the bullish argument would be severely weakened, and traders would need to reassess the potential for a deeper decline.
The strength of this bullish case is supported by the confluence of positive signals on the 1-hour timeframe. The ADX at 33.29 indicates a strong trend is in place, and if the price breaks through resistance, this trend could accelerate. The Stochastic oscillator's bullish crossover and the RSI's position below the 70 overbought threshold suggest there is still room for upward movement. Furthermore, the fact that NZDUSD has already cleared the $0.5700 figure, as indicated by recent market commentary, provides psychological support for further gains. This scenario assumes that the daily bearish trend is temporarily paused, and short-term traders can capitalize on the intraday strength. The key is to watch for confirmation of a sustained break above $0.57186, ideally with increasing volume, before committing to a long position.
The Bear Case: Daily Trend Reassertion
The bearish scenario anticipates a rejection at the $0.57186 resistance, leading to a resumption of the daily downtrend. The trigger for this scenario would be a failure to break higher, followed by a decisive close below the $0.5700 psychological level and the 1-hour support at $0.5699. If this occurs, the immediate target would be the 4-hour support at $0.5699, followed by the daily support at $0.5668. A further breakdown could then see the price revisiting the significant support level at $0.5642. The invalidation of this bearish thesis would occur if the price decisively breaks and holds above the $0.57186 resistance, and subsequently moves towards $0.5747.
This bearish outlook is strongly supported by the daily timeframe indicators. The RSI at 43.99 and the ADX at 39.05 paint a clear picture of an established downtrend. The fact that the 4-hour RSI is approaching overbought territory at 67.5 also suggests that the current rally might be a temporary pause before the downtrend resumes. Traders looking to short NZDUSD would be waiting for confirmation of a rejection at the resistance, ideally coupled with signs of waning momentum on the shorter timeframes. The broader macroeconomic environment, with a potentially strengthening DXY and mixed signals from global equity markets, could also contribute to a risk-off sentiment that would favor the Kiwi's decline. This scenario views any rallies as opportunities to sell into strength, anticipating a return to lower price levels.
The Neutral Scenario: Range-Bound Uncertainty
Given the conflicting signals across different timeframes, a neutral scenario where NZDUSD consolidates within a defined range is also plausible. The trigger for this scenario would be the price failing to decisively break above $0.57186 resistance or fall below $0.5699 support within the next trading sessions. In this case, the pair might trade sideways, potentially between the $0.5699 support and the $0.5719 resistance. The targets in this scenario would be limited, with the price likely oscillating within this range. The invalidation of the neutral scenario would occur if either the bullish breakout above $0.57186 or the bearish breakdown below $0.5699 materializes with conviction.
The neutral outlook acknowledges the possibility that neither the bulls nor the bears can gain immediate control. The strong ADX readings across timeframes suggest that when a move does occur, it could be significant. However, until that move is confirmed, consolidation is a real possibility. This could be driven by market participants waiting for clearer economic data releases or geopolitical developments. For traders, this scenario implies a period of caution, focusing on range-bound trading strategies or waiting for a definitive breakout signal. The ADX values, while indicating strong trends, could also reflect volatility within a range if key levels are not breached. This sideways movement could continue until a significant catalyst emerges to break the stalemate.
Bearish Rejection Scenario
60% ProbabilityBullish Breakout Scenario
30% ProbabilityConsolidation Scenario
10% ProbabilityFrequently Asked Questions: NZDUSD Analysis
What happens if NZDUSD fails to break above the $0.57186 resistance level?
If NZDUSD fails to break above $0.57186, a rejection is likely, potentially leading to a decline towards the $0.5699 support. The daily downtrend could reassert itself, targeting lower levels like $0.5668.
Should I buy NZDUSD at current levels around $0.57013, given the mixed signals?
Buying at $0.57013 carries risk due to conflicting timeframes. A safer approach would be to wait for confirmation of a break above $0.57186 with strong volume, or for a clear bounce from support near $0.5699.
Is the RSI at 64.55 on the 1-hour chart a concern for NZDUSD bulls?
An RSI of 64.55 is in bullish territory but not yet overbought, leaving room for upside. However, the 4-hour RSI at 67.5 is closer to overbought levels, suggesting that further gains might be limited without a significant catalyst.
How will the DXY's movement at 100.87 affect NZDUSD in the short term?
With the DXY around 100.87, a strengthening dollar could cap NZDUSD's upside, especially if it breaks higher on its own charts. Conversely, a weakening DXY could provide a tailwind for the Kiwi, supporting a move towards $0.57186 resistance.
Track markets in real-time
AI-powered analysis, technical indicators and real-time price data.
Join Our Telegram Channel
Breaking market news, AI analysis and trading signals instantly.
Join Channel