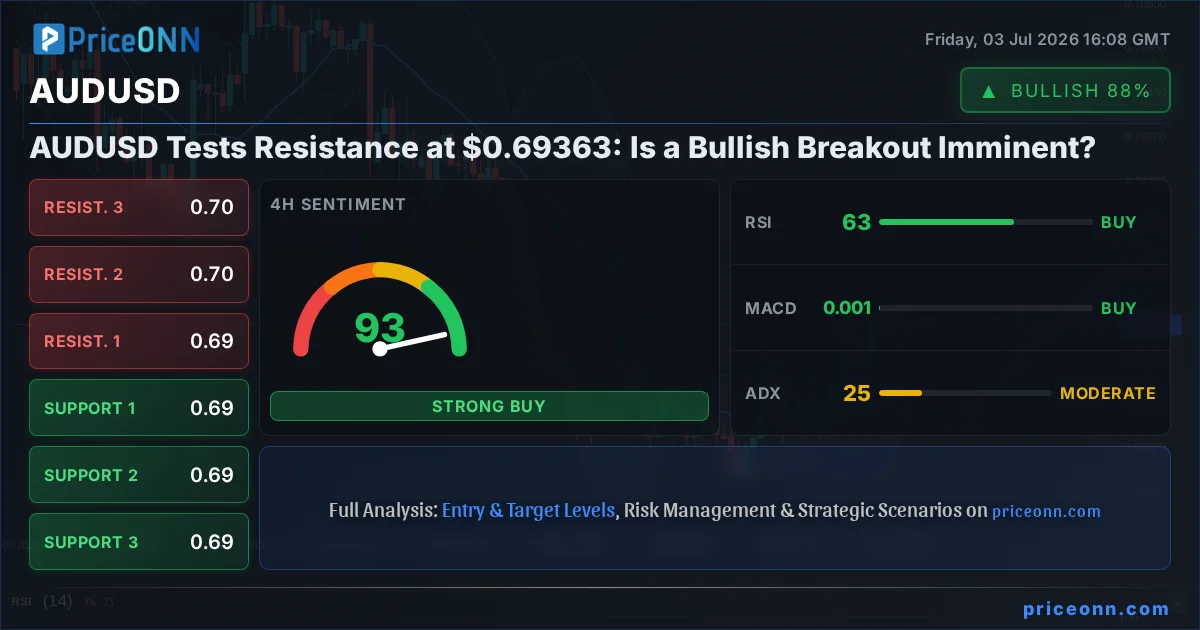
The battleground for AUDUSD is clearly drawn around the $0.69363 mark. As the Australian Dollar dances with resistance, traders are on the edge of their seats, scrutinizing every tick and indicator. Is this the calm before a storm, a consolidation before a breakout, or a final gasp before a significant pullback? The current market data paints a complex picture, with conflicting signals across different timeframes, demanding a deep dive into the technicals and the underlying market sentiment. This isn't just about a single price point; it's about deciphering the narrative that will dictate AUDUSD's next major move.
- RSI at 67.3 signals growing bullish momentum but approaches overbought territory, hinting at potential consolidation or a pullback.
- Critical resistance sits at $0.69467, a level AUDUSD has approached multiple times, indicating significant selling pressure resides there.
- The ADX at 24.68 suggests a moderate uptrend, but its strength needs to be confirmed by price action above resistance.
- Correlation analysis with the DXY, currently at 100.86, suggests a strengthening dollar could cap further upside for AUDUSD.
The AUDUSD pair is currently locked in a tense standoff, hovering precariously near the $0.69363 level. This isn't just another trading day; it's a critical juncture where bulls and bears are fiercely contesting control. The 1-hour chart shows a pair inching upwards, but the daily chart presents a more cautious outlook, hinting at potential headwinds. Understanding the interplay between short-term momentum and longer-term trends is paramount for navigating this volatile environment. The market is alive with speculation, but as always, the charts and the numbers don't lie. Let's break down what's really happening.
The Bullish Case: Momentum and Market Whispers
On the shorter timeframes, the bulls have certainly been making their presence felt. The 1-hour chart for AUDUSD shows a clear upward trajectory, with the price pushing towards resistance. The RSI(14) at 57.99, while still in neutral territory, is trending upwards, suggesting that buying momentum is building. This isn't an extreme overbought reading yet, offering room for further ascent. The MACD, though showing negative momentum on this timeframe, is often a lagging indicator, and its position relative to the signal line can be secondary to price action in the immediate term. More importantly, the general signal across the 1-hour and 4-hour charts leans towards 'BUY', with 6 'BUY' signals and only 2 'SELL' on the 1-hour, and 7 'BUY' signals against 1 'SELL' on the 4-hour. This suggests a short-term bullish bias is currently prevailing.
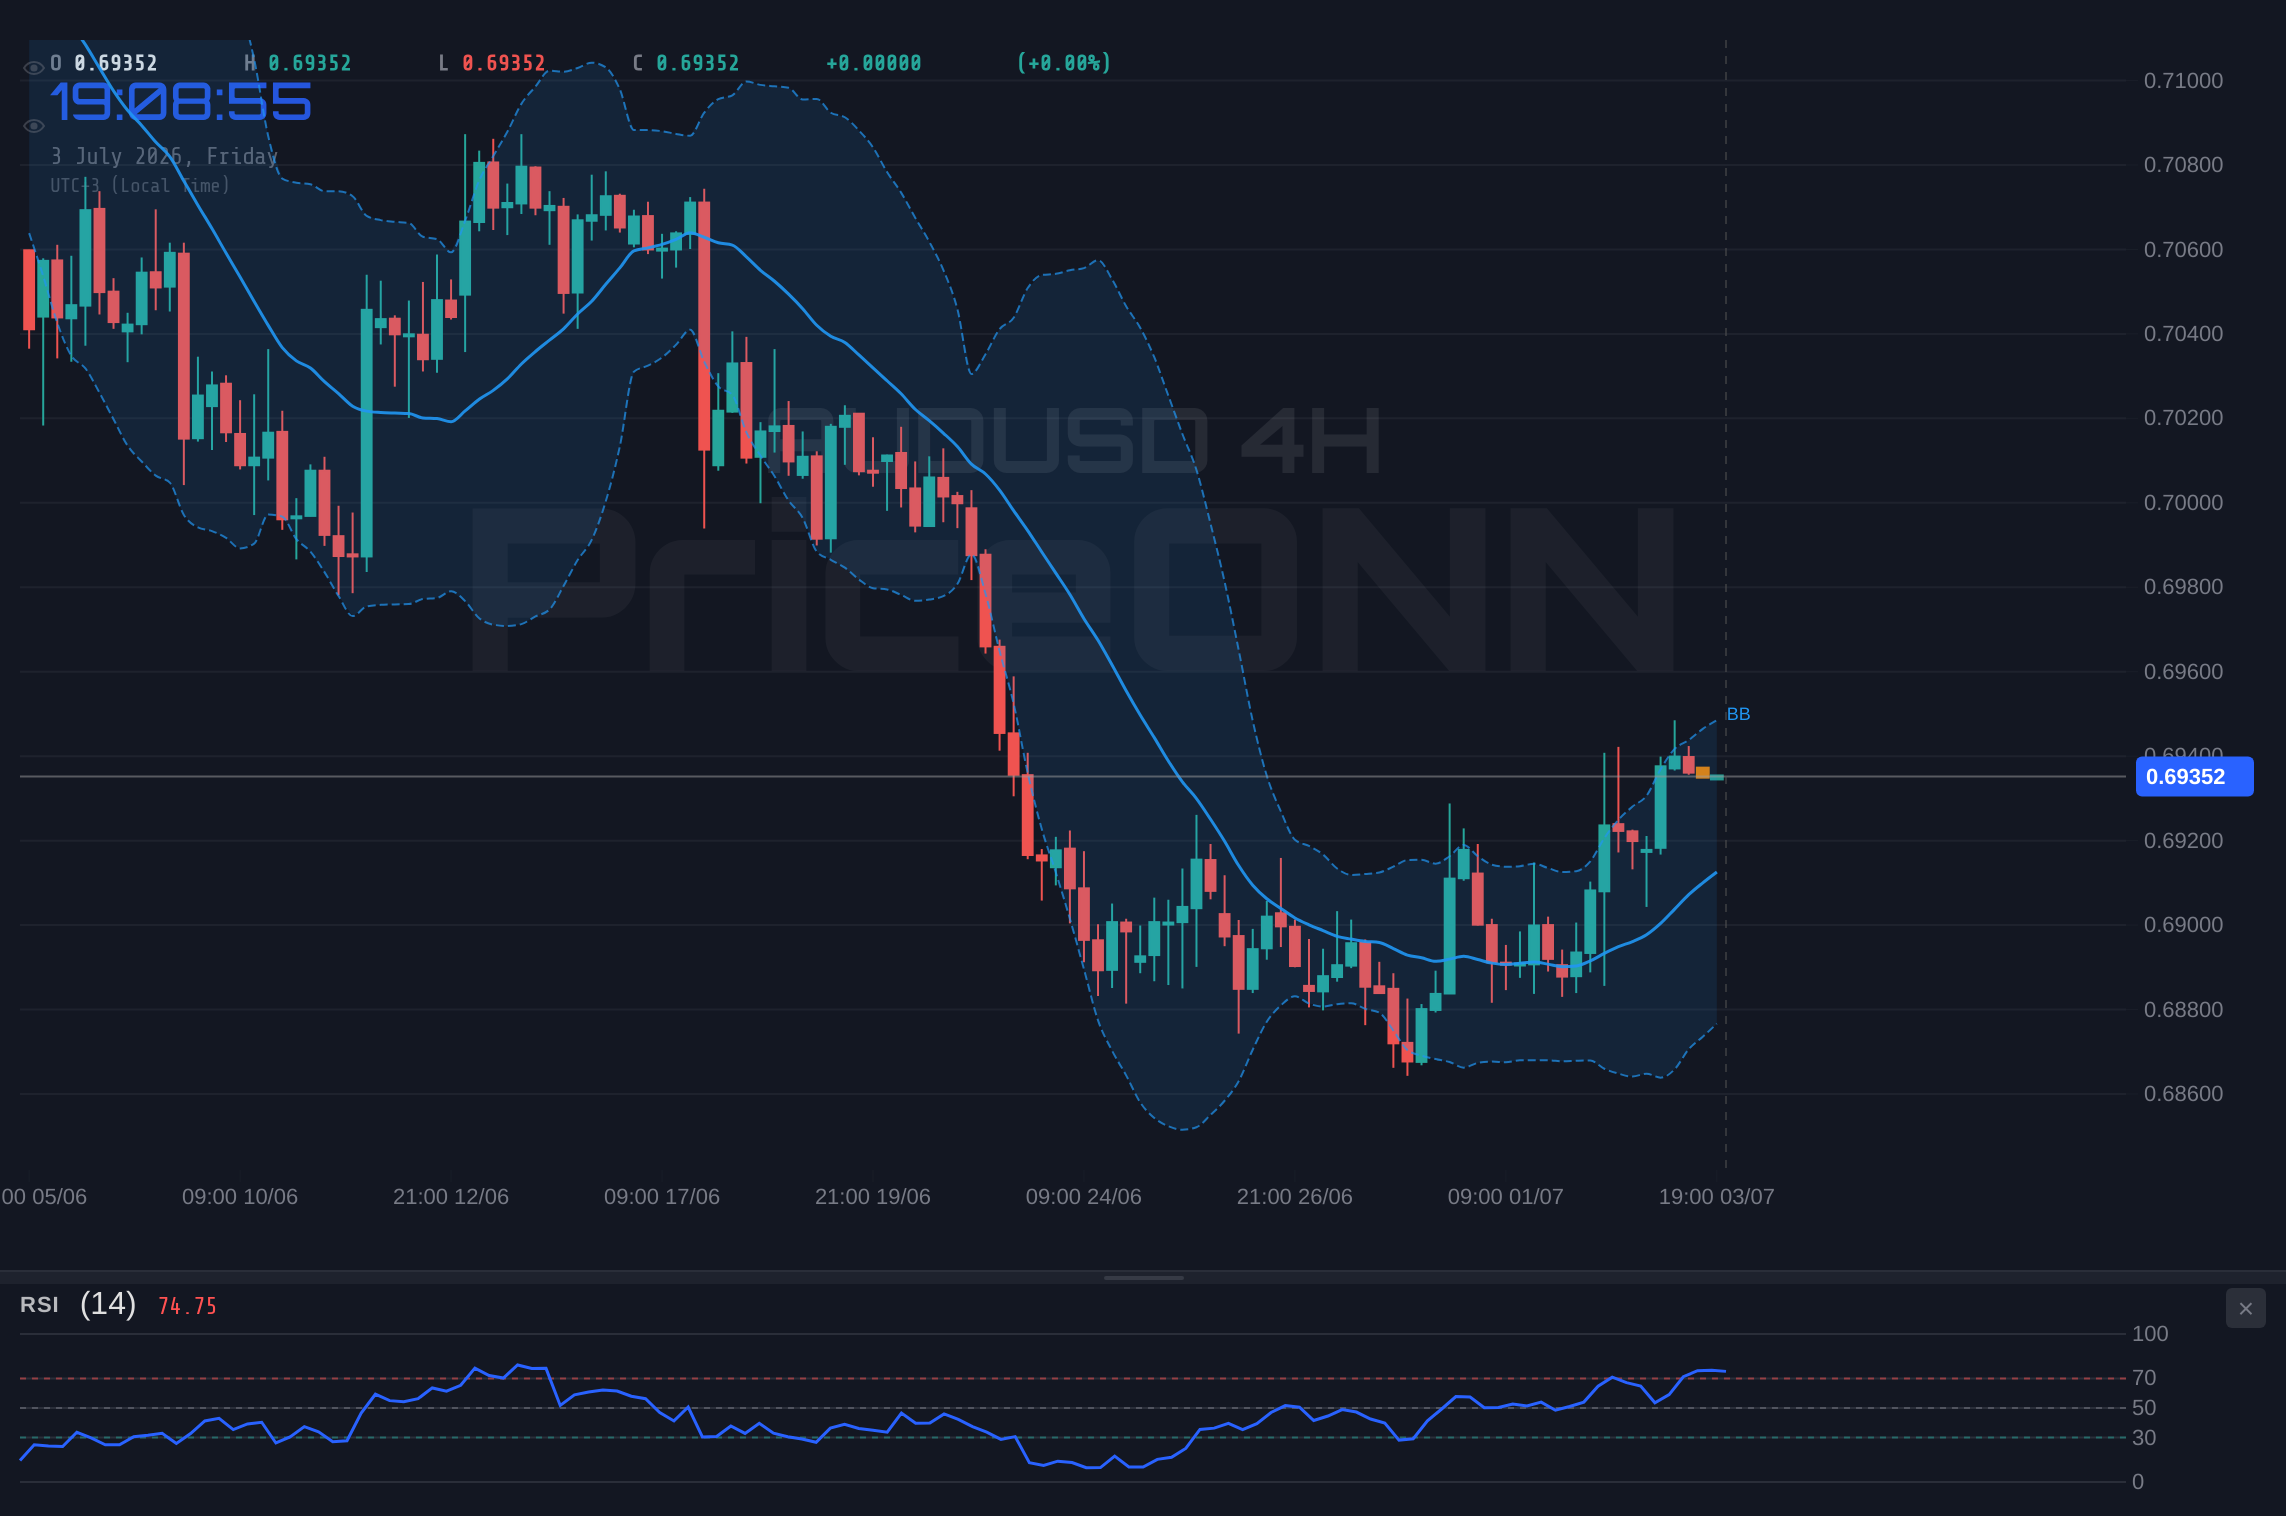
Furthermore, the ADX indicator, a measure of trend strength, is showing a reading of 19.06 on the 1-hour chart and 24.68 on the 4-hour chart. While the 1-hour ADX might suggest a weaker trend, the 4-hour reading is firmly above 20, indicating a nascent to moderate uptrend is in play. This aligns with the overall 'Yükseliş' (Uptrend) direction noted for the 4-hour timeframe. The Bollinger Bands on the 1-hour chart are also positioned above the middle band, reinforcing the idea of upward price pressure. This technical picture, taken in isolation, suggests that a breach of the immediate resistance could open the door for further gains, potentially targeting higher levels.
The narrative for the bulls also finds some support in broader market sentiment, albeit cautiously. News indicates that Dow Jones futures are climbing, and S&P 500 futures are also on the rise, suggesting a generally positive risk appetite in the equity markets. While this doesn't directly translate to AUDUSD strength, a risk-on environment often sees commodity currencies like the Australian Dollar find favor. The news also mentions cooling US labor market data weighing on the US Dollar, which, if true, would provide a tailwind for pairs like AUDUSD. A weaker dollar generally correlates with higher prices for assets like AUDUSD, as the pair is priced against the greenback. This confluence of short-term technical strength and a potentially weakening dollar creates a compelling argument for the bullish camp.
The Bearish Counter-Argument: Daily Divergence and Dollar Strength
However, the picture isn't entirely rosy for the AUDUSD bulls. When we shift our gaze to the daily timeframe, the narrative takes a significant turn. The RSI(14) on the daily chart stands at 40.53, indicating a downward eğilimi (trend). This is a stark contrast to the bullish leanings on the shorter timeframes and suggests that the longer-term trend might be preparing to reassert itself. The MACD on the daily chart also shows negative momentum, with the MACD line below the signal line, reinforcing the bearish sentiment. The Bollinger Bands are hugging the lower side of the middle band, further supporting the notion of downward pressure.
The ADX on the daily timeframe is a significant point of concern for the bulls. At 39.54, it indicates a strong downtrend is in force. This contradicts the moderate trend strength seen on the 4-hour chart and suggests that the current upward move might be nothing more than a correction within a larger bearish structure. The overall signal for the daily chart is 'SAT' (SELL), with 6 'SELL' signals against only 2 'BUY' signals. This divergence between the short-term bullish signals and the long-term bearish signals is where the real trading tension lies. It suggests that the current price action might be unsustainable in the broader context.
Crucially, the DXY (Dollar Index) is showing a 'Yükseliş' (Uptrend) direction on its 1-hour and 1-day charts, currently trading at 100.86. While its 4-hour trend is noted as 'Düşüş' (Down), the overall strength indicated by the ADX on the daily chart (39.37) suggests the dollar might be poised for a resurgence. News reports also mention the US Dollar holding losses ahead of US NFP data, but the fact that it's holding losses rather than collapsing implies underlying resilience. If the dollar index strengthens, it typically puts pressure on currency pairs like AUDUSD, acting as a significant headwind for any bullish aspirations. The potential for a stronger dollar, coupled with the bearish daily technicals, forms the core of the bear argument.
The resistance levels on the daily chart are also quite telling. With key resistance points at $0.69471, $0.69742, and $0.70063, the current price of $0.69363 is sitting right at the doorstep of a significant supply zone. The fact that the pair has approached this area on the 4-hour chart with Stochastic in the overbought zone (K=86.63, D=85.65) hints that any push above $0.69467 might be met with strong selling pressure. This confluence of technical indicators on the daily chart, combined with the psychological significance of approaching resistance, paints a picture of a potential reversal or at least a significant pullback.
Navigating the Crossroads: Scenarios and Probabilities
Given the conflicting signals across different timeframes and indicators, a clear strategy involves mapping out potential scenarios. The market is at a critical juncture, and the upcoming price action will likely be driven by which set of signals ultimately prevails – the short-term bullish momentum or the longer-term bearish divergence.
Bearish Reversal: The Daily Chart Dominates
65% ProbabilityConsolidation: Range-Bound Action
25% ProbabilityBullish Breakout: Short-Term Strength Prevails
10% ProbabilityThe higher probability scenario, at 65%, leans towards a bearish reversal. This is driven by the strong downtrend signals on the daily chart (ADX 39.54, RSI 40.53) and the proximity to significant resistance levels ($0.69471, $0.69742). Should the bulls fail to overcome the $0.69467 hurdle, expect a move back towards the $0.69229 support on the 4-hour chart, and potentially lower towards the $0.68879 daily support. The invalidation for this bearish thesis would be a convincing daily close above the $0.69742 resistance level.
A neutral scenario, representing a consolidation phase, carries a 25% probability. This would involve AUDUSD trading within a tighter range, likely between the immediate 4-hour support at $0.69229 and the 4-hour resistance at $0.69467. In this case, the market would be digesting the conflicting signals, awaiting a clearer catalyst. The current price of $0.69363 would serve as a pivot, with movement towards either the support or resistance levels indicating the next likely direction. This consolidation would be invalidated if price decisively breaks either boundary, shifting the probabilities towards the bullish or bearish scenarios.
The bullish breakout scenario, while currently holding a lower probability of 10%, cannot be entirely discounted. For this to materialize, we would need to see a strong surge in buying volume that pushes AUDUSD decisively above the $0.69467 resistance. This would need to be sustained, with confirmation from shorter-term indicators and potentially a shift in the daily chart's outlook. The invalidation for this scenario would be swift: a failure to hold above $0.69363 and a subsequent fall back below the $0.69229 support level. If this bullish breakout were to occur, the immediate targets would be the 4-hour resistance at $0.69536, followed by the daily resistance at $0.69742.
The Verdict: Caution is Key
So, where does this leave us? The AUDUSD is at a critical juncture, caught between the short-term bullish momentum and the more potent bearish signals on the daily chart. The ADX readings suggest a trend is present, but the divergence between timeframes is the key takeaway. The 4-hour chart shows a strong uptrend (ADX 24.68), while the daily chart indicates a strong downtrend (ADX 39.54). This is a classic setup for potential whipsaws if not approached with caution. The RSI at 67.3 on the 1-hour chart suggests some room to run, but the 40.53 RSI on the daily chart is a red flag for any sustained upside.
The correlation with the DXY, currently at 100.86 and showing strength on its daily chart, cannot be ignored. A strengthening dollar is a direct impediment to AUDUSD's upward potential. News regarding US labor data potentially weighing on the dollar is a factor, but the overall resilience of the dollar, as suggested by its ADX, implies it might be able to absorb negative data. The immediate resistance zone around $0.69467 to $0.69536 is where the battle will be decided in the short term. A failure here, given the daily chart's bearish leanings, makes a move back towards the $0.69229 support level the more probable outcome.
For traders, this is a situation that demands patience and strict risk management. Chasing the current price action without clear confirmation from the higher timeframes or a decisive break of key levels would be imprudent. The 65% probability assigned to the bearish reversal scenario underscores the need for caution. While the short-term charts might offer a glimmer of hope for the bulls, the weight of evidence from the daily perspective points towards potential downside. Waiting for a clear break above daily resistance ($0.69742) for a bullish confirmation, or a decisive break below 4-hour support ($0.69229) to confirm the bearish view, is the most prudent approach.
Technical Snapshot: AUDUSD Indicators
| Indicator | Value | Signal | Interpretation |
|---|---|---|---|
| RSI (14) | 67.3 | Neutral | Approaching overbought on 1H, but daily is at 40.53 |
| MACD Histogram | +0.0016 | Bullish | Positive momentum on 4H, but negative on 1H |
| Stochastic (%K/%D) | 86.63 / 85.65 | Bearish | Overbought on 4H, indicating potential pullback |
| ADX | 24.68 | Moderate Trend | Strong trend on daily (39.54), weak on 1H (19.06) |
| Bollinger Bands | Upper Band | Watch | Price near upper band on 1H/4H, mid-band on 1D |
Frequently Asked Questions: AUDUSD Analysis
What happens if AUDUSD breaks above the $0.69467 resistance level?
A decisive break above $0.69467, especially with strong volume, would invalidate the immediate bearish outlook. The next resistance target would be $0.69536 on the 4-hour chart, followed by $0.69742 on the daily chart, potentially signaling a shift towards a more sustained bullish move.
Should I buy AUDUSD at current levels of $0.69363 given the mixed signals?
Buying at current levels of $0.69363 is speculative due to conflicting signals. The higher probability favors a pullback. A safer approach would be to wait for confirmation: either a break above $0.69467 with follow-through or a clear break below $0.69229 support, which would then offer a potential shorting opportunity.
Is the RSI at 67.3 a sell signal for AUDUSD right now?
An RSI of 67.3 on the 1-hour chart is approaching overbought territory but not yet a definitive sell signal. However, when considered alongside the daily RSI of 40.53 showing a downward trend, it suggests that any further upward momentum might be limited and a pullback is more likely than a strong continuation.
How will the upcoming US Non-Farm Payrolls (NFP) data affect AUDUSD this week?
Stronger-than-expected NFP data could boost the US Dollar, putting downward pressure on AUDUSD and reinforcing the bearish daily outlook. Conversely, weaker data might weaken the dollar, potentially allowing the short-term bullish momentum to push AUDUSD towards its resistance levels, though the daily downtrend remains a significant factor.
The AUDUSD pair stands at a critical crossroads, with the current price of $0.69363 acting as a focal point for a tug-of-war between bullish short-term momentum and bearish daily divergence. While the 1-hour and 4-hour charts flirt with resistance and suggest upward potential, the daily chart's strong downtrend indicators, coupled with a resilient DXY, present a compelling case for caution. The most probable scenario points towards a potential pullback, as the market digests these conflicting signals and awaits clearer direction, possibly influenced by upcoming economic data. Patience and a disciplined approach, waiting for a confirmed break of key levels, will be the trader's best ally in navigating this uncertain territory.
Track markets in real-time
AI-powered analysis, technical indicators and real-time price data.
Join Our Telegram Channel
Breaking market news, AI analysis and trading signals instantly.
Join Channel