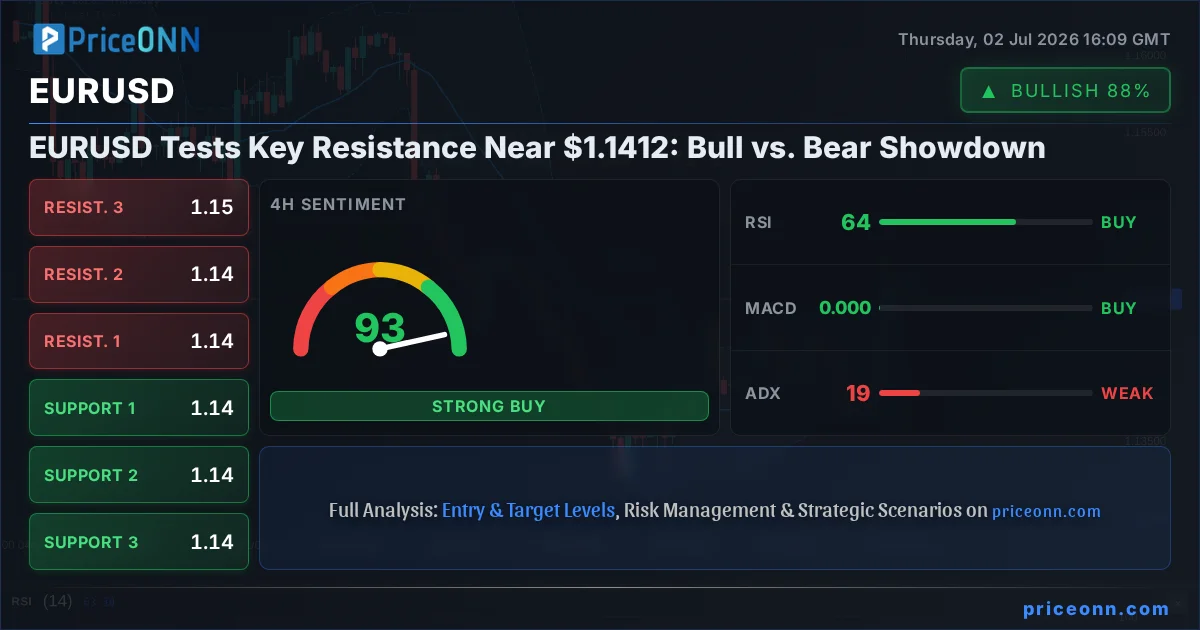
The EURUSD pair is currently locked in a fierce tug-of-war, consolidating near the crucial resistance level of $1.1412. This pivotal zone represents a battleground where bulls and bears are fighting for control, with market sentiment hanging in the balance. Traders are closely watching for any decisive move, as the current technical readings present a complex picture, demanding careful interpretation rather than a simple directional bet. This analysis delves into the heart of this tension, exploring the arguments for both sides and what it means for the path ahead.
- EURUSD is testing resistance around $1.1412, with RSI at 69.94 signaling overbought pressure on the 1H chart.
- Critical support for EURUSD is identified at $1.1407 (1H) and $1.1393 (4H), while resistance looms at $1.1456 (1H) and $1.1472 (4H).
- MACD on the 1H and 4H charts shows positive momentum, but Stochastic's %K
- The DXY index is currently at 100.79, showing a downward trend on the 1H and 4H charts, which typically supports EURUSD.
- Upcoming NFP data is a major catalyst, with the economy adding only 57,000 jobs in June, below expectations, potentially influencing Fed policy and EURUSD direction.
The Bulls' Offensive: Momentum and Macro Tailwinds
On the bullish front, the 1-hour (1H) and 4-hour (4H) charts paint a picture of upward momentum. The EURUSD pair has been on an upward trajectory, currently trading at $1.14421, an increase of 0.58% for the day. This climb is supported by positive MACD readings across these shorter timeframes, indicating that buying pressure is currently outweighing selling pressure. The MACD histogram remains above the signal line, a classic sign of strengthening bullish momentum. Furthermore, the ADX indicator on the 1H chart stands at a robust 33.06, confirming a strong uptrend. This suggests that the current move has underlying strength, potentially pushing the pair higher.
Adding to the bullish argument is the behavior of the US Dollar Index (DXY). With the DXY currently trading at 100.79 and showing a downward trend on both the 1H and 4H charts, it suggests a weakening dollar. Historically, a weaker dollar often correlates with a stronger EURUSD pair. The DXY's dip below its mid-Bollinger Band on the 4H chart, coupled with a negative MACD, reinforces the idea that dollar weakness could be a significant tailwind for the Euro. This correlation is a crucial element for bulls, as it implies that external market forces are currently aligned in their favor, creating a more favorable environment for Euro strength against the greenback.
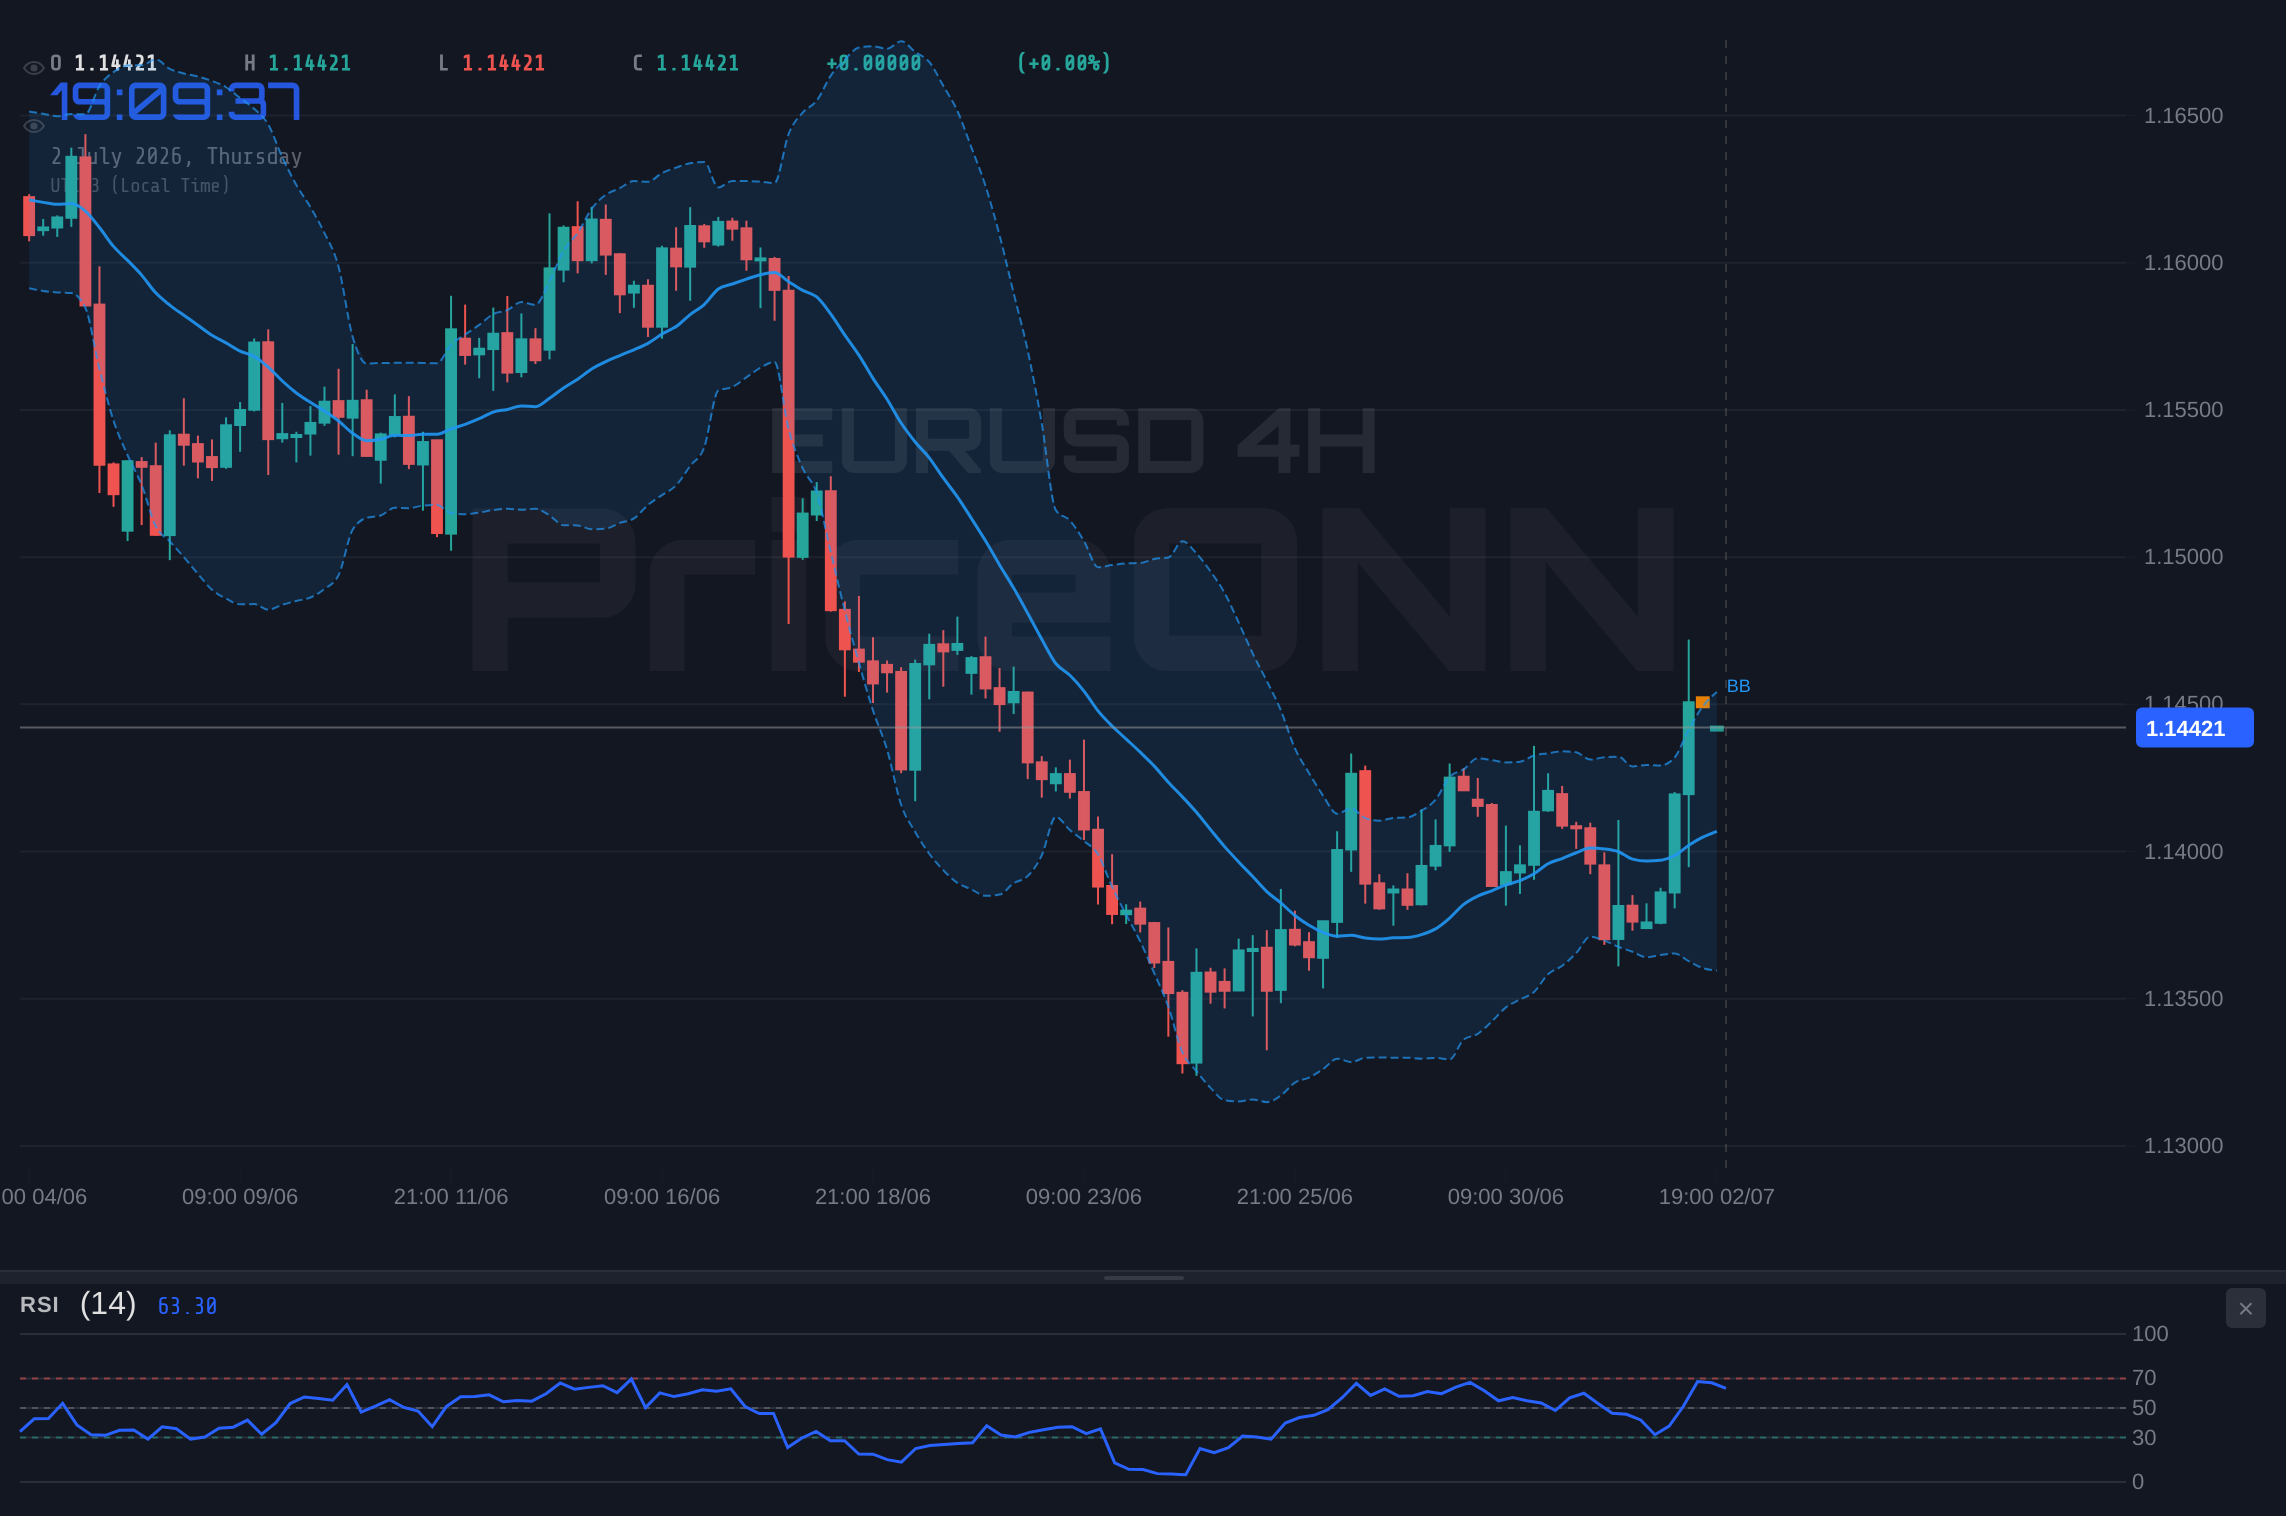
The RSI(14) on the 1H and 4H charts, while approaching overbought territory at 69.94 and 64.06 respectively, still shows room for upward movement before hitting extreme levels. This suggests that while the pair might be getting a bit extended in the short term, there isn't immediate pressure for a sharp reversal. The Stochastic indicator on the 4H chart, with %K at 71.45 and %D at 34.49, also supports a bullish continuation, showing a clear upward signal. The fact that the price is trading above the middle Bollinger Band on these timeframes further bolsters the case for continued upside, indicating that the bulls are currently in command of the intraday action.
The Bears' Counter-Attack: Overbought Signals and Daily Divergence
However, the picture is far from one-sided. When we shift our focus to the daily (1D) timeframe, the bullish narrative begins to fray. The EURUSD's daily chart presents a starkly different scenario, with the RSI(14) at 43.56 showing a downward trend. This divergence between shorter-term momentum and the longer-term trend is a significant warning sign for bulls. It suggests that the recent upward move might be losing steam and could be vulnerable to a reversal. The MACD on the daily chart indicates that momentum is balancing, and while not yet bearish, it lacks the conviction seen on the lower timeframes.
Adding to the bears' arsenal are the overbought conditions appearing on the 1H Stochastic oscillator. With %K at 70.72 and %D at 72.96, the %K is now below the %D, suggesting a potential bearish cross and a pullback. While this is a short-term signal, it aligns with the general caution warranted when prices approach resistance levels. The fact that the pair is testing a key resistance zone near $1.1412, with immediate resistance identified at $1.1456 and $1.1472 on the 1H chart, means that any upward move could face significant selling pressure. Bears are likely positioned around these levels, looking to defend them and push the price lower.
Moreover, the ADX on the daily chart, at 34.62, indicates a strong downtrend, contradicting the bullish signals from the 1H and 4H ADX values. This conflict between timeframes is a classic sign of market indecision and potential trend exhaustion. The Bollinger Bands on the daily chart are also positioned below the middle band, suggesting a bearish bias in the longer term. Bears are likely anticipating a failure to break through the current resistance, leading to a test of the support levels identified at $1.14316 on the 1H and $1.13933 on the 4H. A decisive break below these could trigger further downside.
The Technical Tightrope: Navigating Conflicting Signals
The core of the current EURUSD situation lies in the conflicting signals across different timeframes. On the 1H and 4H charts, the trend appears bullish, supported by positive MACD and ADX readings, and the weakening DXY. However, the daily chart paints a more cautious, potentially bearish picture with its own set of diverging indicators. This technical dichotomy creates a 'WATCH_ZONE' scenario, where a clear directional setup is not yet firmly established. The market is essentially caught between two opposing forces, making it a risky environment for aggressive trades.
The key level to watch is undoubtedly the resistance zone around $1.1412. A sustained close above this, particularly on the daily chart, would lend significant credibility to the bullish case and potentially invalidate the bearish divergence. Conversely, a failure to break this resistance, coupled with a drop below the immediate 1H support at $1.14316, could signal a reversal. The Stochastic crossover on the 1H chart, while a short-term signal, could be the first indication of a bearish shift if it leads to a price pullback. The strength of the trend indicated by the ADX values (strong uptrend on 1H/4H, strong downtrend on 1D) highlights the internal conflict within the market's structure.
The recent economic news also adds a layer of complexity. The US economy added only 57,000 jobs in June, significantly below the expected 115,000, and the unemployment rate held steady at 4.2%. This softer-than-expected data could lead to a reassessment of Federal Reserve policy expectations, potentially weakening the dollar further and supporting EURUSD. However, market participants might have already priced in some of this slowdown, limiting the immediate upside potential. The reaction to this data will be crucial in determining whether the short-term bullish signals can overcome the longer-term bearish divergence.
The Verdict: A Precarious Balance Requiring Confirmation
Given the conflicting signals, the current EURUSD setup leans towards a 'WATCH_ZONE' recommendation. While the shorter-term charts show bullish momentum and the weakening DXY provides a potential tailwind, the daily chart's bearish divergence and the approach to significant resistance cannot be ignored. The market is at a critical juncture, and a decisive move is needed to break the current stalemate. For traders, this means exercising patience and waiting for clearer confirmation rather than jumping into a potentially choppy trade.
A valid bullish setup would require a decisive break and sustained price action above the $1.1412 resistance, ideally confirmed by a daily close above this level. This would invalidate the bearish divergence and open the door for tests of higher resistance levels like $1.14562 and potentially $1.14723. On the flip side, a bearish scenario would be confirmed by a failure to break $1.1412 and a subsequent close below the 1H support at $1.14316, potentially targeting the 4H support at $1.13933. The outcome of upcoming economic data, particularly any further clues on Fed policy, will be instrumental in resolving this current technical tension.
The fight at $1.1412 is more than just a price level; it's a reflection of fundamental uncertainties and conflicting technical trends. Until a clearer picture emerges, risk management should be paramount. Traders should look for setups that offer a favorable risk-reward ratio, ideally waiting for price action to confirm a direction before committing significant capital. The market is currently indecisive, and forcing a trade here could lead to unnecessary losses. Patience and a data-driven approach will be the keys to navigating this complex EURUSD environment.
Bearish Scenario: Resistance Holds Firm
65% ProbabilityNeutral Scenario: Consolidation Near Resistance
25% ProbabilityBullish Scenario: Breakout Above Resistance
10% ProbabilityFrequently Asked Questions: EURUSD Analysis
What happens if EURUSD breaks decisively above $1.14562 resistance?
A sustained move above $1.14562, especially confirmed by a daily close, would invalidate the current bearish divergence and suggest a bullish continuation. This could pave the way for price targets near $1.14723, aligning with the positive momentum seen on shorter timeframes.
Should I buy EURUSD at current levels near $1.14421, given the mixed signals?
Buying at current levels carries significant risk due to the resistance at $1.1412 and conflicting daily chart signals. A more prudent approach would be to wait for a clear breakout above resistance or a confirmed pullback to support levels like $1.14316, offering a better risk-reward setup.
Is the RSI at 69.94 on the 1H chart a sell signal for EURUSD?
An RSI of 69.94 indicates strong upward momentum but is not yet in extreme overbought territory. While it suggests caution and potential for a short-term pullback, it's not a direct sell signal on its own. Confirmation from price action or other indicators, like a Stochastic crossover, would be needed.
How will the weaker US NFP data (57,000 jobs) affect EURUSD this week?
The weaker-than-expected NFP data could pressure the US Dollar, potentially supporting EURUSD. However, markets may have already priced this in. If the Fed signals a dovish shift due to this data, it could fuel further gains for EURUSD, but confirmation from Fed commentary is key.
Technical Outlook Summary
| Indicator | Value | Signal | Interpretation |
|---|---|---|---|
| RSI (14) | 69.94 (1H) | Neutral | Approaching overbought on 1H, but still room on 4H. Daily shows downward trend. |
| MACD Histogram | Positive (1H/4H) | Bullish | Positive momentum on shorter timeframes, balancing on daily. |
| Stochastic | K=70.72, D=72.96 (1H) | Bearish Cross | Potential short-term pullback signal on 1H chart. |
| ADX | 33.06 (1H), 34.62 (1D) | Strong Trend | Conflicting trend strength signals across timeframes. |
| Bollinger | Middle Band Break (1H/4H) | Bullish | Price above middle band on shorter timeframes, below on daily. |
Key Levels
Track markets in real-time
AI-powered analysis, technical indicators and real-time price data.
Join Our Telegram Channel
Breaking market news, AI analysis and trading signals instantly.
Join Channel