
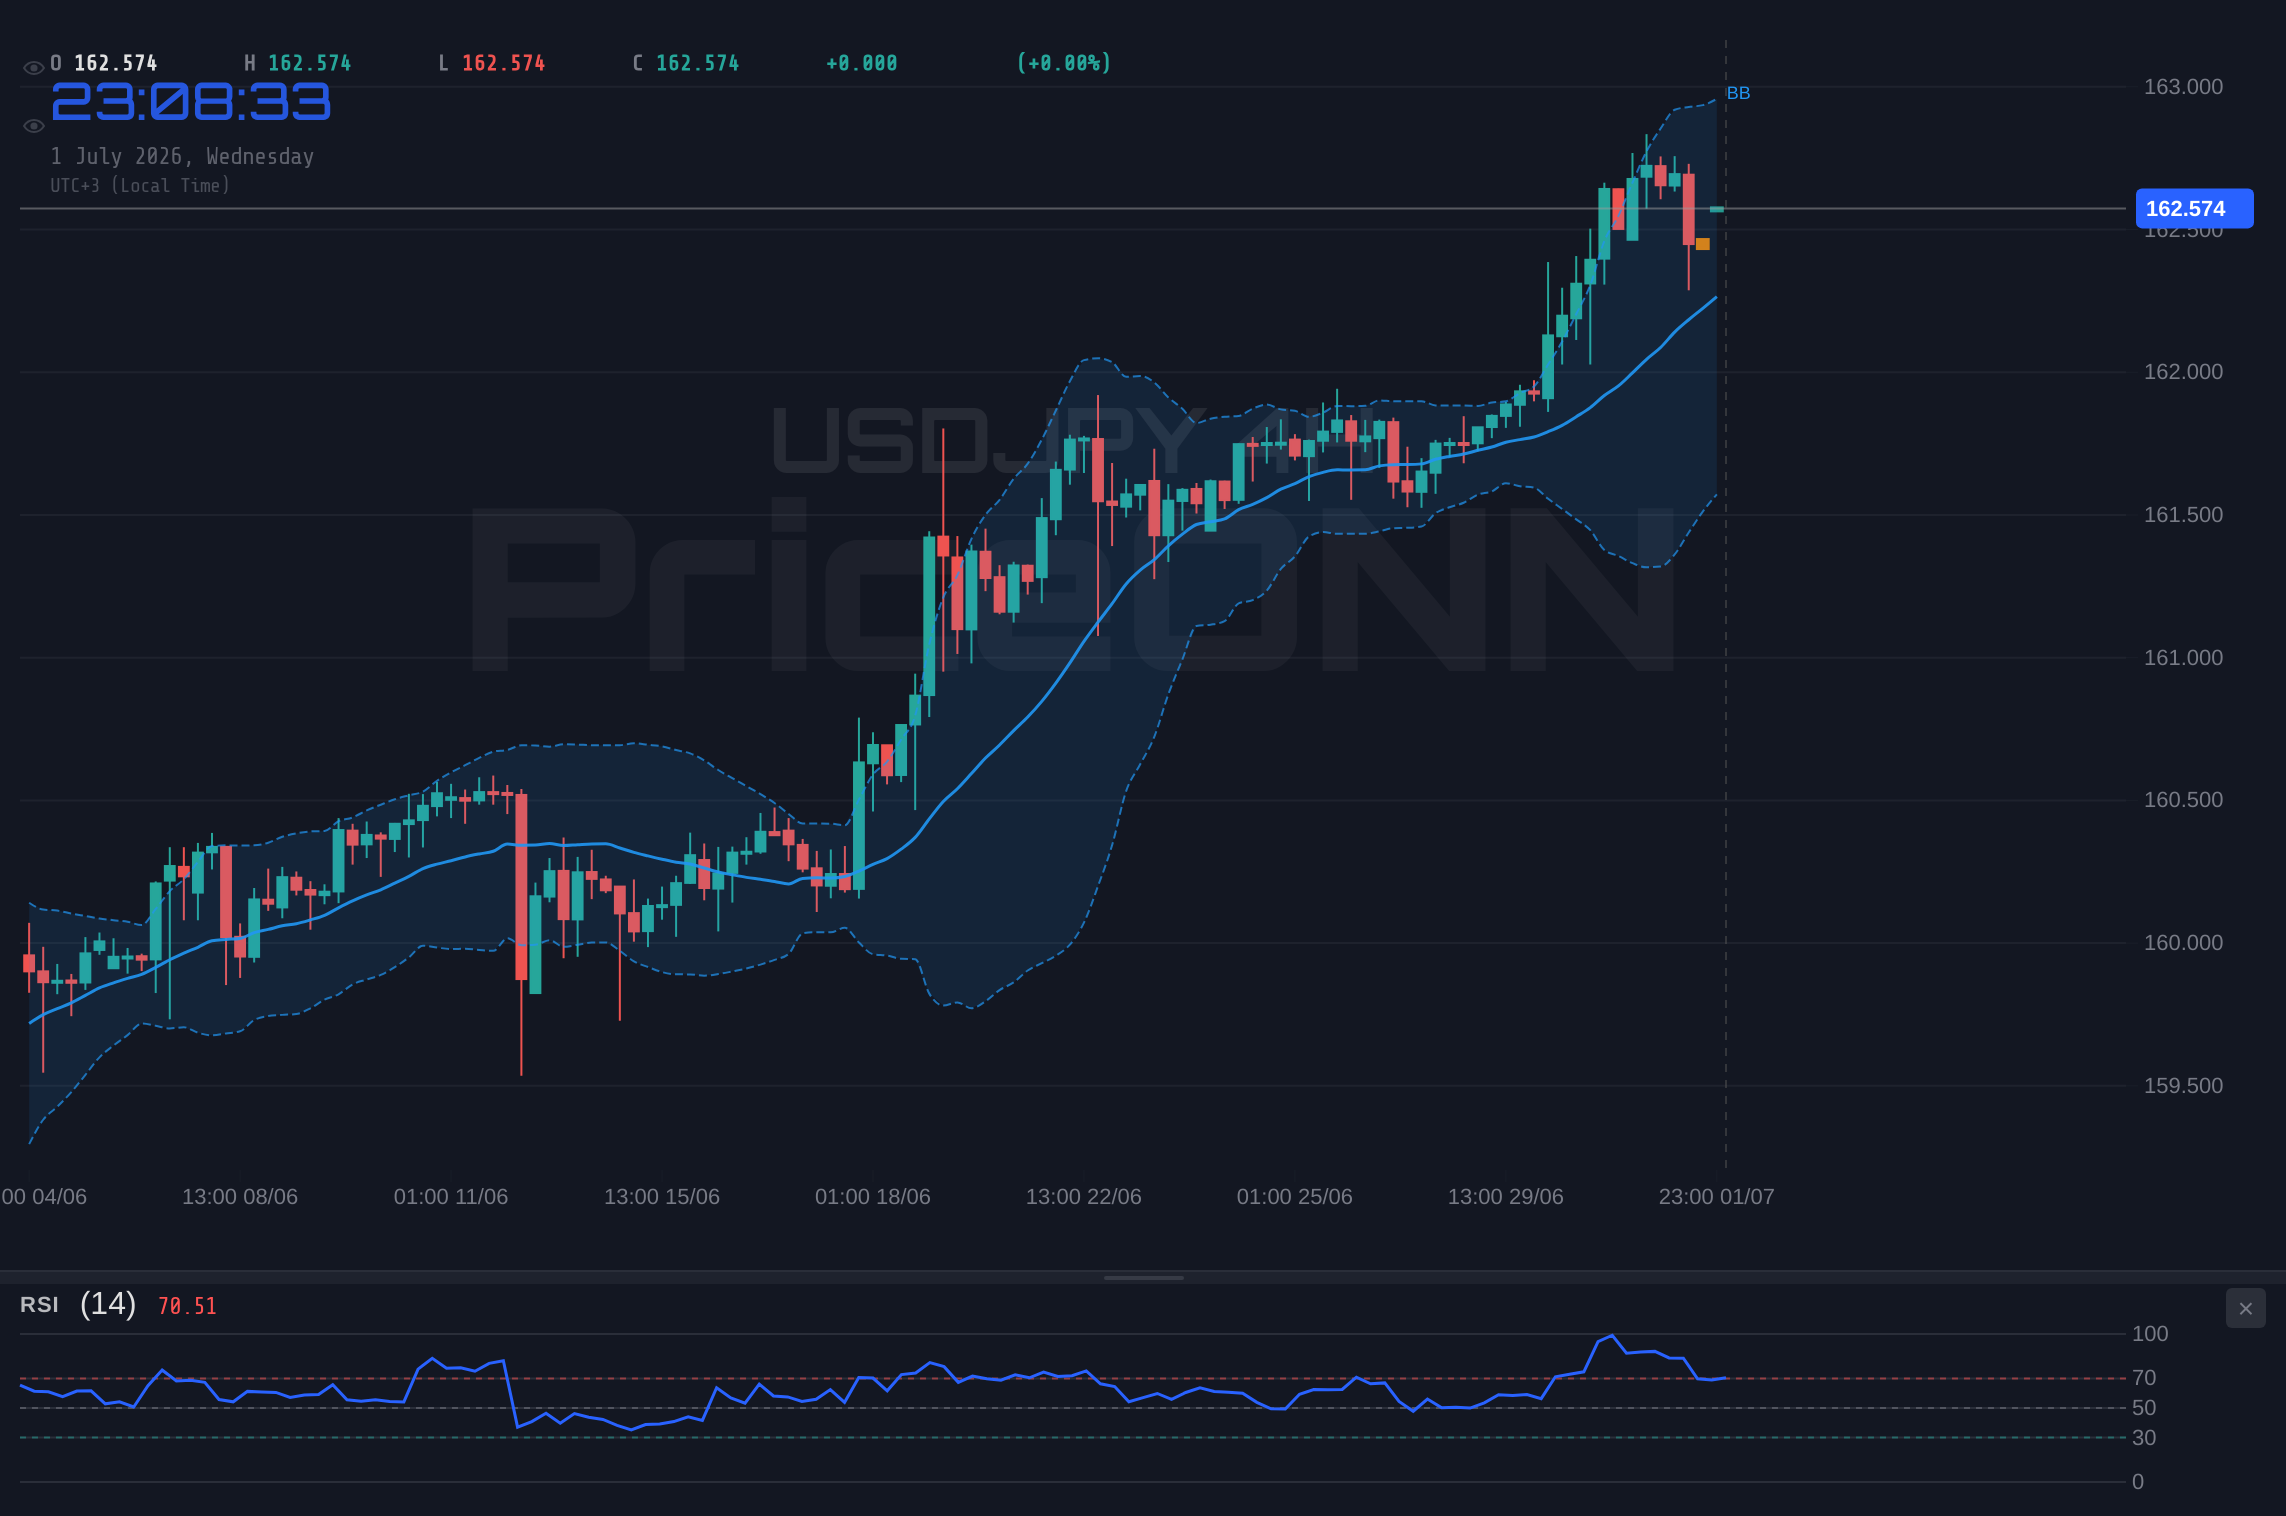
The relentless advance of USDJPY has brought the pair to a pivotal point, currently trading at precisely $162.57. This level isn't just another number; it represents a crucial resistance zone that market participants are watching with bated breath. The question on everyone's mind is whether the bulls have the strength to push through this barrier, or if the yen's recent resilience will trigger a significant pullback. Several key factors, from the U.S. Dollar Index's (DXY) momentum to the Bank of Japan's (BOJ) policy stance and upcoming macroeconomic data, are set to play a decisive role in shaping the pair's short-to-medium term direction. This analysis delves into the multi-faceted landscape surrounding USDJPY, exploring the most probable scenarios and the critical triggers that traders should be monitoring.
- USDJPY is currently testing resistance at $162.57, a critical level for trend determination.
- The DXY's upward momentum to 101.42 provides underlying support for USDJPY, while strong ADX readings on the daily chart indicate a robust trend is in play.
- Conflicting signals exist: Daily RSI at 77.76 suggests overbought conditions, yet 4-hour MACD shows positive momentum, creating a complex technical picture.
- Upcoming NFP data and potential Fed policy shifts are key macro drivers that could significantly influence USDJPY's direction this week.
The Bull's Roadmap: Conquering the $162.57 Peak
For USDJPY to continue its upward journey, breaking decisively above the current resistance at $162.57 is paramount. The 1-hour chart shows a general 'BUY' signal, with an RSI of 52.59 and positive MACD momentum, suggesting underlying strength. However, the daily chart paints a more complex picture. While the ADX at 29.47 indicates a strong uptrend, the RSI stands at a lofty 77.76, signaling that the pair is in overbought territory. This divergence is key; a sustained push above $162.57 needs to be accompanied by a cooling RSI or a confirmation from other indicators. If the bulls manage to clear this hurdle, the next significant resistance level to watch would be $162.824, followed by $163.145. A successful breach of these levels could set the stage for a move towards $163.627, potentially re-igniting broader bullish sentiment. The strength of the US dollar, as indicated by the DXY trading at 101.42, is a significant tailwind for this scenario. However, such a move would likely require a catalyst, perhaps softer inflation data from Japan or continued hawkish signals from the Federal Reserve, reinforcing the interest rate differential.
The 4-hour timeframe offers a slightly more encouraging view for the bulls, with a strong 'BUY' signal, RSI at 67.29, and positive MACD momentum. The Stochastic indicator, while showing overbought conditions with K at 76.99 and D at 85.48, is on the verge of a potential crossover, which could signal a brief pause rather than an outright reversal. The ADX at 36.07 reinforces the presence of a strong trend. For this bullish thesis to hold, USDJPY must not only break $162.57 but also hold its ground above it, ideally retesting the level as support. The risk here is that the daily overbought RSI could lead to a sharp correction if buying conviction falters. The market participants are keenly observing the interplay between the Fed's hawkish leanings and the BOJ's ultra-loose policy; any hint of a shift from either central bank could dramatically alter the landscape.
From a fundamental perspective, the ongoing interest rate differential between the US and Japan is the primary driver supporting USDJPY's bullish trend. The Federal Reserve has signaled a more hawkish stance compared to the Bank of Japan, which has maintained its ultra-accommodative monetary policy. This divergence in monetary policy fuels demand for the dollar against the yen, as investors seek higher yields in the US market. Recent news suggests that Fed officials are concerned about persistent inflation, potentially delaying any rate cuts and keeping the dollar firm. This macroeconomic backdrop provides a solid foundation for USDJPY's ascent, making a sustained move above $162.57 a plausible scenario, especially if upcoming economic data, such as the Non-Farm Payrolls (NFP) report, reinforces the Fed's hawkish outlook.
Where Bears Take Control: The $162.57 Wall
The bearish case for USDJPY hinges on the pair's inability to overcome the resistance at $162.57 and the significant overbought signals on the daily timeframe. The daily RSI at 77.76 is a stark warning sign, suggesting that the upward momentum may be unsustainable and a correction is due. Coupled with this, the Stochastic oscillator is also flashing overbought signals. Should USDJPY fail to decisively break and hold above $162.57, a reversal could be triggered. The first line of defense for the bulls, which would become the first target for bears, is the support level at $162.021. A break below this level could accelerate selling pressure, targeting the next support at $161.539. The ADX at 42.26 on the daily chart, while indicating a strong trend, doesn't specify the trend's direction on its own; if momentum shifts, this high ADX value can lead to sharp moves in the direction of the new trend. The bears would be looking for confirmation in the form of a daily close below $162.021, followed by a break of the 4-hour support at $162.632, indicating a loss of bullish conviction.
On the shorter timeframes, the bearish scenario would involve price action failing to sustain moves above $162.57, followed by a decisive breach of the 1-hour support at $162.487. This could initiate a cascade of stop-losses, pushing the price lower towards $162.46 and subsequently $162.417. The general 'SELL' signal on the 1-hour chart, despite some conflicting indicators like the Stochastic's potential crossover, would gain more weight if the price breaks these immediate support levels. The risk here is that the underlying bullish trend, supported by the DXY and interest rate differentials, might be strong enough to absorb minor selling pressure. Therefore, bears need to see a clear break of key intraday levels and sustained downward momentum to gain confidence.
Fundamentally, a bearish turn for USDJPY could be precipitated by several factors. Unexpectedly dovish signals from the Federal Reserve, perhaps hinting at a sooner-than-expected rate cut or a pause in tightening, would reduce the dollar's appeal. Conversely, any indication from the Bank of Japan that they are considering policy normalization, even subtly, could strengthen the yen. Recent news about Goldman Sachs expecting an oil market surplus by 2027 might dampen inflation expectations, potentially influencing Fed policy and, by extension, USDJPY. While this is indirect, a shift in inflation outlook globally could alter rate hike expectations. Furthermore, a significant risk-off event in global markets, perhaps triggered by geopolitical tensions or a sharp decline in equity indices like the S&P 500 or Nasdaq, could lead to a flight to safety, potentially benefiting the yen as a safe-haven currency, despite its typically inverse correlation with risk appetite when driven by yield differentials.
The Waiting Game: Consolidation Around $162.57
A neutral or range-bound scenario is also a distinct possibility, particularly if conflicting signals persist and incoming data fails to provide a clear direction. In this scenario, USDJPY might struggle to break decisively above $162.57, but also find strong buying interest at nearby support levels, such as $162.021 or even the 4-hour support at $162.632. This could lead to a period of consolidation, where the price oscillates within a defined range. The ADX readings across different timeframes (29.47 on daily, 36.07 on 4H, 20.29 on 1H) show varying trend strengths, with the daily and 4-hour indicating strong trends while the 1-hour suggests weakening. This variability can often lead to choppy, range-bound price action.
During consolidation, technical indicators often provide mixed signals. For instance, the daily RSI at 77.76 is overbought, suggesting a potential downside, while the 4-hour Stochastic is showing a potential buy signal. The MACD on the daily chart is positive but on the 1-hour chart it shows negative momentum. This lack of clear directional conviction from indicators can keep the price stuck. Traders might wait for a clearer signal or for price to test the boundaries of this potential range. The DXY's current level of 101.42 and its own mixed signals across timeframes (strong daily uptrend but weaker intraday trend strength) could also contribute to USDJPY's indecision. This phase could last until a significant macroeconomic event or a clear shift in central bank policy provides the necessary impetus for a breakout in either direction.
From a fundamental viewpoint, a consolidation phase could emerge if economic data from both the US and Japan comes in mixed or inline with expectations, providing no clear reason for the Fed or BOJ to alter their current policy paths. For example, if US inflation data is slightly cooler than anticipated but still elevated, and Japanese inflation remains sticky, the interest rate differential might persist but without a dramatic shift that would cause a major USDJPY move. Similarly, if geopolitical risks remain subdued, the safe-haven demand for the yen might not materialize strongly enough to counteract the dollar's yield advantage. In such a scenario, USDJPY could trade sideways, with traders looking for short-term opportunities within the established range, while larger players await a more definitive catalyst.
Probability Assessment: Where the Smart Money Might Be Leaning
Assessing the probability of each scenario requires a careful weighing of the technical and fundamental evidence. The daily chart presents a strong case for caution due to the RSI at 77.76, suggesting that the current rally might be overextended. This significantly increases the probability of a bearish scenario or at least a period of consolidation. However, the persistent strength of the US dollar, evidenced by the DXY at 101.42 and the fundamental driver of interest rate differentials, cannot be ignored. This provides a solid underpinning for the bullish case, especially if upcoming data supports continued hawkishness from the Fed. The ADX readings across timeframes, particularly the strong daily and 4-hour uptrend signals, suggest that underlying momentum is still present, making a sharp, immediate reversal less likely than a gradual pullback or consolidation.
Given the conflicting signals - strong daily overbought RSI versus positive momentum on shorter timeframes and robust fundamental drivers - the most probable scenario in the immediate short term appears to be a period of consolidation or a shallow pullback before any significant directional move. I would assign a 45% probability to a neutral/consolidation scenario, a 35% probability to a bearish scenario (a pullback towards support levels), and a 20% probability to a continued bullish surge breaking above $162.57. The key here is that the bullish scenario requires a strong catalyst, such as a significantly hawkish Fed statement or surprisingly weak Japanese data, to overcome the daily overbought conditions. Without such a catalyst, the path of least resistance might be a correction.
The market sentiment, as reflected in the general signals across timeframes (1H: AL, 4H: AL, 1D: SAT), is mixed but leans towards caution on the daily timeframe due to overbought conditions. The recent news flow, including concerns about oil inventory build-ups and potential Fed policy shifts, adds layers of complexity. While the DXY's strength is supportive of USDJPY, the possibility of cooling inflation expectations could temper the Fed's hawkishness, indirectly affecting USDJPY. Therefore, a cautious approach, waiting for clearer signals or a confirmed break of key levels, seems prudent for most market participants.
Bearish Scenario: The Yen's Resurgence
35% ProbabilityNeutral Scenario: Sideways Action
45% ProbabilityBullish Scenario: Breaking the Ceiling
20% ProbabilityWhat I'm Watching This Week
My focus this week will be on a few key areas that could dictate USDJPY's next move. Firstly, the immediate price action around the $162.57 resistance level is critical. A failure to break through, coupled with increasing selling pressure indicated by a daily RSI above 75 or a clear bearish divergence, would strengthen the case for a pullback. Conversely, a decisive break and hold above $162.57, especially if supported by strong volume and positive follow-through on the 4-hour chart, would signal continued bullish momentum.
Secondly, I'll be closely monitoring the US Dollar Index (DXY) and its trajectory. With the DXY currently at 101.42 and showing strength on the daily chart, any further upside there would continue to support USDJPY. However, if the DXY falters, especially if it breaks below its daily support of 100.99, it could signal a broader dollar weakness that would likely drag USDJPY lower. Finally, the upcoming Non-Farm Payrolls (NFP) report from the US is a major event risk. Stronger-than-expected NFP data would likely reinforce the Fed's hawkish stance, supporting USDJPY. Conversely, a weak NFP report could lead to a reassessment of Fed policy expectations, potentially triggering a downside move in USDJPY.
Frequently Asked Questions: USDJPY Analysis
What happens if USDJPY fails to break above $162.57 resistance?
If USDJPY fails to break and hold above $162.57, a pullback is likely, targeting the support at $162.02. The daily RSI at 77.76 suggests overbought conditions, increasing the probability of a reversal or consolidation around this key resistance level.
Should I consider buying USDJPY at current levels around $162.57 given the daily overbought RSI?
Buying at current levels is risky due to the daily RSI at 77.76 indicating overbought territory. While shorter timeframes show bullish signals, a confirmed break above $162.57 with sustained momentum and cooling RSI would be a stronger buy trigger. Otherwise, waiting for a pullback to support around $162.02 might offer a better risk/reward.
Is the daily RSI at 77.76 a sell signal for USDJPY right now?
An RSI of 77.76 on the daily chart is a strong indicator of overbought conditions, often preceding a price correction or consolidation. While not an immediate sell signal on its own, it suggests that further upside may be limited without significant fundamental catalysts or a cooling of momentum.
How will the upcoming NFP report affect USDJPY this week?
Stronger-than-expected Non-Farm Payrolls data would likely reinforce the Federal Reserve's hawkish stance, potentially pushing USDJPY higher by supporting the dollar. Conversely, weaker-than-expected results could lead to a reassessment of Fed policy, possibly causing USDJPY to pull back from current resistance levels.
Technical Outlook Summary
| Indicator | Value | Signal | Interpretation |
|---|---|---|---|
| RSI (14) | 77.76 | Overbought | Daily RSI at 77.76 indicates potential for a pullback or consolidation. |
| MACD Histogram | +0.064 | Positive Momentum | Daily MACD shows positive momentum, supporting the uptrend. |
| Stochastic | K:91.73, D:91.08 | Overbought | Daily Stochastic is in extreme overbought territory, signaling caution. |
| ADX | 42.26 | Strong Trend | Daily ADX at 42.26 confirms a strong trend, direction needs confirmation. |
| Bollinger | Upper Band | Watch | Price is above the middle band, indicating bullish leanings on daily. |
Key Levels
Track markets in real-time
AI-powered analysis, technical indicators and real-time price data.
Join Our Telegram Channel
Breaking market news, AI analysis and trading signals instantly.
Join Channel