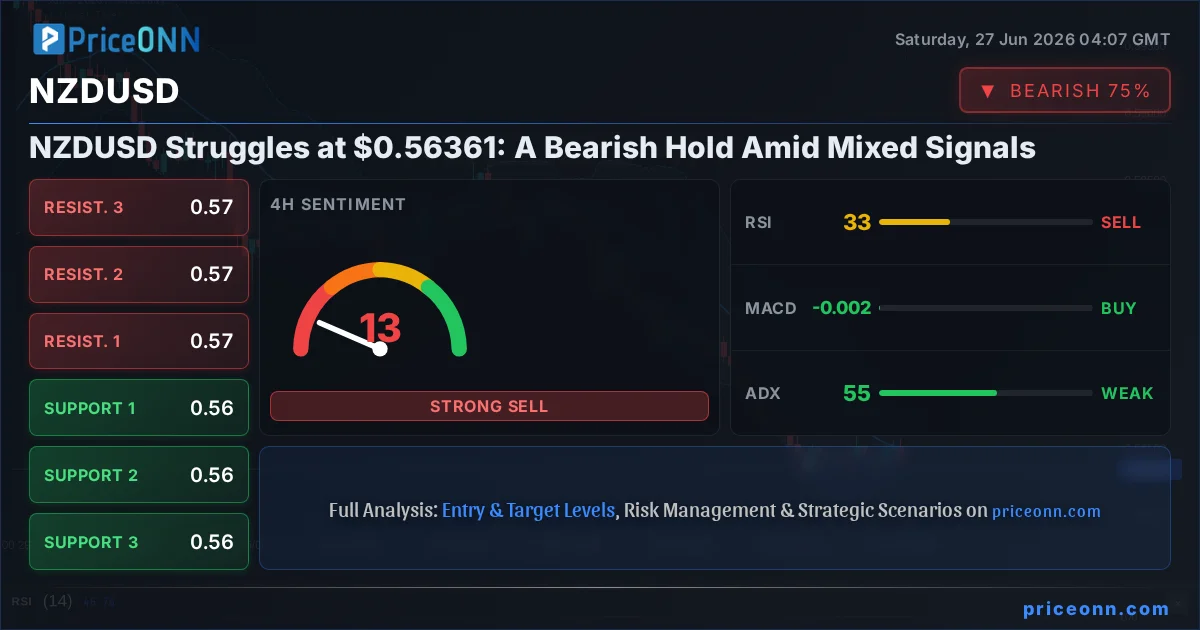
The New Zealand Dollar (NZDUSD) finds itself at a critical juncture, trading at $0.56361 as the market grapples with conflicting technical signals and evolving macroeconomic narratives. This week's price action has solidified a bearish undertone, with the pair testing key support levels and showing little conviction for a sustained recovery. The question on many traders' minds is whether this current hold at $0.56361 is merely a pause before further declines, or if it presents a fleeting opportunity for a counter-trend rally. Understanding the interplay between the broader US Dollar strength, the Reserve Bank of New Zealand's (RBNZ) policy outlook, and the prevailing risk sentiment is paramount for navigating this complex trading environment.
- NZDUSD is currently trading at $0.56361, testing significant support zones.
- Daily RSI at 31.55 suggests oversold conditions, but the ADX at 34.29 indicates a strong downward trend remains in force.
- Key support levels are identified at $0.56303, $0.56152, and $0.56002, while resistance looms at $0.56604, $0.56754, and $0.56905.
- The prevailing bearish trend, coupled with a strong US Dollar Index (DXY) at 101.38, suggests further downside potential for NZDUSD in the short term.
The Bearish Grip Tightens: Technical Indicators Paint a Grim Picture
Navigating the Downtrend on Multiple Timeframes
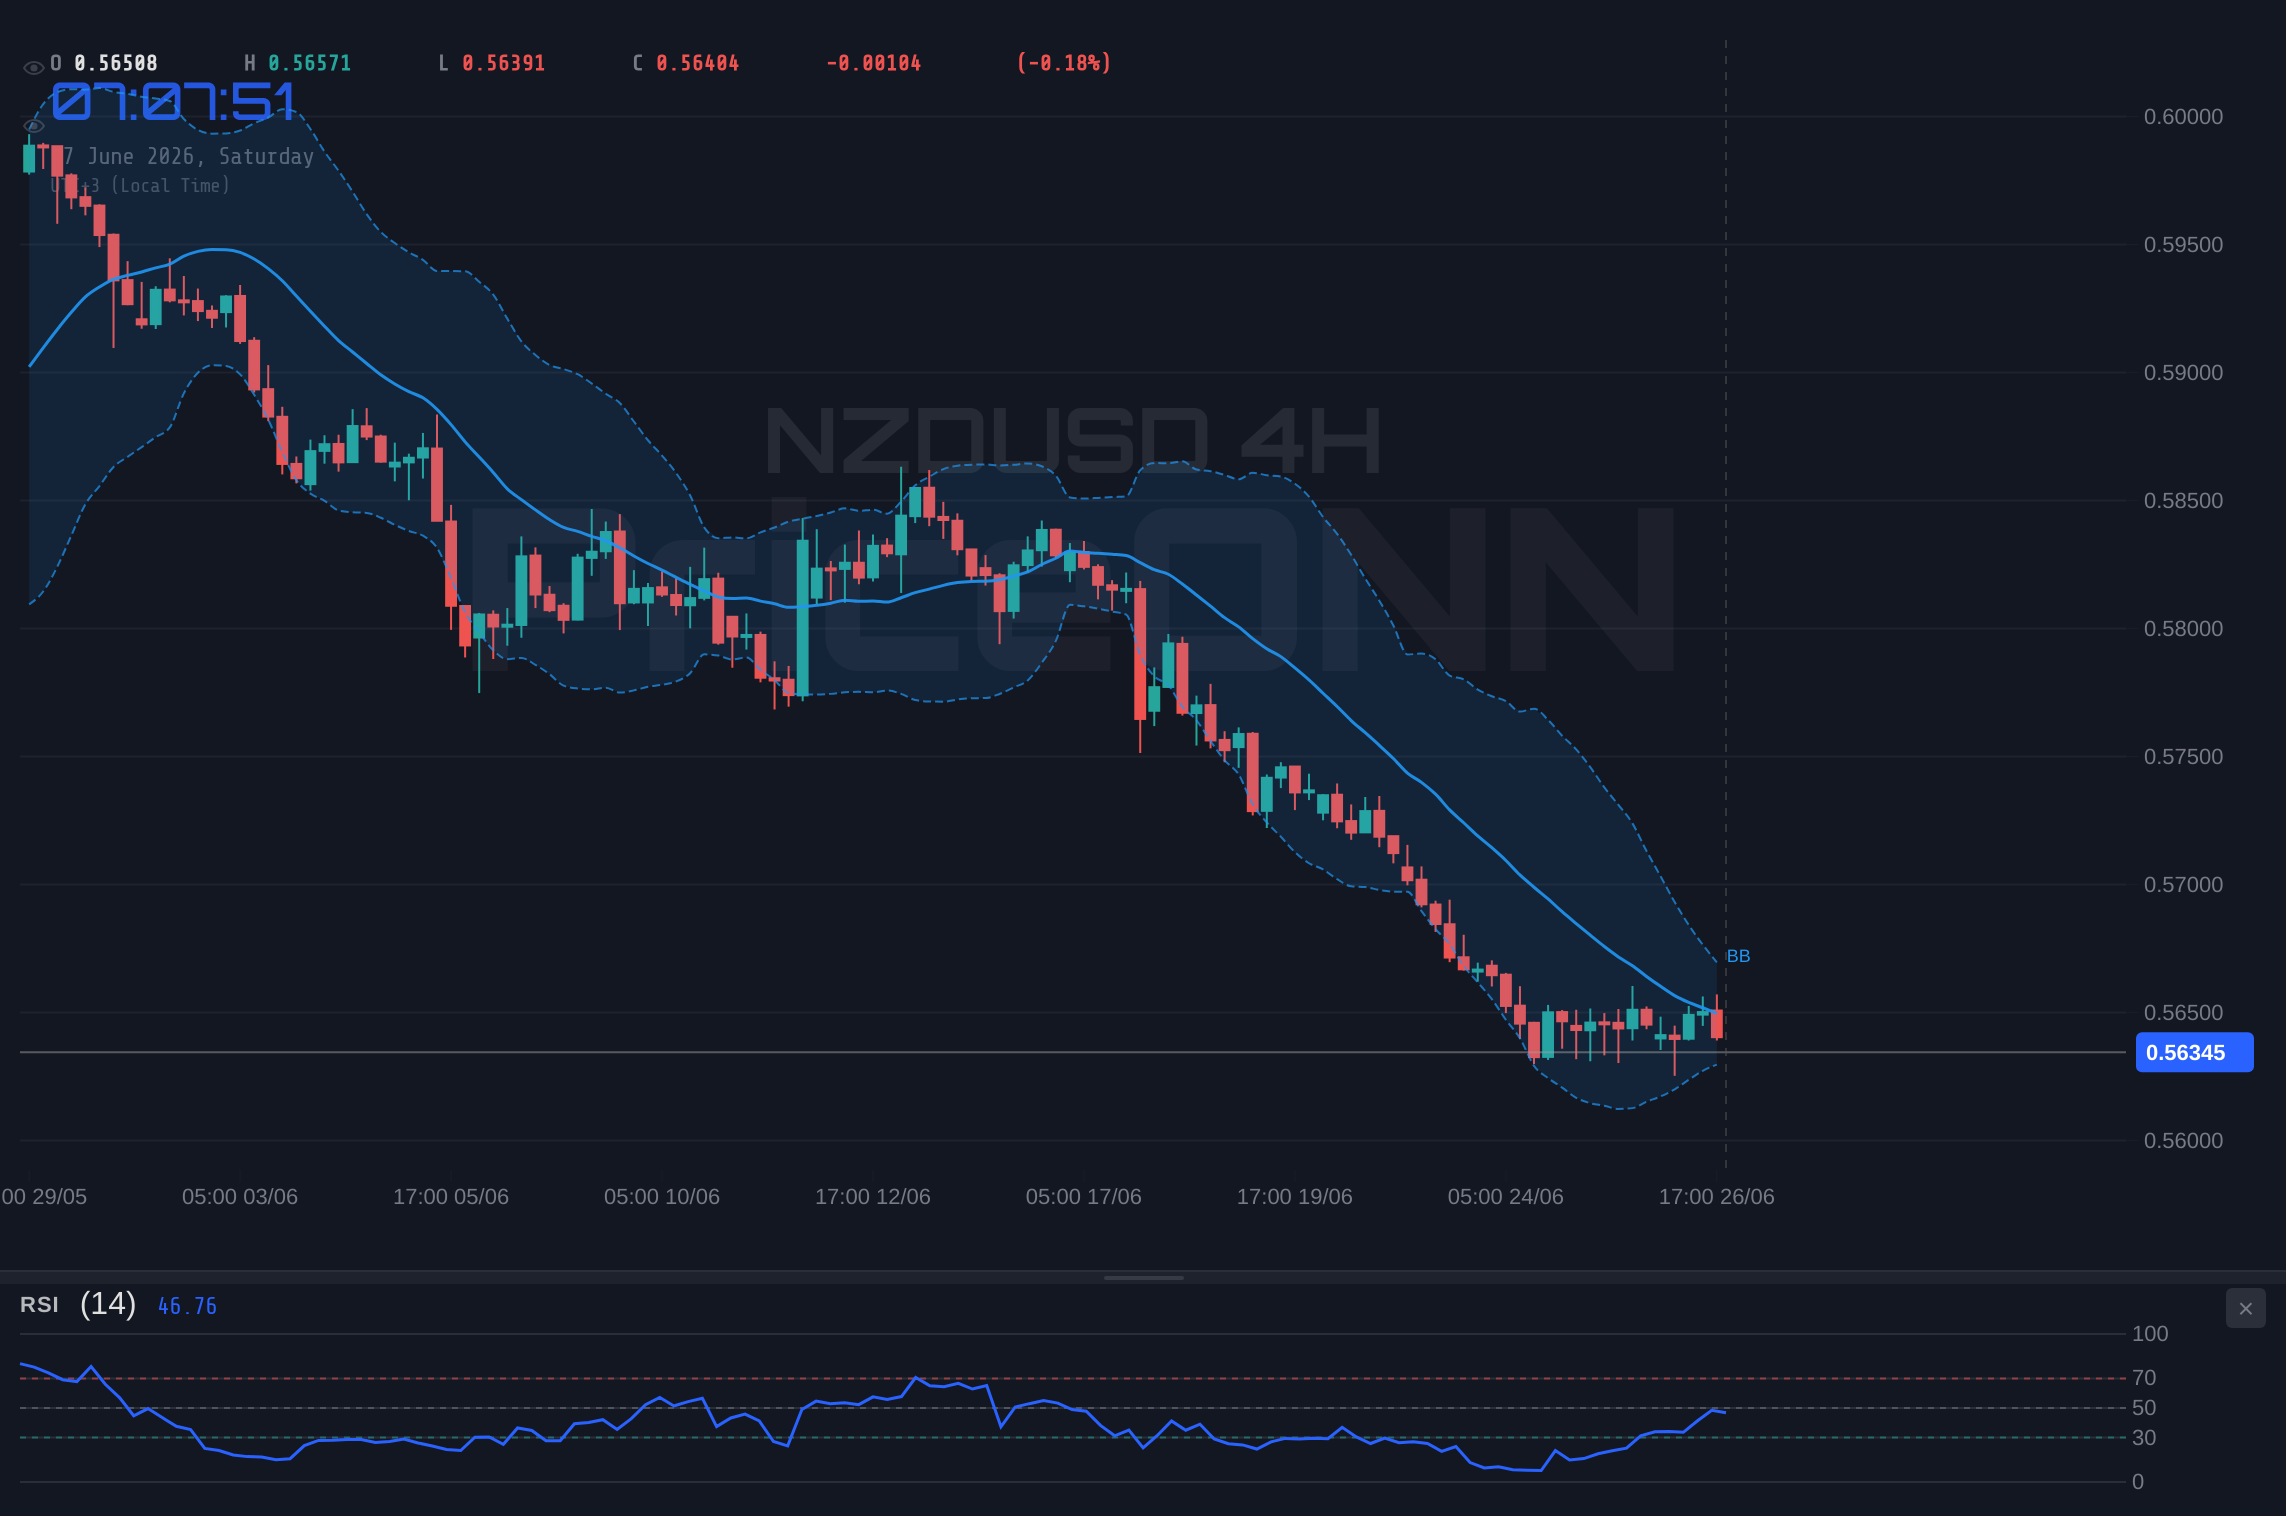
The technical landscape for NZDUSD currently paints a predominantly bearish picture, especially when examining the daily timeframe. The pair is firmly entrenched in a downtrend, with the ADX indicator reading a robust 34.29 on the daily chart, signaling a strong trend that traders are reluctant to fight. This isn't just a fleeting dip; the Daily trend strength is rated at a formidable 100%, indicating a clear directionality that has dominated recent market sentiment. The current price of $0.56361 is precariously perched above the first daily support level at $0.56303. A break below this level would likely trigger further selling pressure, targeting the subsequent support at $0.56152 and potentially reaching down to $0.56002. The RSI(14) at 31.55, while technically in oversold territory, is failing to provide any significant bullish divergence, suggesting that sellers remain in control and may continue to push prices lower despite the exhaustion signals.
The 4-hour chart offers a slightly more nuanced, yet still cautionary, view. While the trend strength is currently rated at 50% (Neutral), the ADX at 55.23 is alarmingly high, indicating a very strong trend, which in this context, is still predominantly downwards despite the neutral signal from the trend strength indicator. This suggests that any apparent consolidation is likely a temporary pause rather than a reversal. The MACD on the 4-hour chart shows positive momentum, which is a slight anomaly given the overall bearish outlook, but this must be viewed in conjunction with the Stochastic indicator. The Stochastic K line at 60.59 and D line at 52.75 indicate a bullish crossover, yet the RSI at 42.29 still points to a weakening market. This divergence between MACD and RSI on the 4H chart highlights the conflicting signals, but the overwhelming strength indicated by the ADX at 55.23 suggests that the bearish trend is likely to reassert itself if the support levels give way.
Even the 1-hour chart, often a playground for short-term traders seeking quick reversals, offers little solace for the bulls. The trend is firmly down with 87% strength, and the ADX at 13.49 indicates a weak trend, which in this context of a larger downtrend, suggests consolidation rather than a genuine recovery attempt. The RSI at 48.31 hovers around the neutral zone, showing no strong bullish bias, and the Stochastic indicator's K line at 12.6 and D line at 45.14 presents a strong bearish signal, indicating oversold conditions that could lead to a bounce, but the overall momentum is clearly leaning towards the downside. The general signal on the 1H timeframe is 'SELL', with 7 out of 8 indicators pointing that way, underscoring the immediate bearish pressure.
The Role of the US Dollar Index (DXY)
No analysis of NZDUSD can be complete without considering the strength of the US Dollar Index (DXY). Currently trading at 101.38, the DXY's daily trend is a strong 100% bullish, albeit with RSI at 71.59 in overbought territory, hinting at potential consolidation. However, the overall bullish momentum on the daily chart, with MACD positive and ADX at 40.81 indicating a strong trend, suggests that the dollar remains a favored safe-haven asset. Historically, a stronger DXY puts significant downward pressure on risk-sensitive currencies like the New Zealand Dollar. The inverse correlation is clear: as the dollar strengthens, NZDUSD tends to weaken. The current DXY level, despite some minor pullback on the 1-hour chart, reinforces the bearish outlook for NZDUSD. Any further strength in the DXY, perhaps fueled by renewed risk aversion or hawkish Fed commentary, would likely exacerbate the downward pressure on NZDUSD, pushing it towards its key support levels.
Key Levels to Watch: The Battleground Around $0.56361
Support Levels: The Last Line of Defense
The immediate focus for NZDUSD traders is the cluster of support levels that lie just below the current price of $0.56361. The first line of defense is at $0.56303. This level has been tested, and a decisive close below it on a daily basis would be a significant bearish signal, potentially opening the floodgates for further declines. Following this, traders will be watching $0.56152, a level that has previously acted as a significant floor. If the selling pressure intensifies and this level fails to hold, the next major test would be at $0.56002. This is a crucial psychological level, and a break below it could signal a more substantial move to the downside, potentially retesting lows not seen in months. The strength of the current downtrend, as indicated by the ADX, suggests that these support levels are under considerable threat.
Resistance Levels: The Path to Recovery
For any semblance of a bullish recovery, NZDUSD must first overcome the immediate resistance overhead. The first hurdle is at $0.56604. A sustained break and hold above this level would be the initial sign of shifting sentiment. However, the real test lies higher up. Resistance at $0.56754 is a more significant barrier, and clearing this would signal a potential short-term reversal. Beyond that, the $0.56905 level represents a more substantial resistance point. Breaking through this area would be necessary to invalidate the current bearish structure and suggest a move towards higher ground. Given the prevailing downtrend and the strength of the US dollar, these resistance levels are likely to act as formidable obstacles for any potential rallies in the short to medium term.
Market Sentiment and Macroeconomic Undercurrents
RBNZ's Stance and Inflation Concerns
The Reserve Bank of New Zealand (RBNZ) has been navigating a complex economic environment, and its policy decisions, or lack thereof, significantly influence the NZD. Recent reports indicate a collapse in RBNZ hike bets, suggesting that the market no longer anticipates further tightening from the central bank in the near future. This dovish tilt, or at least a neutral stance, contrasts with the more hawkish undertones from other central banks, particularly the US Federal Reserve. While the Fed's rate hike odds may be fading, the market still prices in a significant probability of policy remaining tight for longer, supporting the US Dollar. For NZDUSD, this divergence in monetary policy expectations creates a headwind, limiting upside potential and contributing to the bearish sentiment.
Inflation remains a key concern globally, and New Zealand is no exception. While inflation figures worldwide have shown signs of cooling, the persistence of elevated price levels continues to challenge central banks. For the RBNZ, managing inflation without stifling economic growth is a delicate balancing act. Any indication of sticky inflation could, in theory, lead to a re-evaluation of the neutral stance, but the current market pricing suggests otherwise. This lack of a hawkish catalyst from the RBNZ leaves the Kiwi vulnerable to broader US Dollar strength and risk-off sentiment, which have been dominant themes in recent trading sessions.
Global Risk Appetite and Geopolitical Factors
The broader market sentiment plays a crucial role in the performance of currencies like the NZD. As a commodity-linked currency and often considered a risk-on asset, the New Zealand Dollar tends to suffer when global risk appetite wanes. Recent weeks have seen a mixed picture, but underlying geopolitical tensions and concerns about the global economic outlook can quickly shift sentiment towards risk aversion. The ongoing volatility in energy markets, with Brent crude trading around $73.51 and WTI at $70.83, reflects underlying concerns about supply and demand dynamics, as well as geopolitical risks in energy-producing regions. While these commodity prices are not directly tied to NZDUSD, they serve as indicators of global economic health and risk sentiment. A significant escalation in geopolitical tensions or a sharp downturn in equity markets, such as the recent weakness seen in the Nasdaq 100 at 28998.91, could trigger a flight to safety, further strengthening the US Dollar and weakening NZDUSD.
The recent news regarding the US Dollar Index weakening below 101.50 following US PCE inflation data is a crucial piece of context. While this might suggest a temporary reprieve for riskier assets, the underlying narrative of fading Fed rate hike odds could be interpreted in multiple ways. It might signal a Fed nearing the end of its hiking cycle, which could eventually support risk assets. However, if inflation remains stubbornly high or if economic data continues to show resilience, the Fed might be forced to maintain higher rates for longer, which would continue to favor the US Dollar. The market is keenly watching for any definitive signs of a Fed pivot or a clear path towards rate cuts, but for now, the dollar's strength, supported by relative interest rate differentials and safe-haven demand, remains a significant headwind for NZDUSD.
Trading Scenarios: Charting the Path Forward
The Bear's Roadmap: A Path Towards Lower Lows
Bearish Scenario: The Downward Spiral
65% ProbabilityThe most probable scenario, given the current technical and fundamental backdrop, is a continuation of the bearish trend. The trigger for this scenario is a decisive daily close below the critical support level at $0.56303. This would signal a breakdown of the current consolidation and likely initiate a fresh wave of selling. The ADX at 34.29 on the daily chart confirms the strength of the prevailing downtrend, suggesting that such a breakdown would find momentum. The first target would be the next support level at $0.56152. If selling pressure intensifies, we could see NZDUSD testing the $0.56002 level, a significant psychological barrier. The invalidation of this bearish thesis would require a strong daily close above the resistance level at $0.56754, indicating a shift in market sentiment and a potential move away from the current downtrend. This scenario is further supported by the strong US Dollar Index at 101.38, which continues to exert pressure on risk-sensitive currencies like the Kiwi.
The Bull's Gambit: A Risky Counter-Trend Play
Bullish Scenario: A Fleeting Rebound?
15% ProbabilityWhile the odds appear stacked against the bulls, a counter-trend rally is not entirely out of the question, albeit with a low probability of 15%. Such a move would likely be triggered by a significant shift in market sentiment, perhaps a dovish surprise from the Fed or a sudden escalation of geopolitical risk that leads to a broad-based dollar sell-off. Technically, the trigger for this scenario would be a strong daily close above the resistance level at $0.56754. This would suggest that the immediate selling pressure has abated and that buyers are stepping in. The first target for such a move would be the next resistance at $0.56905. A more aggressive rally could potentially push towards $0.57100, driven by short-covering. The invalidation for this bullish outlook would be a failure to hold the current support levels, specifically a daily close below $0.56303, which would revert the market back to the primary bearish scenario.
The Waiting Game: Consolidation Around Current Levels
Neutral Scenario: Sideways Action
20% ProbabilityA neutral scenario, where NZDUSD remains range-bound between the immediate support and resistance levels, carries a 20% probability. This outcome would likely occur if market participants adopt a wait-and-see approach, perhaps awaiting key economic data releases or further clarity on central bank policy. In this scenario, price action would likely be choppy, oscillating between the $0.56303 support and the $0.56754 resistance. The immediate targets within this range would be the midpoint around $0.56500 and the immediate resistance at $0.56604. This scenario would be invalidated by a decisive breakout in either direction, leading back to the bullish or bearish scenarios. The weak trend indicated by the ADX on the 1-hour chart (13.49) lends some credence to the possibility of range-bound trading, but the stronger ADX readings on the daily and 4-hour charts suggest that such consolidation might be temporary.
What I'm Watching This Week: Key Triggers for NZDUSD
As we look ahead to the coming week, several key factors will dictate the direction of NZDUSD. Firstly, the continued action of the US Dollar Index (DXY) remains paramount. Any significant moves in the DXY, particularly driven by US economic data or Fed speak, will have a direct impact on NZDUSD. Traders will be closely monitoring upcoming US economic releases for any hints about the Fed's future policy path. Secondly, any new commentary or data from the RBNZ regarding inflation or economic growth could shift sentiment around the New Zealand Dollar. Given the current market pricing, any unexpected hawkish remarks would be a strong catalyst for NZDUSD to move higher, while dovish signals would reinforce the bearish outlook.
From a technical perspective, the price action around the $0.56303 support level will be the most critical short-term trigger. A confirmed break below this level would likely accelerate the move towards our bearish targets. Conversely, a sustained push above $0.56754 would signal a potential change in trend and open up opportunities for a counter-trend trade. The confluence of technical indicators, particularly the high ADX readings across multiple timeframes, suggests that the market is in a strong trend, and therefore, trading with the trend is generally the preferred strategy. However, the oversold RSI on the daily chart at 31.55 indicates that the downside momentum might be nearing exhaustion, making the breakdown levels even more critical to watch for potential entry points in a bearish continuation.
The Path Forward: Navigating Uncertainty with Discipline
The current technical setup for NZDUSD presents a challenging but potentially rewarding environment for disciplined traders. The overwhelming evidence points towards a continuation of the bearish trend, with key support levels at $0.56303 and $0.56152 being critical for the immediate outlook. While the RSI on the daily chart hints at oversold conditions, the strong ADX readings across different timeframes suggest that the trend remains firmly in place, indicating that betting against the trend carries significant risk. The influence of the US Dollar Index, currently at 101.38 and showing bullish strength, further reinforces the bearish bias for NZDUSD. Any recovery would likely require a substantial shift in global risk sentiment or a decisive change in central bank policy expectations, neither of which appears imminent.
For traders considering positions, the most prudent approach appears to be aligning with the prevailing trend. A breakdown below $0.56303 could offer a high-probability entry into a short position, targeting $0.56152 and potentially $0.56002. Stops should be managed tightly, perhaps placed just above the invalidated resistance level, to limit potential losses should a counter-trend move materialize unexpectedly. Conversely, a break and sustained hold above $0.56754 would signal a potential reversal, but this scenario currently carries a lower probability and would require careful observation for confirmation. The key takeaway is to remain patient, wait for clear signals, and manage risk diligently. The market always presents opportunities, but patience and discipline are the cornerstones of successful trading, especially in these choppy conditions.
Frequently Asked Questions: NZDUSD Analysis
What happens if NZDUSD breaks below $0.56303 support?
A daily close below $0.56303 would likely trigger further selling, with the next targets at $0.56152 and potentially $0.56002. This would confirm the primary bearish scenario.
Should I consider buying NZDUSD at current levels of $0.56361 given the RSI at 31.55?
While the daily RSI at 31.55 suggests oversold conditions, the strong ADX at 34.29 indicates a persistent downtrend. Buying here is risky; a confirmed break above $0.56754 would be a more reliable bullish signal.
Is the ADX at 34.29 a strong sell signal for NZDUSD?
An ADX value of 34.29 on the daily chart signifies a strong trend. Combined with the bearish price action and other indicators, it reinforces the bearish bias and suggests that selling on rallies or waiting for a breakdown below support is the more prudent strategy.
How will the current DXY strength at 101.38 affect NZDUSD this week?
The strong US Dollar Index (DXY) at 101.38 generally exerts downward pressure on risk-sensitive currencies like the NZD. Further DXY strength, especially if driven by Fed expectations, could push NZDUSD towards its lower support levels.
Track markets in real-time
AI-powered analysis, technical indicators and real-time price data.
Join Our Telegram Channel
Breaking market news, AI analysis and trading signals instantly.
Join Channel