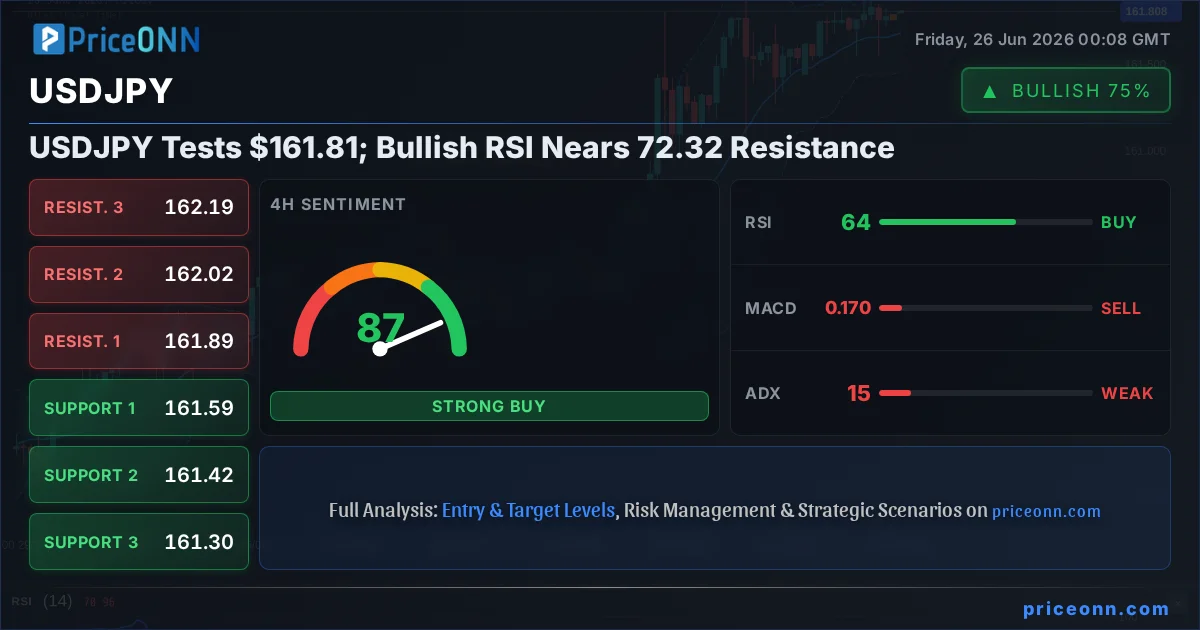
This is where the action is. USDJPY is sitting right at $161.81, a level that's been the talk of the town for anyone watching the forex market closely. The momentum here feels like it's building, with the RSI screaming bullish signals on the daily chart at 72.32. But here’s the kicker: that resistance at $161.91 is looming large. It’s a classic tug-of-war scenario, and figuring out which side wins could be the key to unlocking significant trading opportunities in the near term.
- USDJPY is trading at $161.81, with a strong bullish signal from the daily RSI at 72.32.
- The immediate resistance level to watch is $161.91, a critical barrier that could determine the next move.
- A close above $161.91 could target $162.07, while a failure to break could see a pullback towards $161.76.
- Correlation with the DXY, currently at 101.55 and showing strong upward trend signals, adds complexity to the USDJPY outlook.
Now, let's dive into what's really moving the needle on USDJPY. We're seeing a confluence of factors, but the technical picture is particularly compelling right now. The daily chart shows a strong upward trend (96% strength), with the price currently hugging the upper Bollinger band. This suggests that buyers are in control, pushing the yen lower against the dollar. The ADX at 21.89, while not extremely high, indicates a developing trend that could gain further traction if key levels are breached.
The RSI on the daily timeframe is indeed screaming bullish at 72.32. This is a level where, historically, we often see continued upward momentum, especially when coupled with positive MACD readings. The MACD itself is showing positive momentum and is firmly above its signal line, reinforcing the bullish sentiment. However, we can't ignore the Stochastic K line at 90.14 and D line at 83.79. This pair is deep in overbought territory, signaling that a pullback or consolidation is highly probable. This divergence between the RSI's bullish trend and the Stochastic's overbought condition creates a fascinating tension.
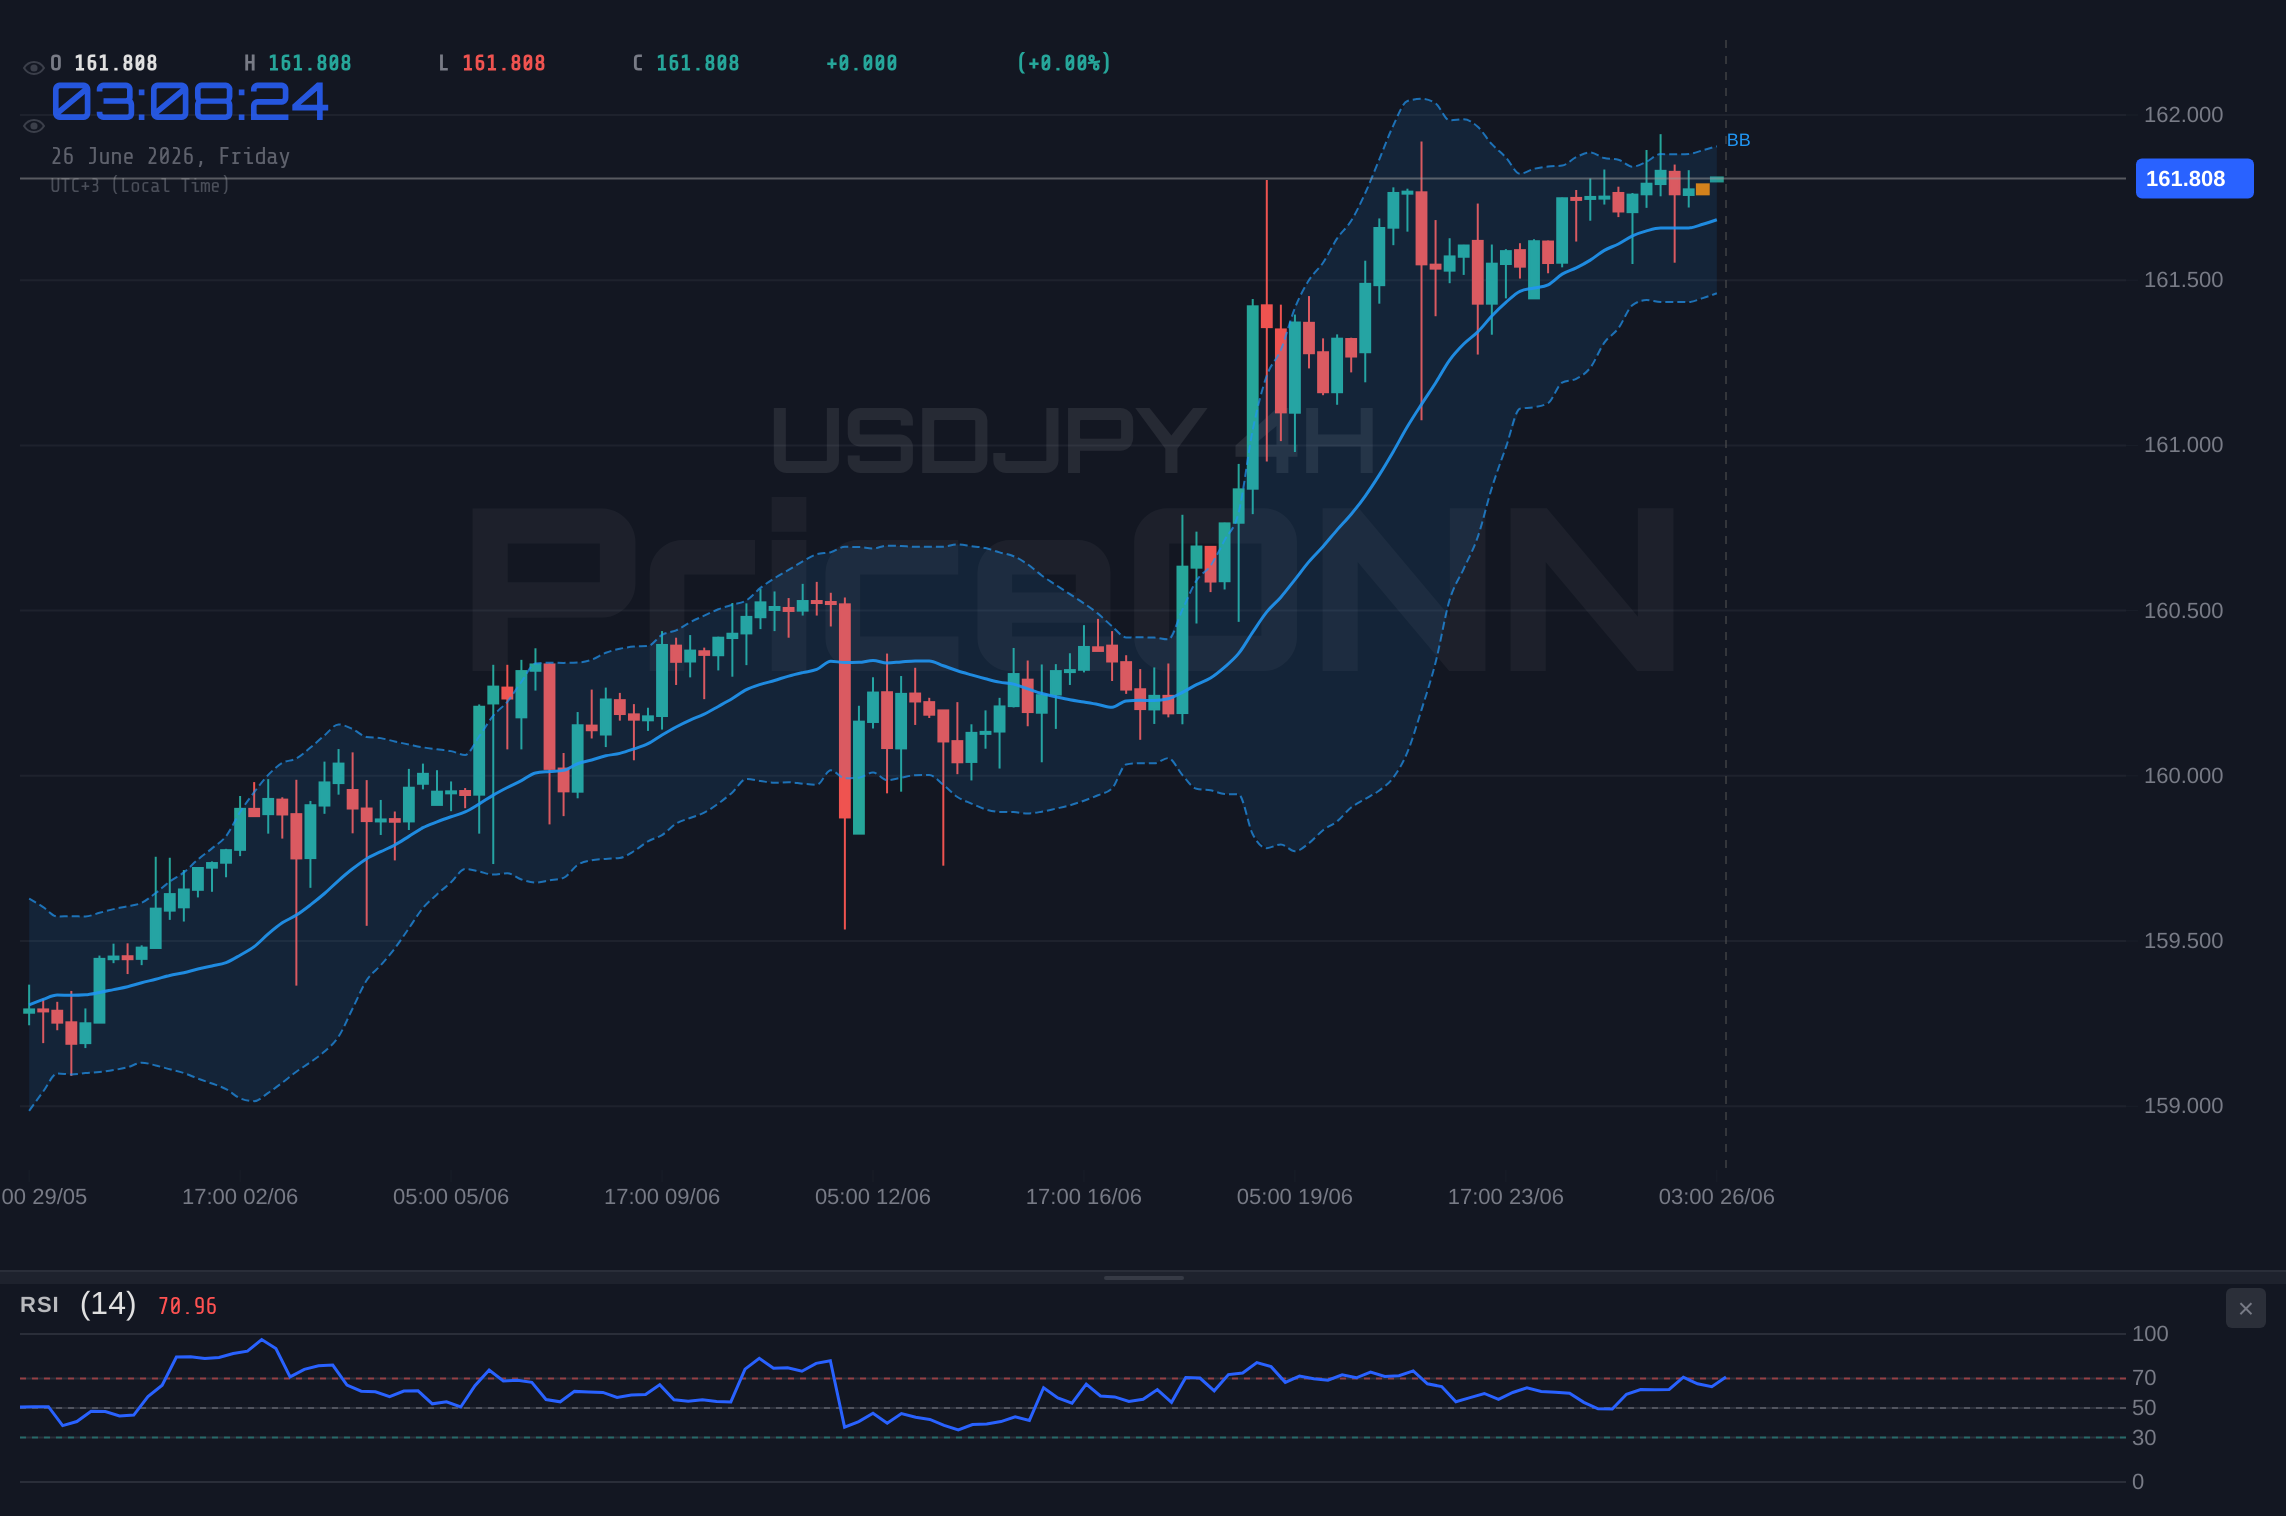
Looking at the 4-hour chart, the picture becomes a bit more nuanced. The trend is still bullish (83% strength), but the ADX here is weaker at 15.37, suggesting the current upward move might be losing steam or is in a consolidation phase before the next significant leg. The Stochastic here is showing a bearish signal (%K
The 1-hour chart paints an even more cautious picture. The trend is neutral (50% strength) with an ADX of just 12.88, indicating a lack of strong directional conviction. The MACD is showing negative momentum, and the Stochastic is in overbought territory with a bearish cross. This short-term bearish leaning, despite the daily bullishness, highlights the importance of managing risk and not jumping in blindly. The immediate support at $161.759 and resistance at $161.799 on this timeframe suggest very tight ranges, typical of consolidation periods.
The Dollar's Strength: A Key Driver
One of the most significant fundamental drivers underpinning USDJPY's strength is the performance of the US Dollar Index (DXY). Currently trading at 101.55, the DXY is showing a robust upward trend on the 4-hour and daily charts, with ADX values well above 40. On the daily timeframe, the DXY is in overbought territory with an RSI of 75.39, indicating potential for a short-term pullback. However, the overall trend remains strongly bullish. This dollar strength directly correlates with USDJPY, as a stronger dollar naturally pushes the pair higher.
The recent news flow also adds context. While not directly mentioning USDJPY, the broader market sentiment, including the euro softening due to Fed hike bets and oil price drops fueling ECB rate cut expectations, points towards a divergence in central bank policies. The US Federal Reserve is perceived as being more hawkish than its European counterparts, which supports dollar strength. Traders are closely watching upcoming US economic data, particularly PCE inflation figures, which could provide further clues about the Fed's future monetary policy path. Any indication of continued inflation or a hawkish stance from Fed officials would likely bolster the dollar and, consequently, USDJPY.
Correlation with Risk Appetite
The performance of major indices like the S&P 500 and Nasdaq provides another crucial layer of analysis. The Nasdaq, currently facing selling pressure and showing a bearish trend on its 4-hour and daily charts, suggests a 'risk-off' sentiment in the broader market. Typically, when risk appetite wanes, investors flock to perceived safe-haven assets. While USDJPY has historically been considered a risk-sensitive currency pair, its strong correlation with the DXY means that dollar strength can sometimes override general risk sentiment. In this scenario, a weakening Nasdaq might not necessarily lead to a USDJPY decline if the dollar continues to strengthen independently.
However, the relationship is not always straightforward. If the risk-off sentiment intensifies significantly, it could trigger a broad deleveraging that affects even traditionally strong currency pairs. For USDJPY, a sharp decline in global equities could, paradoxically, lead to some unwinding of the yen-carry trade if volatility spikes, putting some downward pressure on the pair. This highlights the complexity of the current market environment, where multiple, sometimes conflicting, forces are at play. Traders need to monitor both the dollar's strength and the prevailing risk sentiment to navigate these dynamics effectively.
Economic Calendar Watchlist
Looking ahead, the economic calendar is packed with events that could significantly impact USDJPY. The upcoming release of US Personal Consumption Expenditures (PCE) inflation data is paramount. As the Fed's preferred inflation gauge, any deviation from expectations could dramatically influence interest rate policy. If PCE comes in hotter than anticipated, it could reinforce hawkish Fed expectations, further boosting the dollar and USDJPY. Conversely, cooler inflation data might lead to reassessment of Fed policy, potentially weakening the dollar.
Furthermore, speeches from Federal Reserve officials will be closely scrutinized. Their commentary on inflation, economic growth, and the future path of monetary policy can move markets instantly. On the Japanese side, while Japanese economic data releases are less frequently market-moving compared to US data, any significant surprises in inflation, GDP, or employment figures could cause short-term volatility for the yen. The Bank of Japan's stance on monetary policy remains a key factor, although recent shifts suggest a gradual normalization might be on the horizon.
Navigating the Resistance at $161.91
The immediate price action around $161.81 is critical. The resistance level at $161.91 is the key hurdle for the bulls. A decisive break and sustained hold above this level, especially on the 1-hour or 4-hour chart, would likely open the door for further upside, potentially targeting the next resistance at $162.07. This would confirm the bullish daily RSI and MACD signals and suggest that the overbought Stochastic on the daily chart was simply indicating strong momentum rather than an imminent reversal.
Conversely, if USDJPY fails to break $161.91 and starts to falter, we could see a pullback. The immediate support on the 1-hour chart is around $161.759. A break below this could lead to a test of the $161.738 and $161.719 support levels. On the 4-hour chart, the support at $161.592 becomes more relevant if the bearish short-term signals gain traction. This scenario would suggest that the daily bullish indicators were premature, and a deeper correction is underway, possibly driven by profit-taking or a shift in market sentiment.
The Trader's Perspective: Patience and Precision
For traders, this is a 'wait and watch' scenario. The conflicting signals between timeframes - bullish on daily, neutral-to-bearish on hourly - demand caution. The most prudent approach involves waiting for a clear break of the $161.91 resistance level with confirming volume and subsequent price action. Alternatively, if a pullback occurs, watching the reaction at the $161.759 support level on the 1-hour chart, or the $161.592 level on the 4-hour chart, will be crucial for identifying potential buying opportunities or confirming a short-term bearish bias.
The ADX readings are particularly telling. The strong ADX on the daily (21.89) and 4-hour (15.37) charts, despite the neutral trend strength on the 1H (12.88), suggest that underlying trend potential exists, but it's not fully committed. This often leads to periods of consolidation or sharp, short-lived moves. Therefore, focusing on price action around the key levels of $161.81, $161.91, and $161.759 will be more informative than relying solely on indicator signals, which are currently sending mixed messages.
Ultimately, the USDJPY pair is at a critical juncture. The bullish sentiment is undeniable on the daily chart, fueled by dollar strength and positive momentum indicators. However, the overbought conditions on shorter timeframes and the formidable resistance at $161.91 present a significant challenge. Success in trading this pair in the immediate future will likely hinge on patience, precise execution, and a keen eye for confirmation signals after a clear break or rejection of these pivotal levels.
Bearish Scenario: Resistance Holds Firm
65% ProbabilityBullish Scenario: Resistance Shattered
25% ProbabilityNeutral Scenario: Consolidation Continues
10% ProbabilityFrequently Asked Questions: USDJPY Analysis
What happens if USDJPY breaks above the $161.91 resistance level?
A sustained break above $161.91, confirmed by hourly closes, would likely target the $162.07 resistance. This would validate the strong daily RSI at 72.32 and could extend the bullish trend, especially if dollar strength persists.
Is the RSI at 72.32 a buy signal for USDJPY right now?
The daily RSI at 72.32 indicates strong bullish momentum, but it's nearing overbought territory. While not an immediate sell signal, it suggests caution. The Stochastic oscillator is in overbought territory on the daily, indicating a potential pullback is more likely than an immediate surge without consolidation.
How will the upcoming PCE inflation data affect USDJPY?
Higher-than-expected PCE data would likely strengthen the US dollar, pushing USDJPY higher towards $162.00 and beyond. Conversely, cooler inflation could lead to dollar weakness and a pullback towards $161.76, especially if it alters Fed rate hike expectations.
Should I trade USDJPY at the current $161.81 level given the mixed signals?
Trading directly at $161.81 is risky due to conflicting signals between timeframes. It's advisable to wait for a clear break above $161.91 for a bullish entry or a confirmed break below $161.76 for a bearish outlook, managing risk tightly.
Track markets in real-time
AI-powered analysis, technical indicators and real-time price data.
Join Our Telegram Channel
Breaking market news, AI analysis and trading signals instantly.
Join Channel