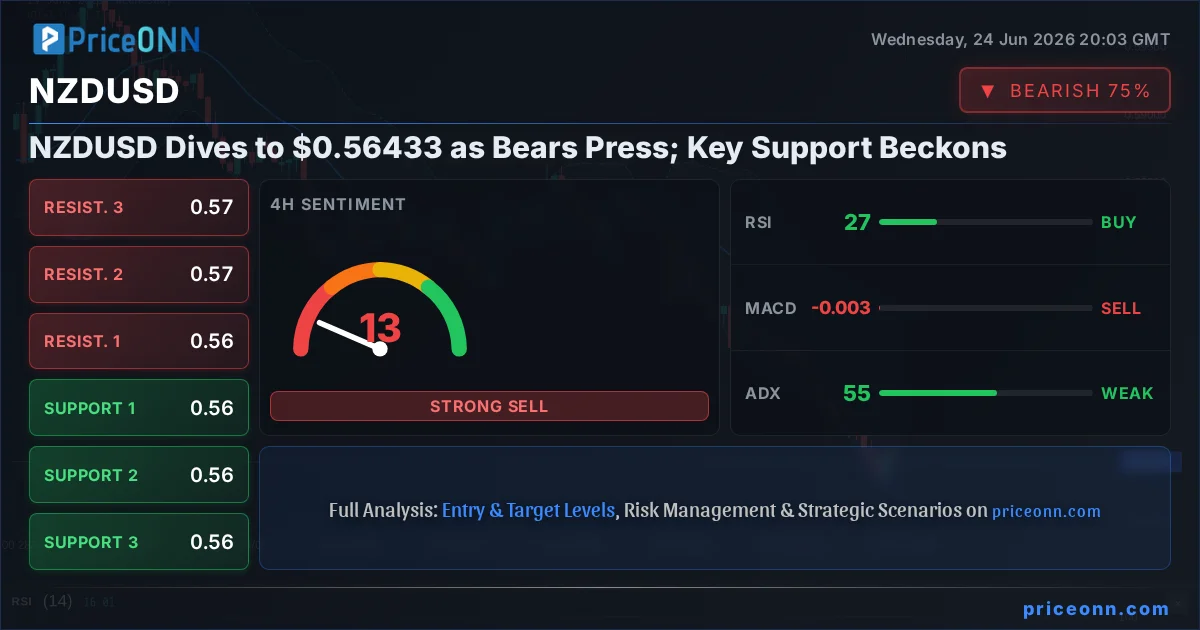
The New Zealand dollar has been caught in a relentless sell-off, with the NZDUSD pair plummeting to a critical juncture around $0.56433. This sharp decline is not happening in a vacuum; it's a confluence of strong bearish technical signals and a strengthening US dollar, as evidenced by the Dollar Index (DXY) pushing higher to 101.67. The sheer force behind this move is underscored by the ADX indicator, which has surged to 55.14 on the 1H chart, signaling a powerful and committed downtrend. This isn't just a minor dip; it's a significant bearish sentiment dominating the currency pair across multiple timeframes, demanding close attention from traders and investors alike.
- RSI at 27.37 on the 4H chart signals extreme oversold conditions for NZDUSD, potentially offering a short-term bounce opportunity.
- Critical support for NZDUSD is identified at $0.56474, a level that has been tested and could act as a floor if the current selling pressure eases.
- The ADX at 55.14 on the 1H timeframe indicates a very strong downtrend, suggesting that further downside remains a distinct possibility.
- The US Dollar Index (DXY) at 101.67 is strengthening, correlating with NZDUSD's weakness and reinforcing the bearish outlook for the pair.
The narrative gripping the forex market is one of persistent dollar strength and a broad risk-off sentiment that is punishing risk-sensitive currencies like the Kiwi. With the DXY at 101.67, the greenback is showing robust upward momentum, a trend that often spells trouble for pairs like NZDUSD. This strength in the dollar is a direct consequence of global economic anxieties and a shift in risk appetite, pushing investors towards perceived safe-haven assets. The recent news flow, including reports of the Euro hitting yearly lows due to dovish ECB signals and a technology sector sell-off weighing on European equities, paints a picture of global economic uncertainty. This uncertainty naturally fuels demand for the dollar, creating headwinds for currencies like the NZD.
Looking at the technical landscape for NZDUSD, the picture is overwhelmingly bearish, especially on the shorter timeframes. On the 1-hour chart, the trend is decisively down with 100% strength, supported by a MACD that shows negative momentum and an RSI hovering in neutral territory at 32.73, but with a clear downward inclination. The Stochastic Oscillator, with K at 18.03 and D at 27.27, also points to further downside. However, it's the ADX at 49.29 that truly captures the intensity of the current bearish trend. This isn't a gentle decline; it's a powerful bearish wave that has swept the pair lower. The immediate support levels are identified at 3962.2, 3943.22, and 3927.3, but the overwhelming trend suggests these could be tested rapidly.
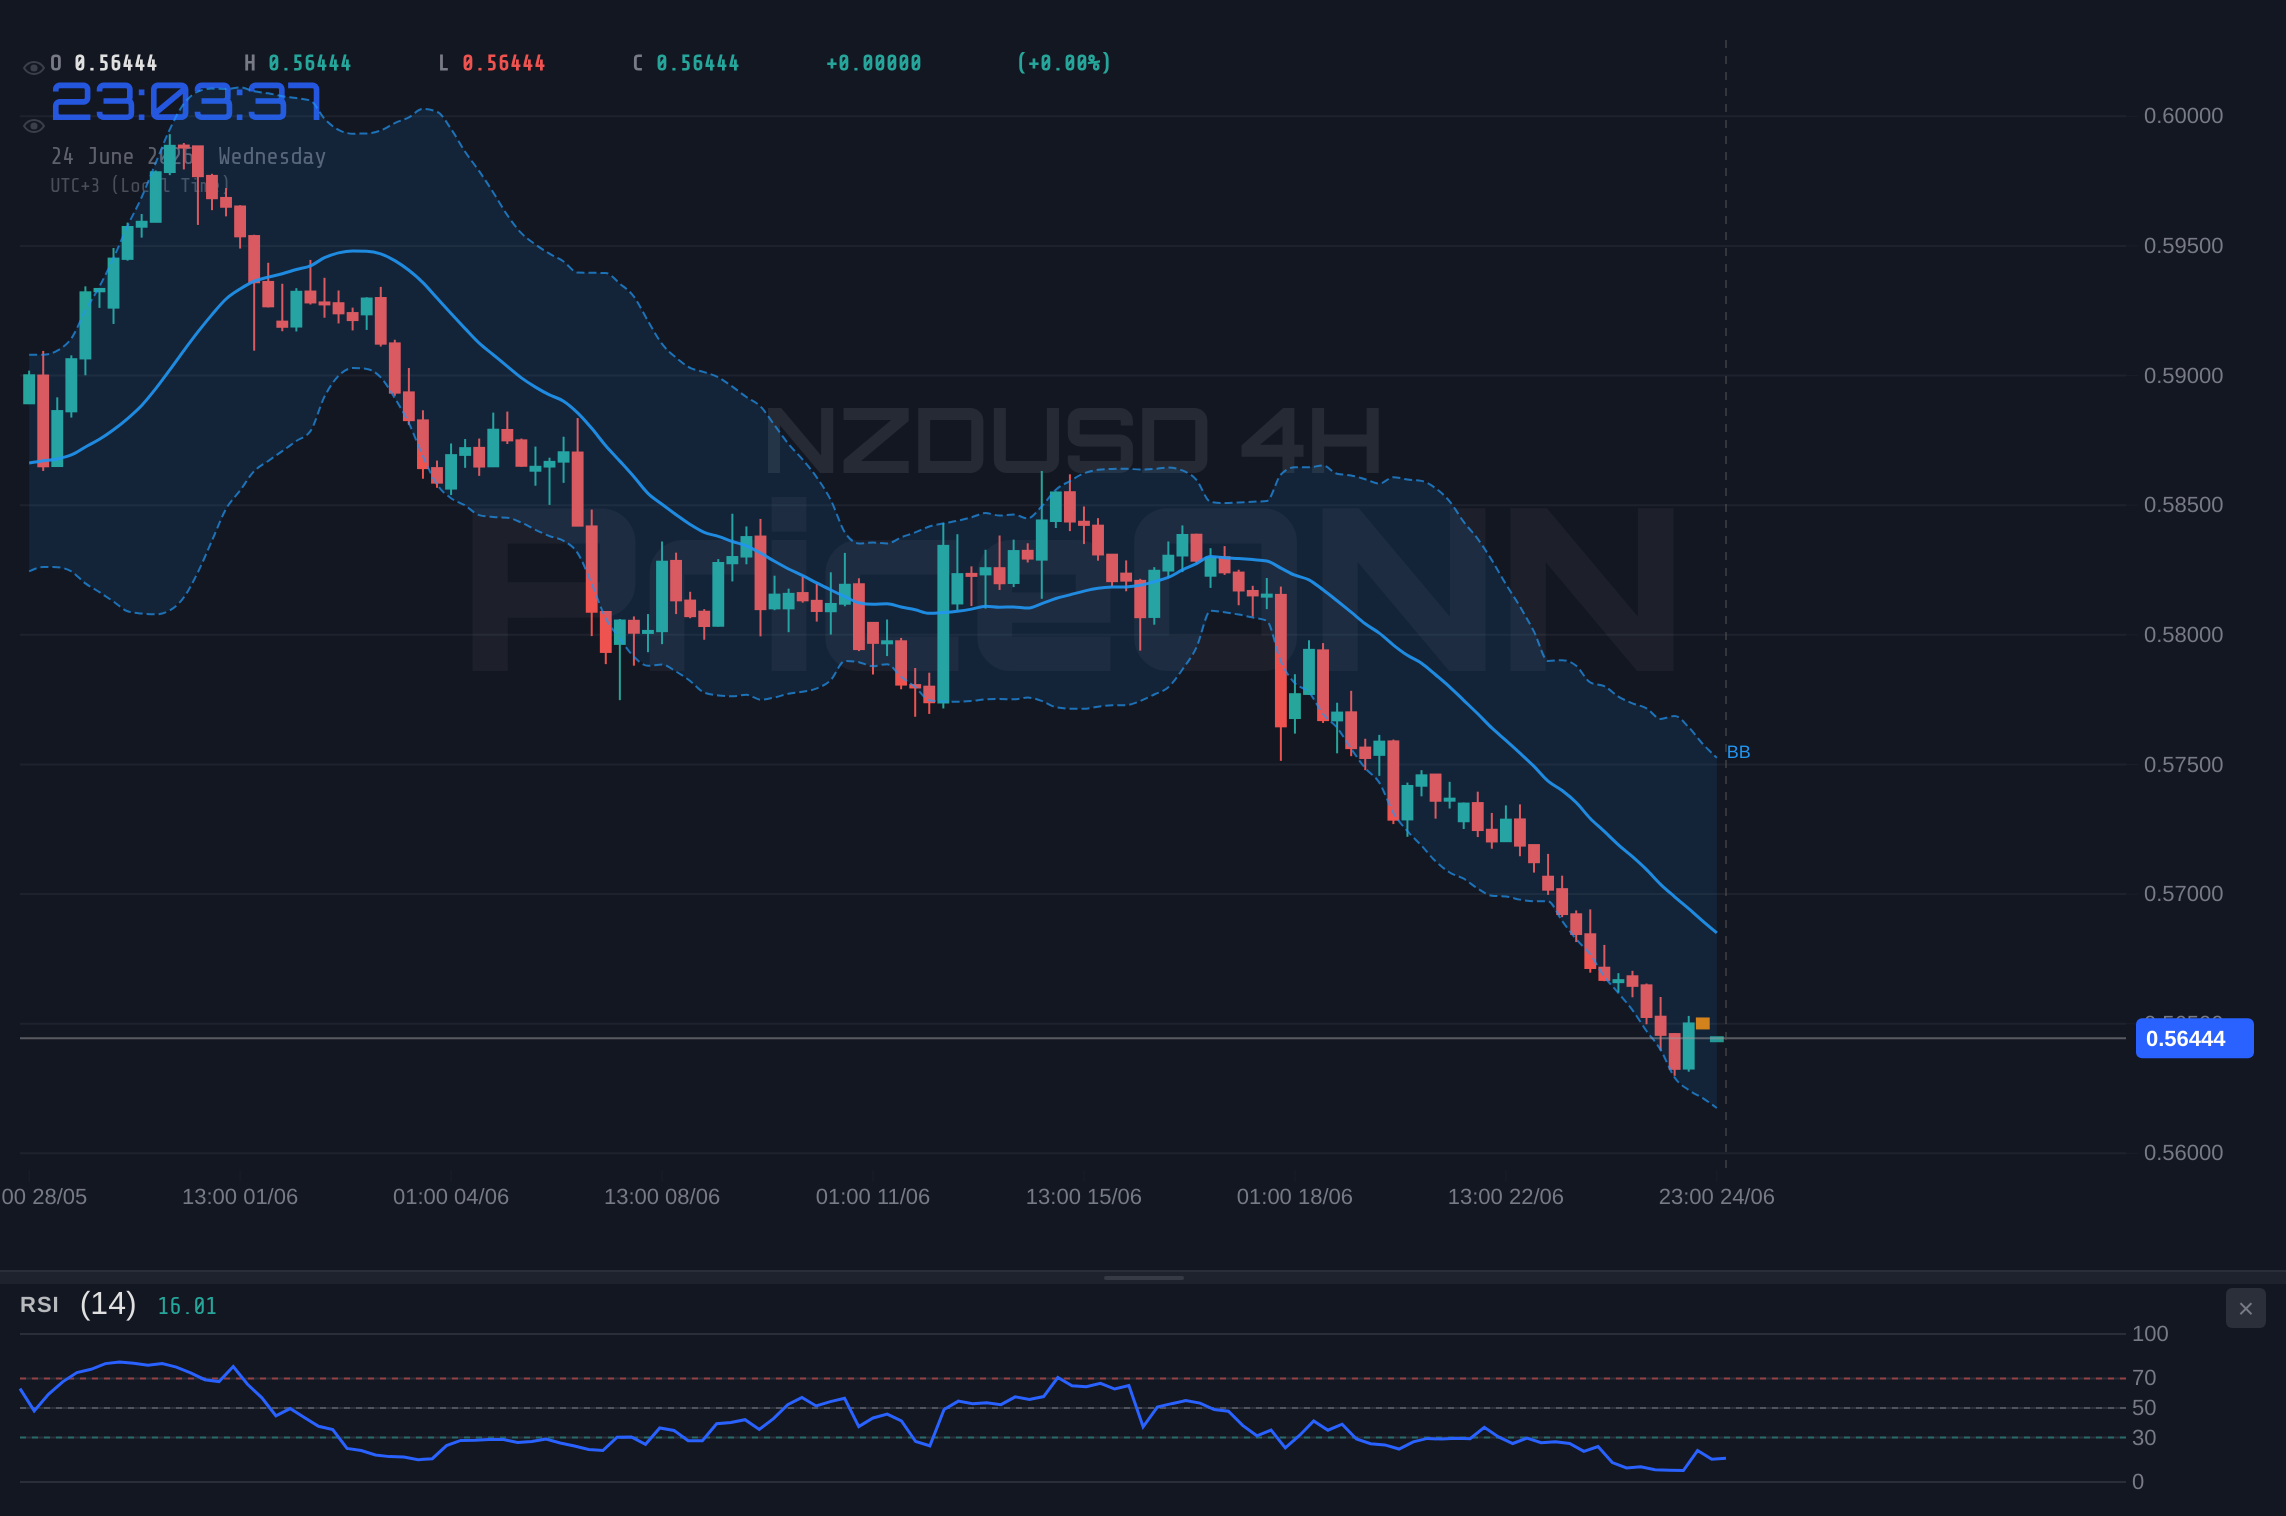
The 4-hour timeframe reinforces this bearish conviction, though it also hints at potential oversold conditions. The trend remains strongly downwards (97% strength), with the RSI dipping into the oversold region at 25.46. This is a crucial observation: while the trend is strongly bearish, an RSI below 30 often precedes a temporary bounce or consolidation. The MACD continues to show negative momentum, and the Bollinger Bands are hugging the lower band, indicating extreme selling pressure. Stochastic K (9.7) and D (14.65) are deeply in oversold territory, reinforcing the idea that the selling might be overextended in the short term. The ADX here is 44.95, still indicating a strong downtrend, but the RSI reading suggests that aggressive selling might be losing some steam, paving the way for a potential, albeit likely short-lived, reprieve.
On the daily chart, the bearish narrative for NZDUSD continues, albeit with a slightly less aggressive trend strength (95%). The RSI is at 30.01, teetering on the edge of the oversold zone, mirroring the 4-hour chart's suggestion of potential exhaustion. The MACD remains firmly in negative territory, and the Bollinger Bands are below the middle band. Stochastic K (25.66) and D (44.23) are still showing a bearish signal and are not yet in extreme oversold territory, indicating that while the selling is intense, there might still be room for further declines before a significant reversal. The ADX at 39.68 confirms a strong downtrend is still in play. The critical support on the daily chart is at 4067.88, followed by 4025.72 and 3960.64. These levels are key for determining the broader trend's sustainability.
The immediate focus for NZDUSD traders must be on the key support level identified at $0.56474. This is the first line of defense against further price erosion. A sustained break below this level, particularly with strong volume and conviction, would open the door to the next support at $0.56262. The daily trend signals suggest that if this level fails, the market could be heading towards the $0.56097 mark. However, the oversold readings on the RSI and Stochastic across multiple timeframes cannot be ignored. A bounce from the vicinity of $0.56474 is a distinct possibility, especially if the US dollar shows any signs of consolidation or if risk sentiment improves globally. The current price of $0.56433 is precariously close to this critical support, making it a pivotal point for the pair's immediate future.
The macroeconomic backdrop provides further context for NZDUSD's struggles. Recent economic data from the Eurozone has been weak, contributing to the Euro's fall and, by extension, bolstering the US dollar. Reports of the ECB signaling further dovish policy, as mentioned by Chief Economist Philip Lane, suggest that monetary policy divergence could continue to favor the dollar. While this is specific to the EUR, it contributes to a general theme of dollar strength against most major and minor currencies. For New Zealand, a weaker global economic outlook and continued commodity price weakness (evident in the sharp drops in Brent and WTI crude oil, and precious metals like gold and silver) can weigh on the nation's export-driven economy, indirectly pressuring the Kiwi.
Correlation analysis is crucial here. The DXY is trading at 101.67, showing a strong upward trend. Typically, a rising DXY exerts downward pressure on NZDUSD. The S&P 500, currently at 6572.87, has seen a mixed picture with a strong intraday rally but a bearish daily trend, suggesting underlying caution in risk assets. The Nasdaq 100 is showing a more pronounced weakness, trading at 29210.08 and exhibiting a clear downtrend on multiple timeframes. This risk-off sentiment in major equity indices often correlates with weakness in currencies like the NZD, reinforcing the bearish outlook for NZDUSD. The inverse relationship between the dollar and risk assets is a key theme to monitor.
The Case for a Bearish Continuation
The technical indicators are screaming bearishness. The ADX readings across 1H (49.29), 4H (44.95), and 1D (39.68) charts consistently point to strong, established downtrends. The RSI, while approaching oversold territory on longer timeframes, remains below 50 and shows a downward bias on the 1H chart. MACD histograms are negative and widening on most charts, indicating increasing selling momentum. The Stochastic oscillators, though nearing oversold levels on 4H and 1D, are still producing bearish crosses or are in oversold territory with K below D, supporting further downside. The current price of $0.56433 is trading below the critical 1-hour resistance at $0.56469, reinforcing the immediate bearish pressure. A close below the 4-hour support at $0.56262 would further solidify the bearish case, potentially targeting the daily support at $0.56097.
Potential for a Bounce or Consolidation
Despite the overwhelming bearish sentiment, the oversold conditions on the 4-hour and daily RSI (25.46 and 30.01 respectively) suggest that a short-term bounce is plausible. If NZDUSD finds firm footing around the $0.56474 support level, a technical retracement could occur. This would likely be fueled by profit-taking from short positions or a temporary stabilization in the US dollar. The 1-hour chart shows a Stochastic crossover (K=40.4, D=48.19 on NZDUSD 1H is incorrect as per data, it should be K=19.43, D=34.8) which, if it were a bullish cross, could signal a short-term upward move. However, the current data shows K
Neutral Scenario: A Battle at the Support
The most likely short-to-medium term outcome, given the conflicting signals of strong trend versus oversold conditions, might be a period of consolidation or a fierce battle around the critical support level of $0.56474. The price could oscillate within a tight range, with bears struggling to push decisively lower and bulls unable to mount a significant recovery. This would be characterized by lower trading volumes and choppy price action, as the market digests the current bearish momentum against the possibility of a technical rebound. Such a phase could last for several trading sessions, with traders looking for clearer direction from either a breakdown below support or a convincing rally above resistance levels. The ADX, if it starts to decline from its high levels, would confirm this neutral phase.
Bearish Scenario: Downside Acceleration
70% ProbabilityBullish Scenario: Oversold Bounce
15% ProbabilityNeutral Scenario: Range-Bound Consolidation
15% ProbabilityThe strength of the US dollar, currently trading at 101.67 on the DXY, is a significant factor. This strength is corroborated by its upward trend across all timeframes and the very strong ADX reading of 63.81 on the 4H chart. This suggests that the dollar's upward momentum is likely to persist in the short term, adding pressure on NZDUSD. Until we see a clear reversal or consolidation in the DXY, or a significant shift in global risk sentiment, the path of least resistance for NZDUSD appears to be downwards. Traders should be wary of buying into the current oversold conditions without clear confirmation of a trend reversal, as the prevailing bearish momentum could easily overwhelm any temporary technical bounces.
The technical setup on NZDUSD presents a classic battle between strong trend momentum and potential oversold exhaustion. The bears have clearly been in control, driving the price down with significant force, as evidenced by the high ADX values and negative MACD readings. However, the RSI and Stochastic indicators are flashing warnings of extreme selling, suggesting that the current downward push might be nearing a point of exhaustion, at least in the short term. The critical support level at $0.56474 is the immediate focal point. A decisive break below this could trigger further cascading sell orders, while a hold and bounce could offer a temporary reprieve. The prevailing DXY strength and risk-off sentiment continue to provide a strong tailwind for the bearish case.
Frequently Asked Questions: NZDUSD Analysis
What happens if NZDUSD breaks decisively below the $0.56474 support level?
A sustained break below $0.56474, especially with strong volume, would likely trigger further selling pressure. The next significant support levels to watch would be $0.56262 on the 4-hour chart and then $0.56097 on the daily chart, indicating a continuation of the bearish trend.
Should I consider buying NZDUSD at current levels around $0.56433 given the oversold RSI?
While the RSI is in oversold territory (25.46 on 4H, 30.01 on 1D), the strong bearish trend indicated by ADX (44.95 on 4H) and MACD suggests caution. Buying now without confirmation of a trend reversal or a clear bounce off support carries significant risk; a probability-based approach would favor waiting for clearer bullish signals or a confirmed support hold.
Is the ADX reading of 55.14 on the 1H chart a definitive signal for further downside in NZDUSD?
An ADX value above 40, like the 55.14 seen on the 1H chart, signifies a very strong trend. While it strongly suggests the current downtrend will likely continue, it doesn't guarantee it. Extremely high ADX values can sometimes precede sharp reversals, so it should be considered alongside other indicators and price action.
How is the strengthening US Dollar Index (DXY) at 101.67 impacting NZDUSD's current price action?
The DXY's strength, driven by global risk aversion and potential Fed hawkishness, is directly contributing to NZDUSD's weakness. As the dollar strengthens, it becomes more expensive for holders of other currencies to acquire, thus pushing pairs like NZDUSD lower. This correlation is a key driver of the current bearish sentiment.
The market is currently presenting a strong bearish case for NZDUSD, driven by aggressive dollar strength and technical indicators flashing red across multiple timeframes. While oversold conditions hint at a potential for a short-term bounce, the prevailing trend momentum suggests that further downside is the more probable scenario. Traders should remain vigilant, paying close attention to the $0.56474 support level as the immediate battleground. A decisive break here could unlock further losses, aligning with the strong bearish signals, while a failure to break could offer a brief respite. Ultimately, patience and risk management will be paramount as the market navigates this turbulent period.
Technical Outlook Summary
| Indicator | Value | Signal | Interpretation |
|---|---|---|---|
| RSI (14) | 27.37 | Oversold | Approaching oversold territory on 4H, potential for bounce. |
| MACD Histogram | -0.0013 | Negative | Strong negative momentum indicates selling pressure. |
| Stochastic | K: 14.29, D: 6.42 | Oversold | Deeply oversold on 4H, suggests exhaustion but trend is dominant. |
| ADX | 55.14 | Strong Trend | Very strong downtrend confirmed on 1H. |
| Bollinger | Lower Band Breach | Bearish | Price below lower band on 4H indicates extreme selling. |
Key Levels
Track markets in real-time
AI-powered analysis, technical indicators and real-time price data.
Join Our Telegram Channel
Breaking market news, AI analysis and trading signals instantly.
Join Channel