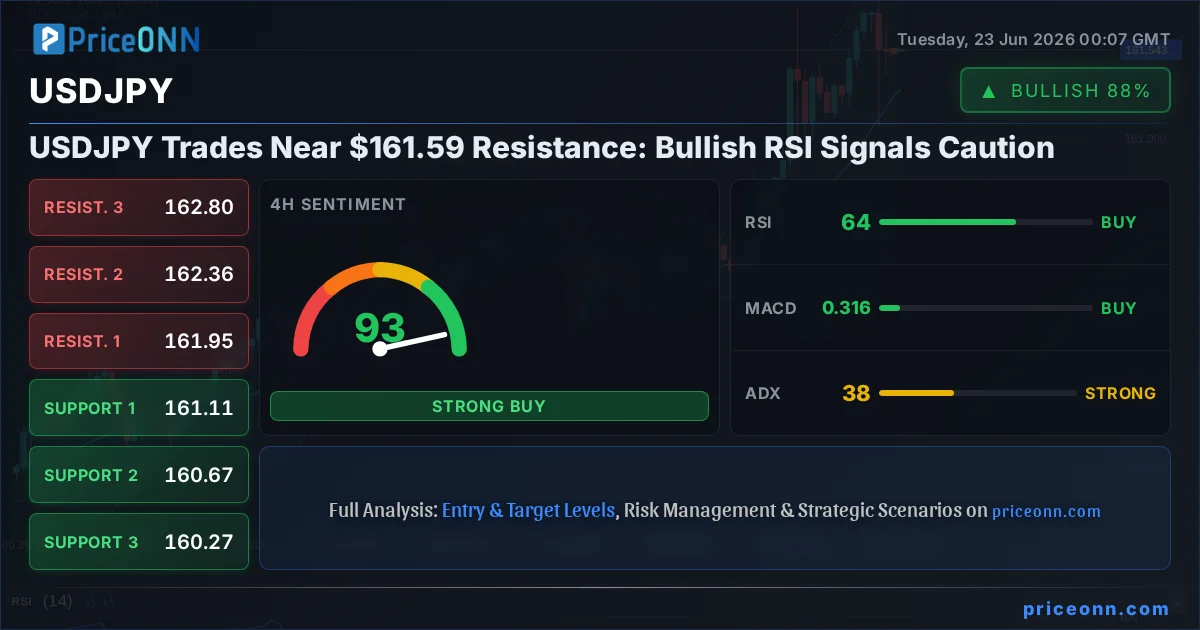
The USDJPY pair is currently locked in a tense battle near the significant resistance level of $161.59. This price point, representing the latest live market data, is a critical juncture that could dictate the pair's short-to-medium term trajectory. While a bullish RSI divergence on the 1-hour chart hints at potential upward momentum, the prevailing bearish sentiment across longer timeframes, coupled with a strong Dollar Index, demands a cautious approach. Understanding the interplay between these technical signals and the broader macroeconomic landscape is crucial for navigating this pivotal moment.
- The USDJPY is trading at $161.59, testing key resistance levels.
- RSI on the 1H chart shows bullish divergence at 52.71, but the 1D trend remains bearish (ADX 37.39).
- The Dollar Index (DXY) is strong at 101.08, reinforcing pressure on USDJPY.
- Upcoming economic data releases, particularly from the US and Japan, will be critical catalysts.
The currency markets are always a dynamic stage, and the USDJPY pair is currently showcasing this with its proximity to a significant resistance zone. At $161.59, the pair is teetering on the edge of what could be a crucial breakout or a sharp reversal. Traders are dissecting every tick, weighing the immediate signals against the backdrop of global economic forces. The strength of the US dollar, as indicated by the Dollar Index (DXY) trading at 101.08, is a major influence, often exerting downward pressure on pairs like USDJPY when it rallies. However, the specific dynamics of the Japanese Yen and US interest rate expectations add layers of complexity to this otherwise straightforward correlation.
Diving into the technical indicators, the 1-hour timeframe presents an interesting, albeit potentially misleading, signal. The Relative Strength Index (RSI) stands at 52.71, which is in the neutral zone but shows a subtle bullish divergence. This typically suggests that while the price might be struggling to make new highs, the underlying momentum isn't fully collapsing. However, relying solely on this short-term indicator would be a mistake. The MACD is currently below its signal line, indicating negative momentum, and the Bollinger Bands suggest a downward bias as the price is trading below the middle band. This paints a mixed picture for the immediate term, but the overall 'SAT' (Sell) signal for the 1H timeframe, with 6 buys, 7 sells, and 0 neutral signals, leans towards caution rather than outright optimism.
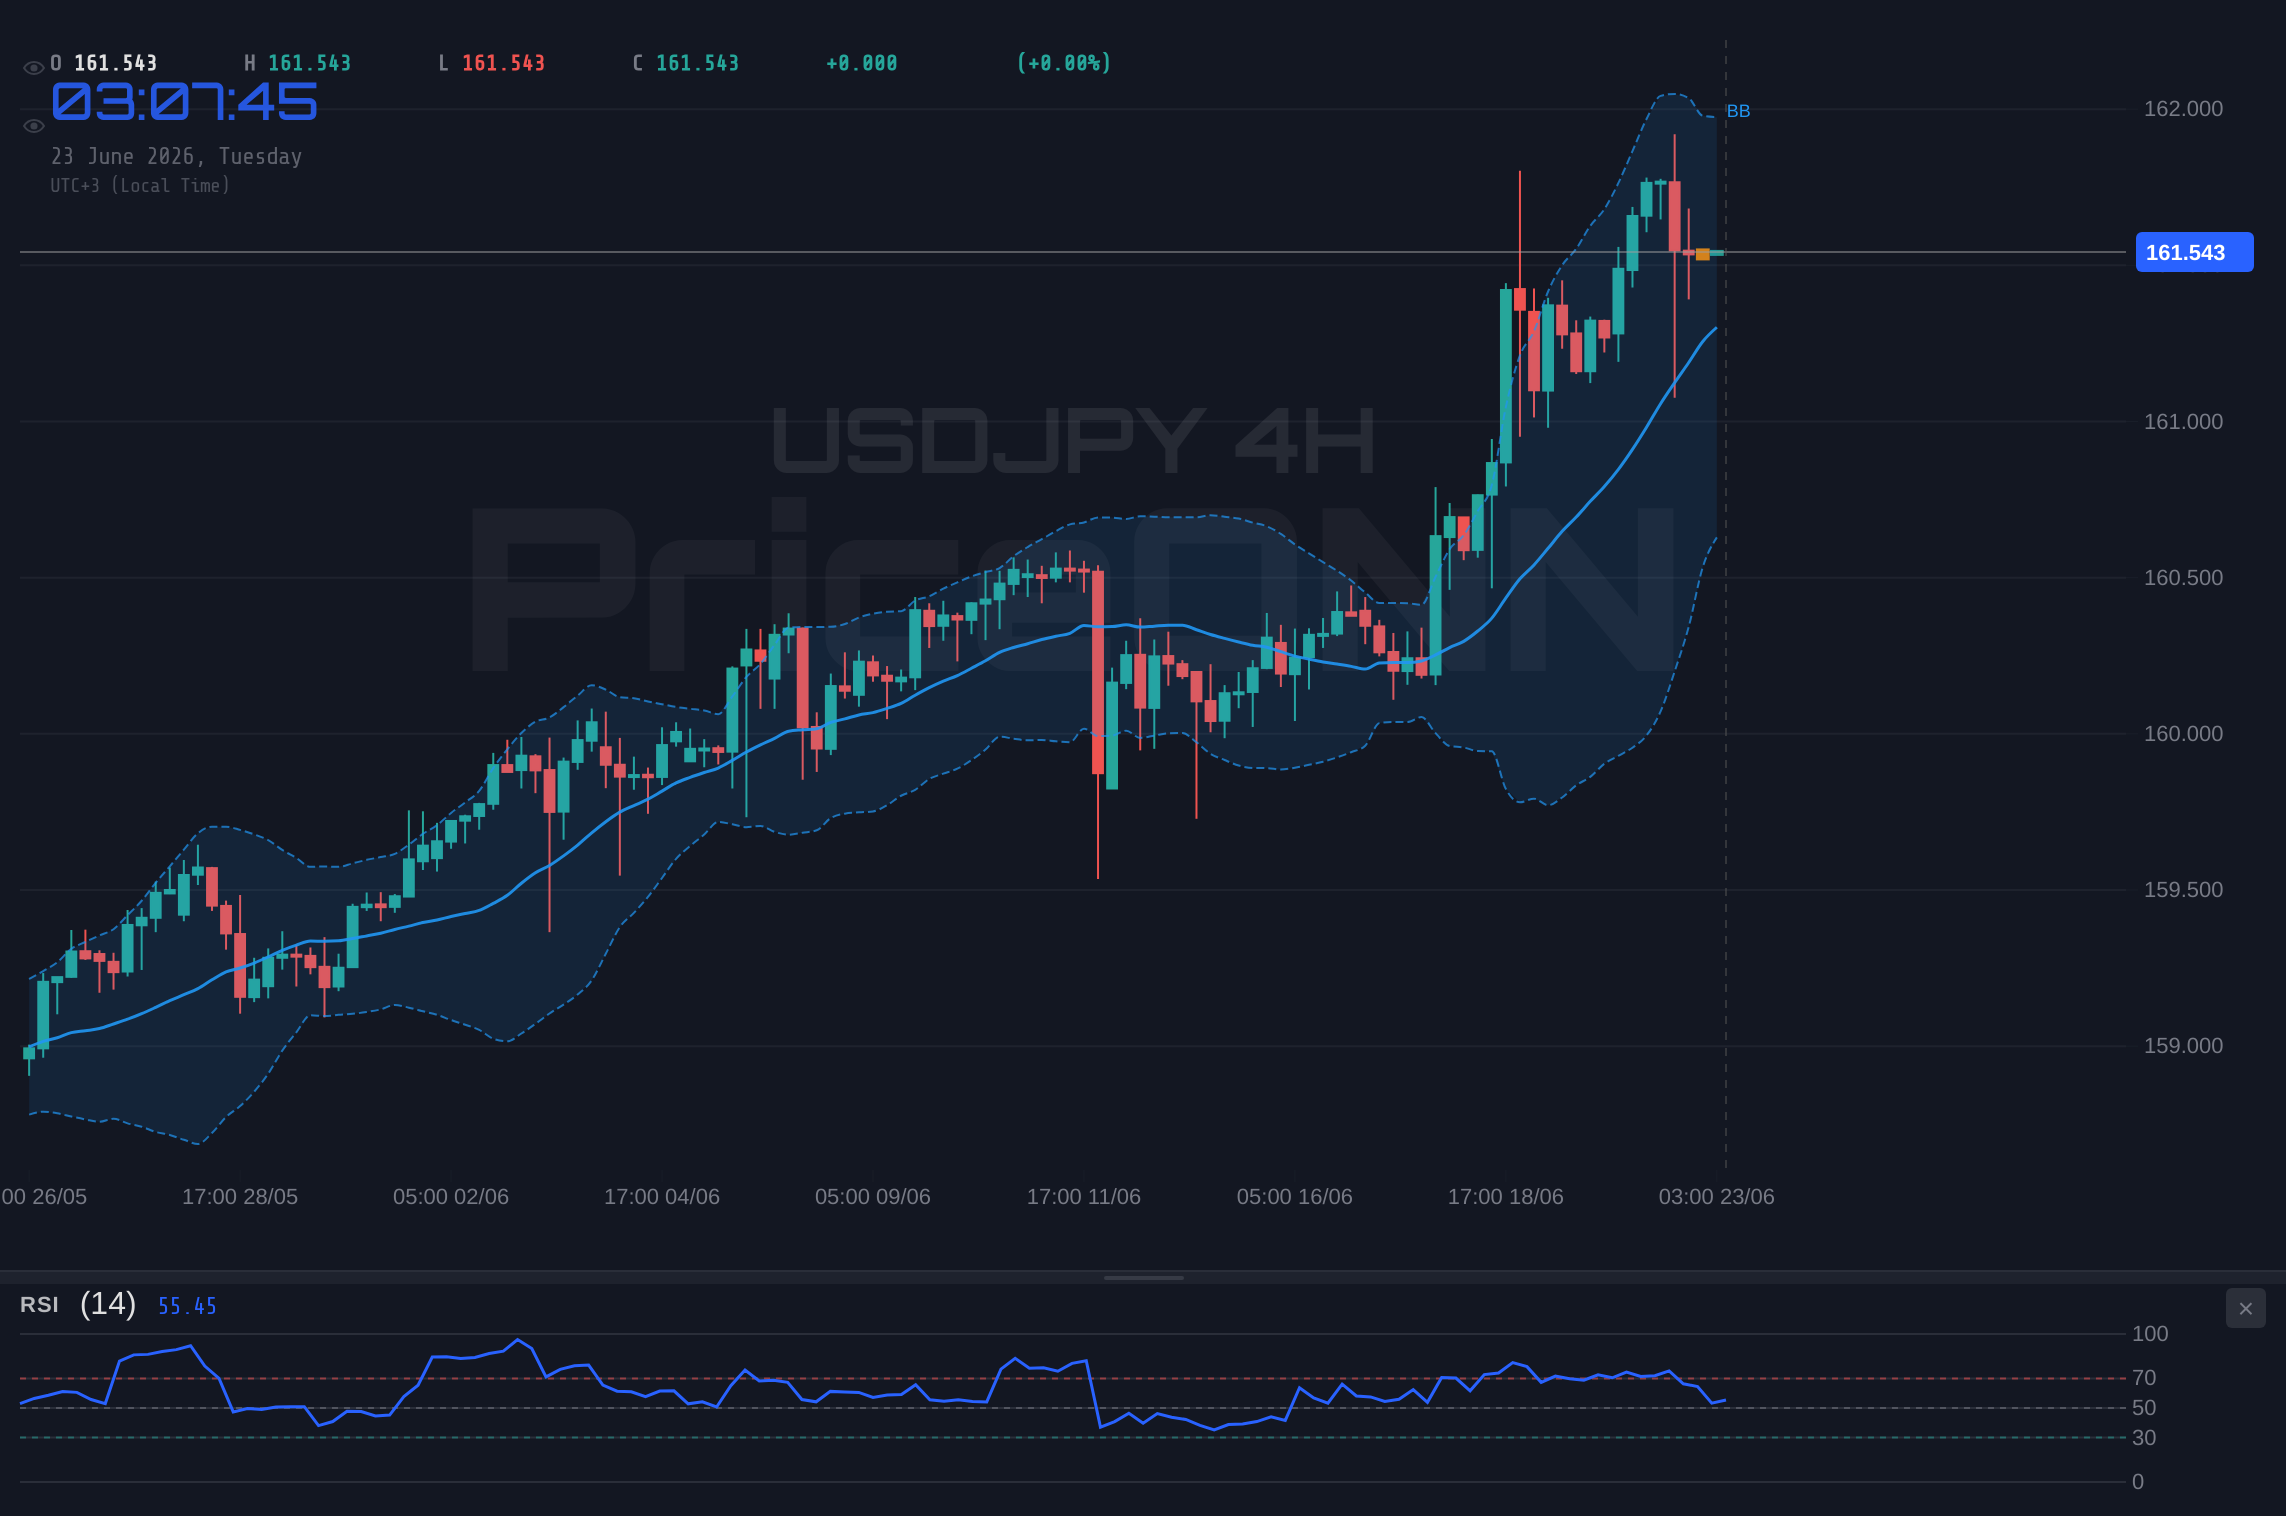
As we extend our view to the 4-hour chart, the technical picture for USDJPY becomes decidedly more bearish, reinforcing the caution signaled by the 1-hour chart's overall sell recommendation. The ADX here registers a robust 38.19, confirming a strong downtrend. While the Stochastic oscillator shows a rising %K line above %D, signaling a potential short-term bounce, this is occurring within the context of a broader downward trend. The RSI at 43.17 also points towards bearish momentum, and the MACD remains firmly in negative territory, below its signal line. The Bollinger Bands are situated below the middle band, further supporting the bearish outlook. This confluence of indicators on the 4-hour timeframe suggests that any upward price action might be a mere correction within a larger downtrend, rather than the start of a significant rally.
The daily chart paints the most definitive picture, and it is overwhelmingly bearish for USDJPY. The trend is clearly defined as bearish with a strength of 94%, and the ADX at 37.39 confirms a strong, established downward trend. The RSI(14) is at 38.17, indicating a lack of bullish conviction and leaning towards further downside potential. The MACD is deeply negative, with its histogram well below the signal line, signaling sustained selling pressure. The Bollinger Bands are also tracking below the middle band, reinforcing the bearish sentiment. The Stochastic oscillator's %K line is below its %D line, providing a further bearish signal. The overall 'SAT' (Sell) signal across all timeframes for USDJPY, with 0 buys, 8 sells, and 0 neutral signals on the daily chart, underscores the prevailing bearish sentiment. This strong daily trend suggests that any short-term fluctuations are likely to be headwinds against a more significant downward move.
The current price action near $161.59 is particularly interesting when viewed against the backdrop of the Dollar Index (DXY). The DXY is currently trading at 101.08, showing a strong upward move of 0.26% for the day. This strength in the dollar typically correlates inversely with pairs like USDJPY, meaning a rising DXY often puts pressure on USDJPY to fall. The fact that USDJPY is even holding near resistance levels despite a strong dollar is noteworthy. It could suggest underlying strength in the yen's fundamentals or perhaps a temporary decoupling due to specific market flows. However, the broader trend indicated by the ADX on the daily chart at 37.39 suggests that the market is favoring sellers, and the strong dollar is likely to continue acting as a headwind for this pair.
From a fundamental perspective, the outlook for USDJPY is heavily influenced by the monetary policy divergence between the US Federal Reserve and the Bank of Japan. The Federal Reserve has maintained a hawkish stance, keeping interest rates elevated to combat inflation, which generally supports the dollar. Conversely, the Bank of Japan has adhered to its ultra-loose monetary policy, though speculation about a policy shift, particularly regarding negative interest rates, is always present. Upcoming economic data from both nations will be critical. For the US, inflation figures and employment reports will dictate Fed expectations, while any hint of policy change from the BoJ could significantly impact the Yen. The market's reaction to these data points will likely determine whether USDJPY breaks above the $161.59 resistance or succumbs to the prevailing bearish technical signals.
The recent news flow provides some context, though not directly impacting USDJPY's immediate price action. Reports of a potential US-Iran framework deal, while having broader geopolitical implications, did not immediately translate into a significant shift for USDJPY in the given data. Similarly, falling gold prices and concerns about the S&P 500's climb suggest a mixed risk appetite environment globally. While these factors contribute to the overall market sentiment, the primary drivers for USDJPY remain centered on interest rate differentials and central bank policies. The commentary around the Strait of Hormuz and India's energy strategy, while important for energy markets, has less direct bearing on the yen's valuation against the dollar in the short term.
Considering the technical indicators across different timeframes, a pattern of conflicting signals emerges, but the longer-term outlook remains predominantly bearish. The 1-hour chart shows a bearish trend with some stochastic bullishness, while the 4-hour chart confirms a strong downtrend. The daily chart is the most telling, displaying a robust bearish trend with multiple indicators aligned for further downside. The ADX on the daily timeframe at 37.39 signifies a strong trend, and with the RSI below 40 and MACD in negative territory, the path of least resistance appears to be downwards. The resistance at $161.59 is therefore a formidable barrier, and a sustained break above it would require significant fundamental shifts or a clear change in market sentiment.
The strength of the Dollar Index at 101.08 cannot be overstated in its influence on USDJPY. As the DXY rallies, it typically exerts downward pressure on USDJPY. This current strength suggests that the dollar is in demand, likely driven by higher US interest rates or a 'risk-off' sentiment in global markets. If this dollar strength continues, it will act as a significant headwind against any bullish aspirations for USDJPY, making the $161.59 resistance level even more challenging to overcome. Traders will be closely monitoring the DXY's next move, as it often provides a leading indicator for pairs like USDJPY.
The current market sentiment appears to be leaning towards caution, particularly when looking at the broader timeframe analysis for USDJPY. While short-term traders might find opportunities in the minor fluctuations, the longer-term trend indicators are flashing red. The overall 'SAT' signal across multiple timeframes, especially the strong bearish conviction on the daily chart, suggests that the risks are skewed to the downside. The resistance at $161.59 is a critical level to watch; a failure to decisively break and hold above it could lead to a retest of lower support levels, such as $161.015, $160.762, or even $160.543 as indicated by the daily support data.
The interplay between technicals and fundamentals presents a complex scenario. Technically, USDJPY is bumping against resistance at $161.59, with longer-term indicators pointing downwards. Fundamentally, the strong dollar, driven by Fed policy, provides a supportive backdrop for continued strength. However, any hint of a policy shift from the Bank of Japan, or a significant change in risk appetite that weakens the dollar, could alter the landscape. The current divergence between the short-term bullish RSI signal and the dominant bearish longer-term trends highlights the uncertainty. This is a market where patience and risk management are paramount.
The question for many traders will be whether the current bullish signals on shorter timeframes, like the stochastic and the 1H RSI divergence, are enough to overcome the overwhelming bearish sentiment on the daily chart. Historically, strong daily trends often override short-term signals, especially when confirmed by other indicators like ADX and MACD. Therefore, a break above $161.59 would need to be accompanied by a significant shift in the underlying fundamentals and a change in the daily technical picture to be considered sustainable. Until then, the $161.59 level remains a key battleground, with the bears holding a tactical advantage.
Looking ahead, the economic calendar will be pivotal. Key US data releases, such as inflation reports and employment figures, will shape Federal Reserve policy expectations and, consequently, the dollar's strength. Simultaneously, any signals from the Bank of Japan regarding monetary policy adjustments could inject volatility into the Yen. The correlation between USDJPY and the DXY will also be closely watched. If the DXY continues its ascent, it will likely cap any upward moves in USDJPY, reinforcing the bearish technical outlook. Conversely, a sudden weakening of the dollar or a hawkish surprise from the BoJ could provide the catalyst for a sustained breakout above $161.59.
Bearish Scenario: Yen Strength Prevails
65% ProbabilityNeutral Scenario: Consolidation Near Resistance
25% ProbabilityBullish Scenario: Dollar Strength Fuels Breakout
10% ProbabilityFrequently Asked Questions: USDJPY Analysis
What happens if USDJPY fails to break above the $161.59 resistance?
If USDJPY fails to sustain its push above $161.59, the bearish trend indicated by the daily chart is likely to continue. This could lead to a retest of the daily support levels, potentially targeting $161.015 or even $160.762 as sellers regain control.
Is the RSI at 52.71 a buy signal for USDJPY right now?
The RSI at 52.71 on the 1-hour chart, showing some bullish divergence, is not a strong buy signal on its own, especially given the dominant bearish trend on longer timeframes. While it might suggest a temporary pause or minor bounce, confirmation from other indicators and a decisive break above resistance would be needed for a sustainable upward move.
How will the strong DXY at 101.08 affect USDJPY this week?
The strong DXY at 101.08 typically exerts downward pressure on USDJPY. This reinforces the bearish outlook, making it more challenging for USDJPY to break and hold above the $161.59 resistance. Traders should monitor the DXY's movement closely as a key driver.
What are the key levels to watch for USDJPY following the FOMC news?
Following the FOMC, key levels for USDJPY are the immediate resistance at $161.59 and potential daily support at $161.015. A decisive break above $161.59, confirmed by broader market sentiment and continued dollar strength, could target $161.953. Conversely, a failure here risks a move towards $161.015.
Track markets in real-time
AI-powered analysis, technical indicators and real-time price data.
Join Our Telegram Channel
Breaking market news, AI analysis and trading signals instantly.
Join Channel