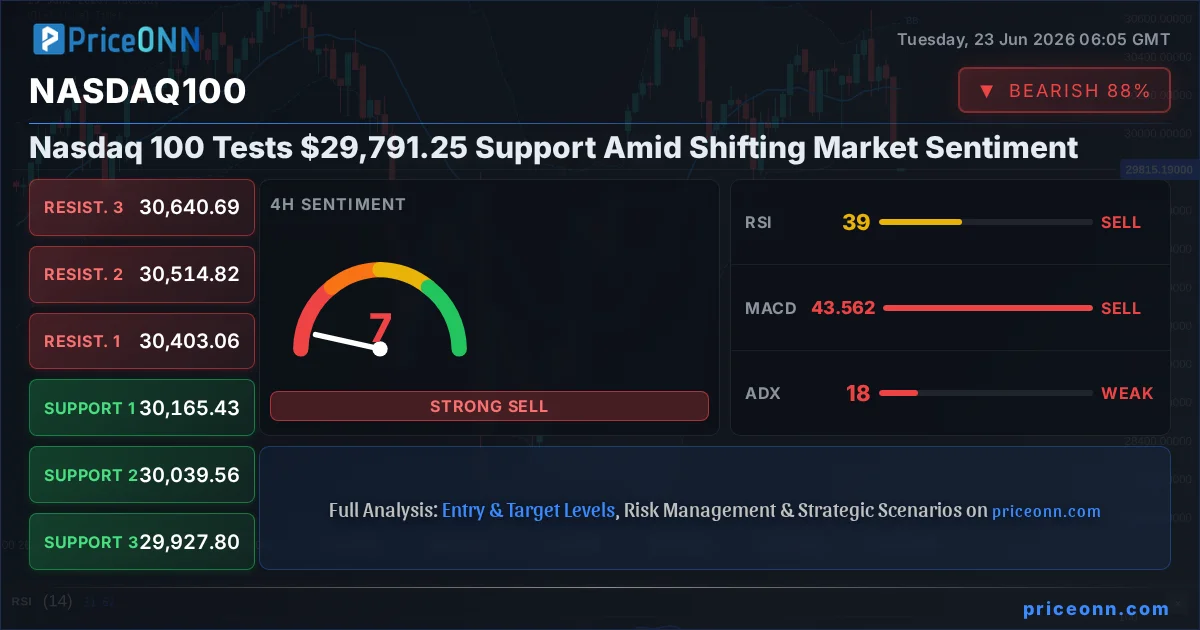
The Nasdaq 100 is currently at a critical juncture, hovering precariously near the $29,791.25 support level. This price point is more than just a number; it's a battleground where bulls and bears are locked in a fierce struggle, with the broader market sentiment leaning towards caution. Having recently experienced a significant daily drop of -1.83%, or $556.71, the tech-heavy index is now facing intense scrutiny. The question on every trader's mind is whether this support will hold, paving the way for a potential recovery, or if the current bearish momentum will force a deeper correction. Understanding the interplay of technical indicators, fundamental drivers, and the ever-present influence of macroeconomic policy is crucial for navigating this complex market landscape.
- RSI at 26.92 on the 1H chart signals oversold conditions, suggesting potential for a short-term bounce.
- Critical support sits at $29,684.50, a level tested multiple times in the recent past, forming a key demand zone.
- MACD histogram showing negative momentum on the 1H chart indicates bearish pressure, though divergence may be forming.
- Fed rate expectations and DXY movements are heavily influencing Nasdaq 100 correlation, with a strong dollar often weighing on tech stocks.
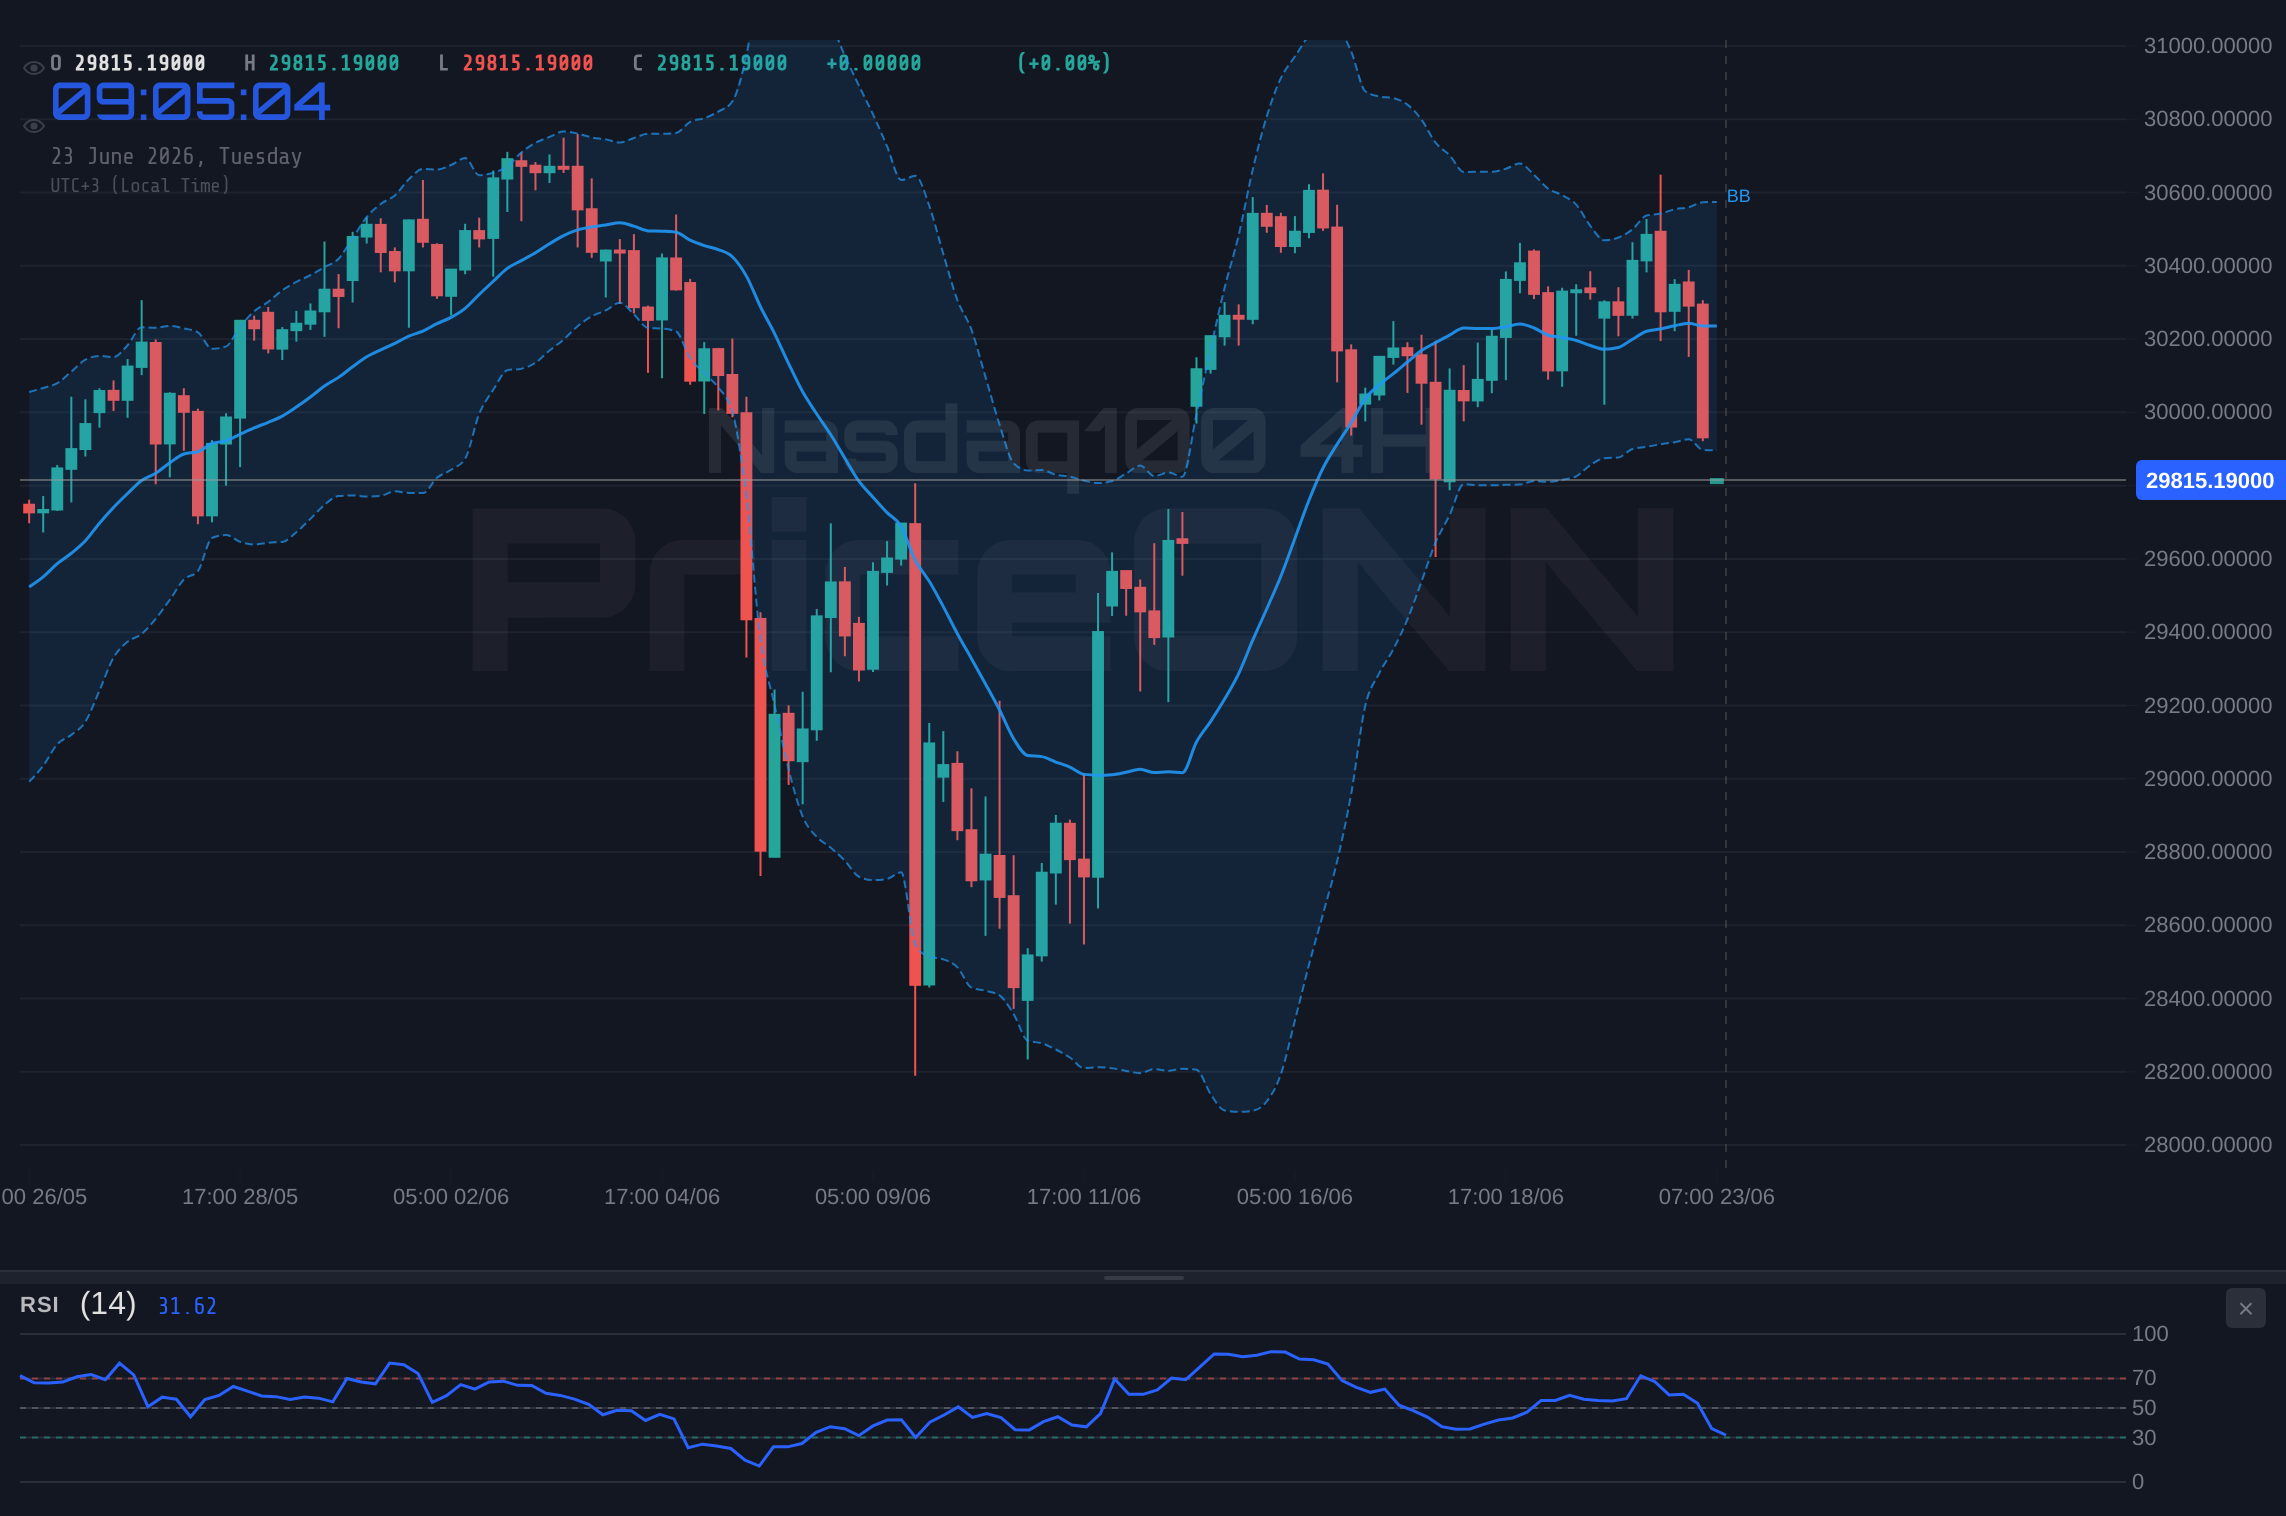
The daily chart paints a concerning picture, showing the Nasdaq 100 in a downtrend with a trend strength of 100%. The index has fallen significantly from its recent highs, and the current price of $29,791.25 is well below the 1D resistance levels, highlighting the bearish pressure. On the 1D timeframe, the RSI stands at 52.31, indicating a neutral stance but with a slight downward bias, suggesting that while the selling pressure might be easing, there's no clear bullish conviction yet. The MACD on the daily chart is also showing negative momentum, lurking below its signal line, which reinforces the cautious outlook. However, the Stochastic indicator on the 1D chart, with K at 79.55 and D at 78.97, is flashing a potential bullish signal as %K moves above %D, and it's nearing overbought territory. This divergence between the MACD and Stochastic on the daily chart is a key point of interest, hinting at a potential shift in momentum that traders are closely watching.
The 4-hour chart, however, presents a slightly different narrative, indicating a bullish trend with 89% strength. This temporal conflict between timeframes is characteristic of choppy, uncertain market conditions. On the 4H, the RSI is at 38.83, still in neutral territory but leaning towards oversold, and the MACD is showing negative momentum below its signal line. The Stochastic at K=31.72 and D=59.91 continues to suggest a bearish signal, reinforcing the overall downward pressure observed on the daily and hourly charts. Yet, the ADX on the 4-hour chart is at a relatively weak 17.83, suggesting that the current trend, whichever direction it may be, lacks strong commitment. This low ADX value is a critical piece of information; it implies that the market is not firmly in a trend, making it susceptible to sharp reversals or consolidations. It's this lack of trend conviction that often precedes significant price movements, as liquidity pools build up and are eventually targeted.
Zooming into the 1-hour chart, we see a bearish trend with 100% strength, with the price currently testing support near $29,684.50. The RSI here is a more telling 26.92, firmly in oversold territory, which is a classic sign that selling pressure may be exhausted in the short term. This could set the stage for a temporary bounce, a 'dead cat bounce' as some traders call it, or the beginning of a more substantial recovery if broader market conditions shift favorably. The MACD is showing negative momentum, but the histogram is narrowing, hinting at a potential slowdown in the bearish move. The Stochastic, with K at 9.41 and D at 20.79, is also deeply oversold, aligning with the RSI's signal. The ADX at 22.72 indicates a moderate downtrend, but again, not one with overwhelming conviction. This confluence of oversold indicators on the hourly chart is significant; it suggests that any immediate downward push might face strong resistance from buyers stepping in to capitalize on perceived value.
Navigating the Dollar's Dominance and Equity Correlations
The broader market context cannot be ignored. The US Dollar Index (DXY) is currently trading at 101.11, showing a daily increase of 0.09%. A strengthening dollar, especially with the DXY showing a strong 98% upward trend on the daily timeframe and reaching overbought levels (RSI 72.75), typically exerts downward pressure on global equities, including the Nasdaq 100. This inverse correlation is a well-established phenomenon; as the dollar becomes more expensive for foreign investors, the perceived value of US assets decreases, leading to potential outflows. The DXY's current position, trading above its 1D middle Bollinger band and showing a strong 35.86 ADX, signifies a robust upward trend. This dollar strength is a significant headwind for the Nasdaq 100, especially as it approaches critical support levels. Traders must monitor the DXY's trajectory closely; a continued ascent could exacerbate the downward pressure on the tech index, while any signs of reversal in the dollar could provide a much-needed tailwind for Nasdaq.
Furthermore, the performance of other major US indices provides crucial context. The S&P 500, while showing a daily gain of 0.74% and trading at 6572.87, is exhibiting mixed signals across timeframes. On the 1D chart, it shows a bearish trend with 100% strength, but on the 4H, it displays a neutral trend. The Nasdaq 100's performance, particularly its significant daily drop of -1.83%, suggests that the tech sector is bearing the brunt of any market rotation or risk-off sentiment. The Dow Jones Industrial Average, currently at 51541, also shows a mixed picture with a bullish trend on the daily but a neutral trend on the hourly. This divergence across indices indicates sector-specific weakness, with technology stocks appearing more vulnerable. The Nasdaq 100's heavy weighting towards growth and tech companies makes it particularly sensitive to interest rate expectations and shifts in risk appetite, which are currently being heavily influenced by the DXY's strength and broader macroeconomic data.
The Influence of Central Bank Policy and Inflation Concerns
The macroeconomic backdrop remains a dominant force shaping market behavior. Federal Reserve policy expectations are paramount. While the Fed has indicated a pause in rate hikes, the persistent inflation figures and the Fed's cautious stance on future moves continue to fuel uncertainty. Chicago Fed President Austan Goolsbee's recent comments, as reported by forex news, highlight the key challenge: determining whether inflation will remain anchored at the 3%-4% range. This uncertainty directly impacts the Nasdaq 100, as higher-for-longer interest rate scenarios generally put pressure on growth stocks by increasing borrowing costs and reducing the present value of future earnings. The market is constantly repricing these expectations, leading to volatility. Any new data suggesting sticky inflation could lead to a reassessment of Fed policy, potentially causing further declines in the Nasdaq 100. Conversely, signs of cooling inflation could bolster hopes for rate cuts, providing a much-needed reprieve.
The correlation with bond yields is also a critical factor. Rising Treasury yields tend to make fixed-income investments more attractive relative to equities, particularly growth stocks with long-duration earnings profiles. While specific yield data isn't provided, the general trend of yields has a significant impact. If yields are trending upwards due to inflation concerns or hawkish central bank rhetoric, this would add another layer of pressure on the Nasdaq 100. The market's sensitivity to these macroeconomic indicators means that upcoming economic data releases, such as employment figures or inflation reports, will be closely scrutinized for any clues about the future path of monetary policy and its implications for the tech sector.
Technical Breakdown: What the Indicators Are Saying
Let's delve deeper into the technical signals. On the 1-hour chart, the RSI at 26.92 is screaming 'oversold,' suggesting a potential short-term reversal. However, the MACD is still printing negative momentum, and the ADX at 22.72 indicates a moderate downtrend. The Stochastic, with K at 9.41 and D at 20.79, is also deeply oversold. This suggests that while a bounce is possible, it might lack follow-through unless confirmed by other factors. The immediate support level to watch is $29,684.50, a price that has historically acted as a floor. A break below this could trigger further selling towards $29,401.56, the next significant support on the daily chart.
The 4-hour chart presents a slightly more nuanced picture. The RSI at 38.83 is neutral, but the MACD's negative momentum and the Stochastic's bearish signal (K=31.72, D=59.91) point towards continued downside. The ADX at 17.83 here is particularly interesting, signaling a weak trend. This means the market isn't strongly committed to the current direction, making it prone to reversals. If the price can hold above the $29,791.25 level and then push towards the 4H resistance at $30,050.24, it could signal a shift. However, the overarching bearish sentiment and the strong downtrend on the daily chart suggest caution is warranted. The key is to watch for confirmation; a sustained move above the hourly resistance at $30,050.24 would be the first sign of a potential short-term recovery.
On the daily timeframe, the picture is undeniably bearish, with a 100% trend strength indicating significant downside. The RSI at 52.31 is hovering near the neutral zone, but the MACD is negative, and the Stochastic (K=79.55, D=78.97) is showing a bullish divergence as %K crosses above %D, nearing overbought conditions. This divergence is a critical signal. It suggests that the recent selling momentum might be losing steam, and a potential upward correction could be on the horizon. However, this divergence alone is not a buy signal. It needs confirmation from price action, such as a decisive break above resistance levels, and a shift in broader market sentiment. The daily support level at $29,401.56 is a crucial line in the sand; a break below this would invalidate any near-term bullish hopes and likely send the Nasdaq 100 much lower.
Scenario Analysis: Charting the Path Forward
Bearish Scenario: Downside Pressure Mounts
70% ProbabilityNeutral Scenario: Consolidation Around Key Levels
20% ProbabilityBullish Scenario: Support Holds, Recovery Begins
10% ProbabilityThe current technical setup, with multiple oversold indicators on shorter timeframes and a potential bullish divergence on the daily RSI, suggests that a bounce from the $29,791.25 area is plausible. However, the overarching bearish trend on the daily chart, coupled with dollar strength and cautious central bank signaling, makes any upside move suspect. The most probable scenario involves continued pressure, with a test of the $29,684.50 support. A break below this level would likely accelerate the decline, targeting $29,401.56. Conversely, if the $29,684.50 support holds firm and the index can push back above $30,050.24, it could signal the start of a short-term recovery, potentially targeting higher resistance levels. The key for traders is to remain vigilant, manage risk meticulously, and wait for clear confirmation before committing to a direction. Patience will be rewarded as the market digests recent price action and looks for fundamental catalysts to drive its next significant move.
Frequently Asked Questions: Nasdaq100 Analysis
What happens if Nasdaq 100 breaks below the $29,684.50 support level?
A break below $29,684.50 on the Nasdaq 100 would invalidate the current support and likely trigger further downside momentum. The next significant support level to watch would be $29,401.56 on the daily chart, as the bearish trend would be reinforced.
Should I consider buying Nasdaq 100 at current levels near $29,791.25 given the oversold RSI?
While the 1-hour RSI at 26.92 suggests oversold conditions, the overall bearish trend and negative MACD momentum warrant caution. A buy-in at current levels lacks confirmation; waiting for a clear bounce off $29,684.50 or a break above $30,050.24 resistance would provide a more robust entry signal.
Is the RSI at 52.31 on the daily chart a sell signal for Nasdaq 100 right now?
An RSI of 52.31 on the daily chart is considered neutral, indicating neither strong bullish nor bearish conviction. While it leans slightly towards a downward bias, it's not a direct sell signal. Confirmation from other indicators like MACD and price action above key resistance levels would be needed for a stronger bearish thesis.
How will the Fed's stance on inflation impact Nasdaq 100 this week?
Chicago Fed President Goolsbee's comments on inflation remaining at 3-4% suggest the Fed's policy might remain hawkish or at least data-dependent. If upcoming data reinforces sticky inflation, it could lead to expectations of prolonged higher interest rates, pressuring the Nasdaq 100 further as growth stock valuations are sensitive to borrowing costs.
Track markets in real-time
AI-powered analysis, technical indicators and real-time price data.
Join Our Telegram Channel
Breaking market news, AI analysis and trading signals instantly.
Join Channel