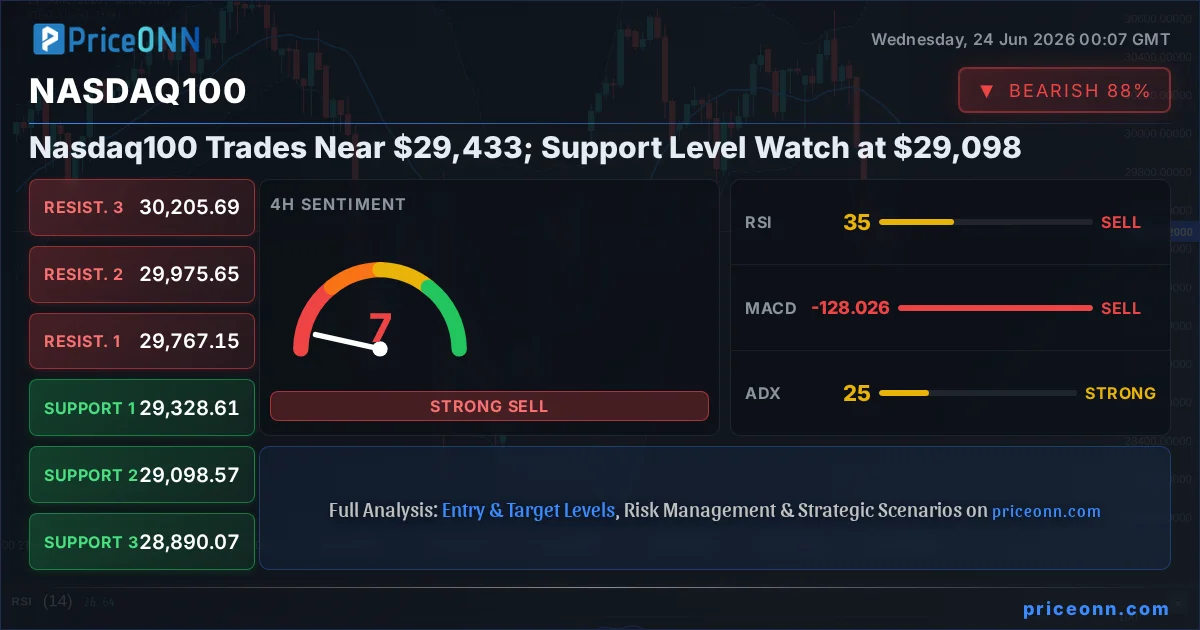
The Nasdaq100 is currently navigating choppy waters, trading near the critical $29,433 mark. This tech-heavy index, a barometer for innovation and growth stocks, finds itself at a pivotal juncture. While recent price action has shown resilience, the underlying technical indicators and broader market correlations suggest that significant volatility may lie ahead. The question on every trader's mind is whether the current levels can hold, or if a deeper correction is on the horizon. This analysis delves into the nuanced technical picture, the correlated market movements, and the fundamental underpinnings that could dictate the Nasdaq100's next major move.
- RSI at 34.13 on the 4H chart signals potential for further downside before a bounce.
- Critical support sits at $29,098.33, a level that has seen significant price action in the past.
- MACD histogram is negative on the 4H, indicating bearish momentum is currently in control.
- Fed rate expectations are influencing the Nasdaq100's correlation with the DXY, which is strengthening.
Navigating the Nasdaq100's Current Crossroads
The Nasdaq100's current position around $29,433.16 presents a complex trading scenario. After a notable daily decline of -3.01%, the index is showing signs of stabilization, but the overall sentiment remains cautious. The 1-hour chart indicates a neutral trend with a 50% strength, but this masks a more dominant bearish momentum on the higher timeframes. The ADX at 51.53 on the 1-hour chart signifies a strong trend, albeit a bearish one, suggesting that the recent pullback has significant momentum behind it. This divergence between the short-term neutrality and the longer-term bearish signals is precisely where traders need to focus their attention. Understanding the interplay between these timeframes is crucial for deciphering the immediate path forward.
The daily chart paints an even more telling picture. Despite a technically bullish long-term trend, the current price action is firmly within a 100% bearish trend on the daily timeframe. This suggests that the prevailing sentiment is one of caution, and any upward movements might be short-lived corrections within a larger downtrend. The RSI(14) at 49.03 on the daily chart is hovering around the neutral 50 level, offering little conviction for either bulls or bears. However, the MACD is showing negative momentum, with the MACD line below the signal line, further reinforcing the bearish outlook. The Bollinger Bands on the daily chart are also positioned below the middle band, indicating a bearish bias and potential for further downside exploration.
The Influence of Macroeconomic Currents
The Nasdaq100, being heavily weighted towards technology and growth stocks, is particularly sensitive to macroeconomic shifts, especially those related to interest rates and inflation. The current strength in the US Dollar Index (DXY), which is trading at $101.43 and showing a strong upward trend on all timeframes, is a significant headwind. A stronger dollar typically puts pressure on growth assets like the Nasdaq100, as it increases the cost of capital and reduces the present value of future earnings. The DXY's RSI at 73.41 on the 1-hour chart and 76.89 on the 4-hour chart clearly indicates an overbought condition, suggesting a potential for a near-term pullback in the dollar. However, the robust ADX values (27.6 on 1H, 57.97 on 4H) confirm a powerful upward trend that is currently dominating market sentiment.
Central bank policy remains a dominant theme. While specific central bank meeting minutes or rate decisions are not provided in the immediate market data, the general expectation of a hawkish stance from major central banks, particularly the Federal Reserve, continues to influence market dynamics. Higher interest rates make future earnings less attractive, directly impacting the valuation of Nasdaq100 constituents. The market is constantly pricing in potential rate hikes or holds, and any deviation from expectations can trigger significant price swings. Investors are closely watching economic indicators such as inflation (CPI, PCE) and employment (NFP) to gauge the Fed's next move. Signs of persistent inflation or a tightening labor market could embolden the Fed to maintain a tighter monetary policy, further pressuring growth stocks.
Correlations and Contradictions: Decoding the Signals
The Nasdaq100's relationship with other major indices and assets provides crucial context. The S&P 500 is trading at $6,572.87 with a mixed daily trend, while the Dow Jones Industrial Average is at $51,667.50, showing a generally bullish trend. However, the Nasdaq100's sharp 3.01% decline stands out, suggesting that the tech sector is currently bearing the brunt of the selling pressure. This divergence implies that investors might be rotating out of high-growth, high-valuation tech stocks and into more value-oriented or defensive sectors. The correlation between the Nasdaq100 and the broader risk appetite, often reflected in the S&P 500, is something to monitor closely. A sustained weakening in the S&P 500 could further exacerbate the Nasdaq100's decline.
Looking at commodities, Gold (XAUUSD) is trading at $4,102.91, down significantly by -2.11%. This sharp drop in gold, typically a safe-haven asset, might indicate a shift in market sentiment, perhaps a temporary increase in risk appetite or a reassessment of inflation expectations. Silver (XAGUSD) is also under pressure, trading at $61.64, down -5.24%. The weakness in precious metals, coupled with a strengthening dollar, paints a picture of a market environment that is less conducive to risk assets. The energy sector, with Brent Crude at $76.37 and WTI at $73.39, is also experiencing declines, suggesting potential concerns about global demand or easing geopolitical tensions, although the latter is often a double-edged sword.
Analyzing the Technical Landscape
On the 1-hour chart, the Nasdaq100's ADX is at 51.53, confirming a strong trend. However, the RSI at 37.92 suggests room for further downside before hitting oversold territory. The MACD is showing positive momentum on this timeframe, but it's crucial to remember the influence of higher timeframes. The Stochastic K value at 29.66 and D value at 27.31 indicate a potential for a short-term bounce, but the overall trend remains the dominant factor.
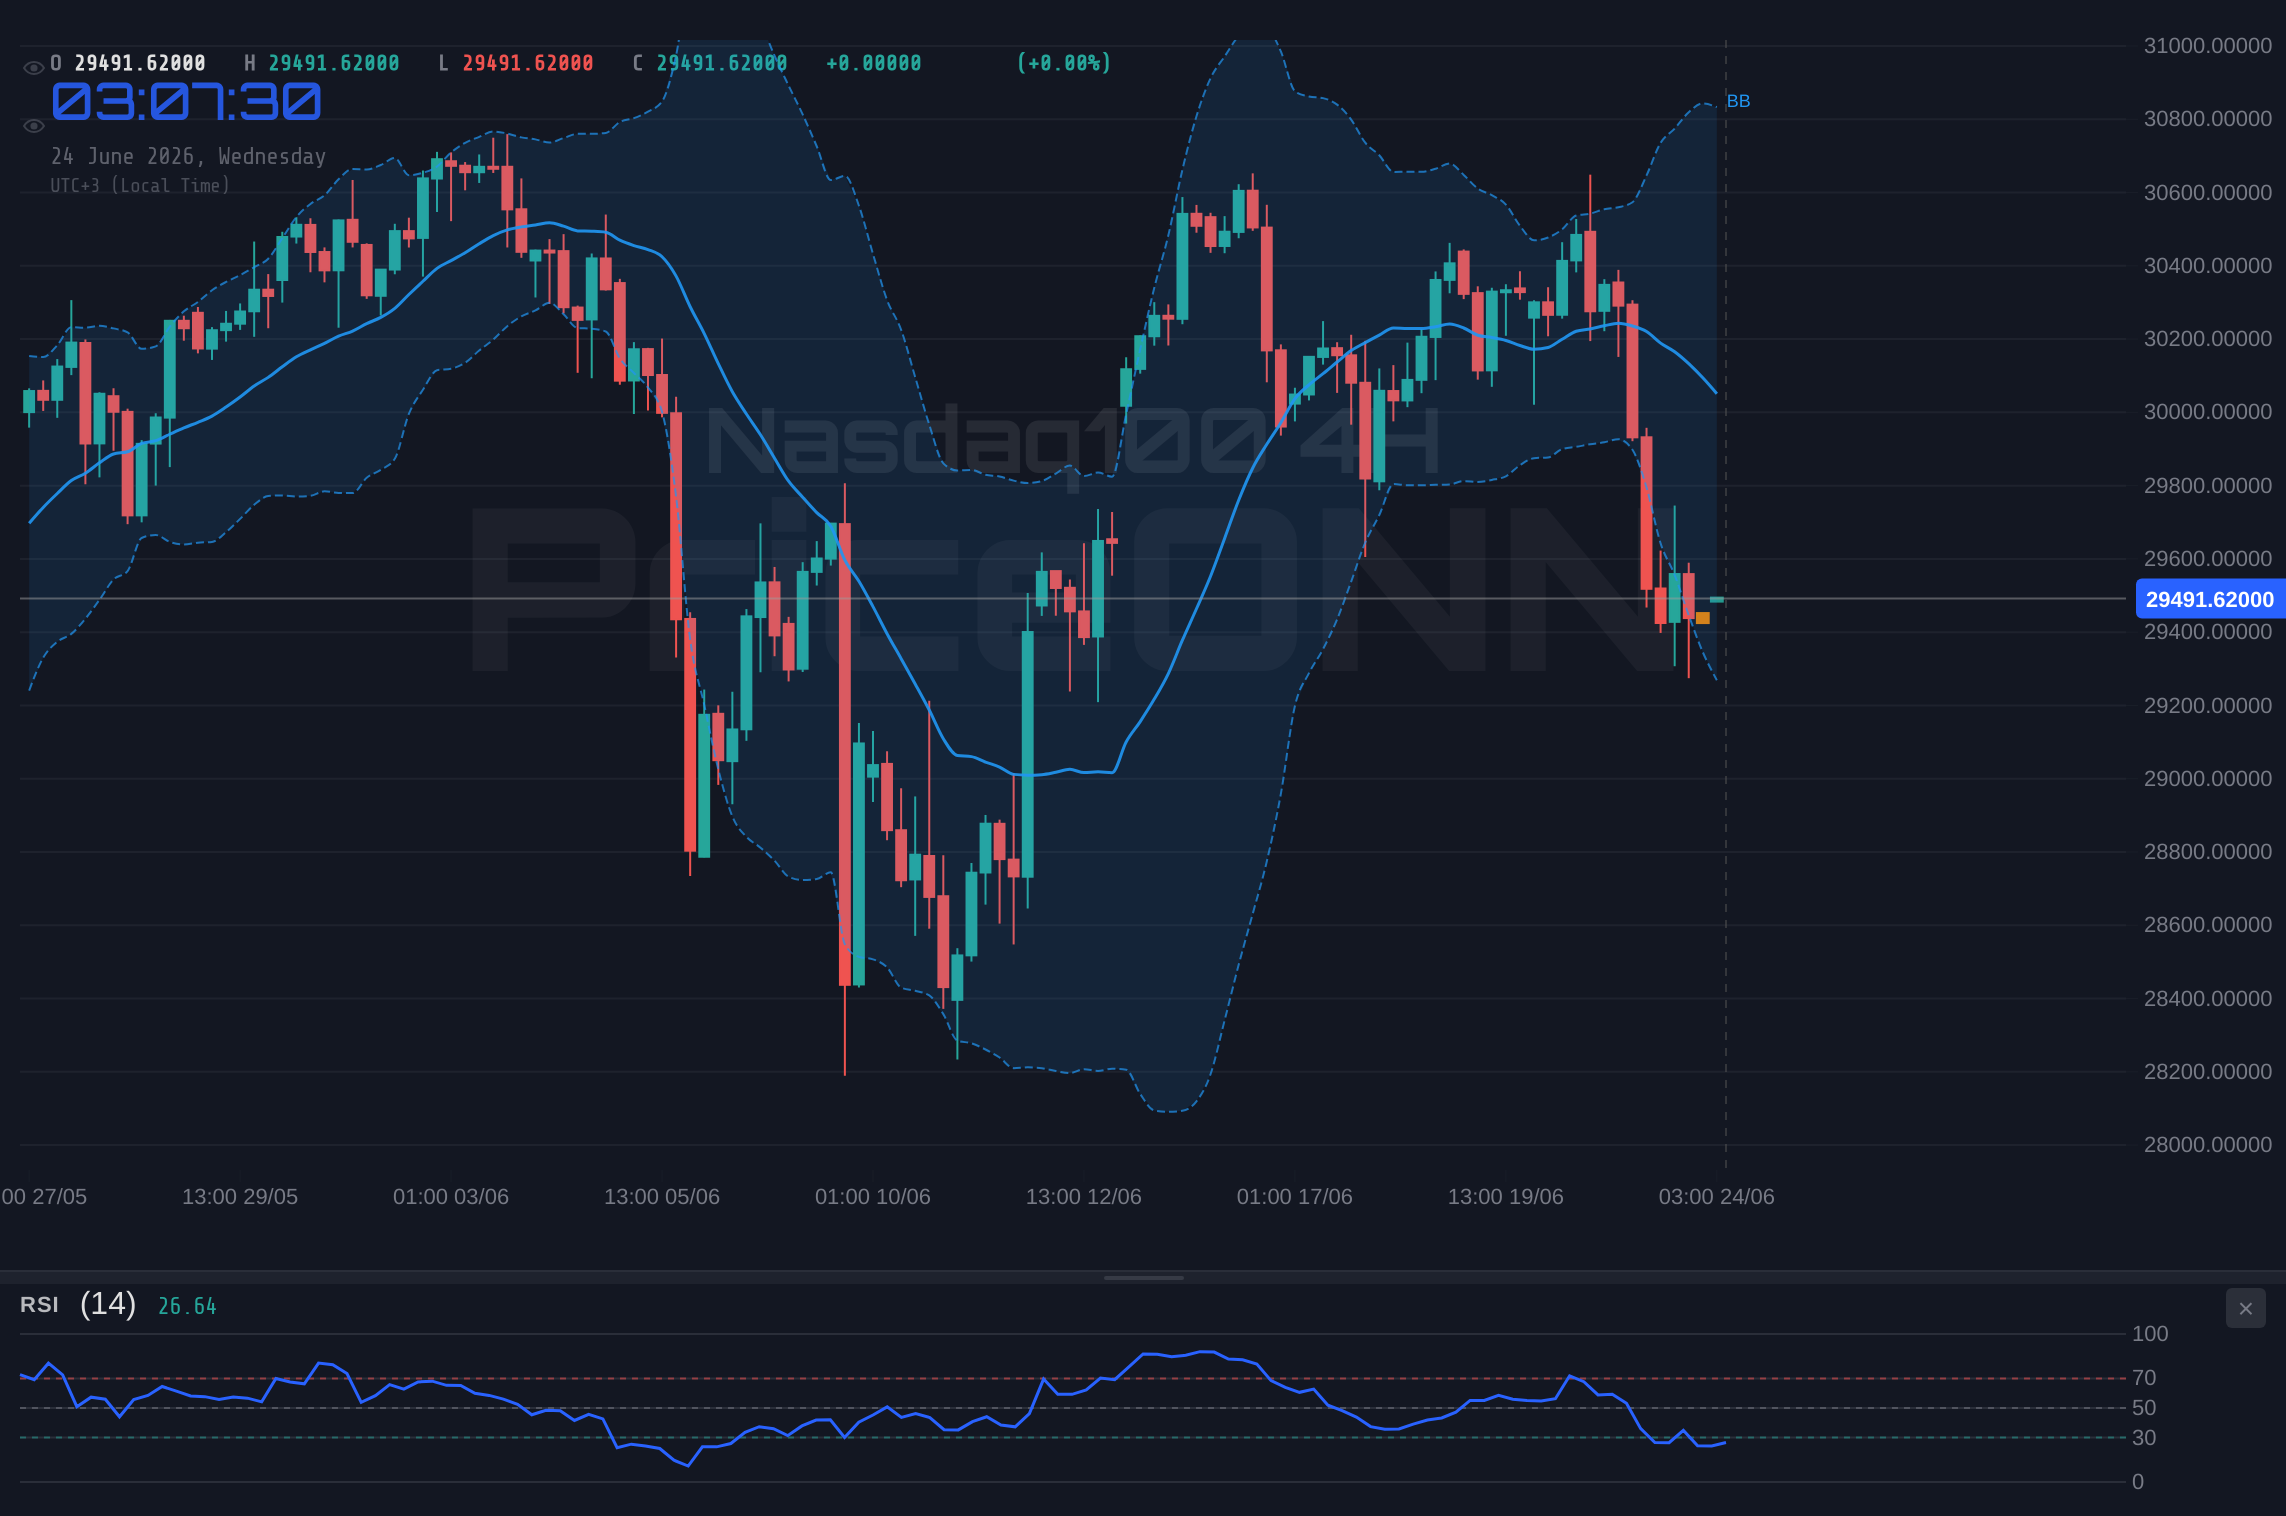
The 4-hour chart provides a more concerning outlook. The ADX at 25.23, while indicating a trend, is in a range that could precede a more significant move. The RSI at 34.13 reinforces the notion that the market is not yet oversold and could continue to drift lower. The MACD is firmly in negative territory, and the Stochastic K (10.82) and D (19.27) are deep in oversold territory, suggesting that a bounce is possible, but it would likely be against the prevailing trend. The support level at $29,098.33 is a key area to watch on this timeframe; a break below it could signal a more aggressive sell-off.
The daily chart presents a more complex picture, with a strong bearish trend despite the overall long-term bullish structure. The RSI at 49.03 is neutral, offering no clear signal. The MACD's negative momentum and the Stochastic K (74.62) and D (78.14) showing a bearish crossover in overbought territory suggest that the upward momentum seen on lower timeframes might be fading. The critical support level on the daily chart is at $29,401.56, and a decisive close below this could open the door to further declines towards $29,098.33 and subsequently $28,890.07.
Key Levels and Potential Scenarios
The $29,098.33 level is a critical support zone. A failure to hold this level on the 4-hour chart could trigger a cascade of selling, pushing the index towards the next significant support at $28,890.07. On the other hand, if the bulls manage to defend the current price action and initiate a recovery, resistance at $29,767.15 and $29,975.65 will be the immediate hurdles. A decisive break and hold above these levels, especially on increased volume, would be necessary to invalidate the bearish short-to-medium term outlook. The 1-hour chart shows resistance at $29,468.02, $29,565.19, and $29,636.51, which represent immediate areas where price could stall.
Bearish Scenario: Approaching the Abyss
65% ProbabilityConsolidation Scenario: Waiting for Clarity
25% ProbabilityBullish Scenario: A Fleeting Recovery?
10% ProbabilityFrequently Asked Questions: Nasdaq100 Analysis
What happens if the Nasdaq100 breaks below the $29,098.33 support level?
A break below $29,098.33 on the 4-hour chart would invalidate the neutral scenario and likely trigger the bearish scenario. This could lead to a rapid decline towards the $28,890.07 and $28,711.18 support levels as sellers gain control.
Should I consider buying Nasdaq100 at current levels around $29,433 given the RSI at 34.13?
While the RSI is approaching oversold territory on the 4H chart, the daily chart still shows room for downside. A contrarian buy at these levels carries significant risk unless confirmed by a strong bullish price action pattern or a clear break of immediate resistance at $29,767.15.
Is the MACD histogram negative on the 4H chart a strong sell signal for Nasdaq100?
The negative MACD histogram on the 4-hour chart indicates bearish momentum is currently dominant. While it suggests selling pressure, it's best used in conjunction with other indicators and price action. A confirmed breakdown below key support levels would strengthen this sell signal.
How might the strengthening DXY at $101.43 impact Nasdaq100 this week?
The rising DXY often correlates with a risk-off environment, putting pressure on growth assets like the Nasdaq100. If the dollar continues its ascent, it could exacerbate any existing downward pressure on the index, making it harder for bulls to defend key support levels.
Track markets in real-time
AI-powered analysis, technical indicators and real-time price data.
Join Our Telegram Channel
Breaking market news, AI analysis and trading signals instantly.
Join Channel