Is the $61,385 level a temporary pause or the precursor to a deeper dive for Bitcoin? The current market data paints a grim picture, with multiple timeframes aligning under a dominant bearish trend. While oversold conditions beckwons, the strength of the current downtrend suggests caution is paramount for traders eyeing this critical juncture.
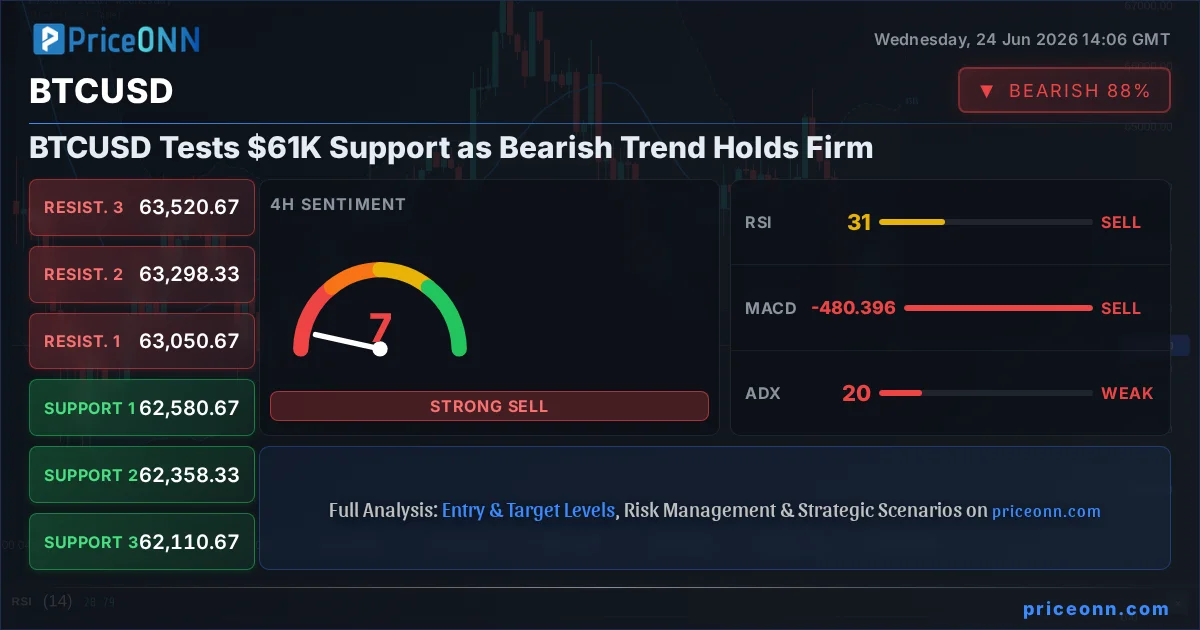
- BTCUSD is currently trading at $61,385.00, showing a strong bearish trend across 1H, 4H, and 1D timeframes.
- The 1-Day RSI at 33.68 indicates a neutral-to-bearish sentiment, while the ADX at 32.26 confirms a strong downtrend.
- Key support for BTCUSD is identified at $61,449, with a break below this level potentially targeting $60,424.
- Resistance is currently faced around $63,991, but the prevailing bearish momentum makes a sustained rally unlikely without significant shifts.
- The US Dollar Index (DXY) is strong at 101.68, reinforcing the risk-off sentiment impacting cryptocurrencies.
The digital asset market is currently under intense pressure, with Bitcoin (BTCUSD) leading the charge downwards. Trading at exactly $61,385.00, BTCUSD has been on a steady decline, a narrative echoed across its technical indicators and market correlations. The question on every trader's mind isn't just about the immediate price action, but whether this current bearish trend has the legs to extend further, or if the oversold conditions will eventually spark a much-needed reprieve. My analysis today delves into the intricate details of BTCUSD's technical landscape, exploring the probabilities of various scenarios playing out in the short to medium term.
Looking at the 1-hour chart, the trend is undeniably bearish, supported by a robust 86% strength. The Relative Strength Index (RSI) at 29.98 hovers in oversold territory, a signal that often precedes a bounce. However, the Moving Average Convergence Divergence (MACD) histogram is negative, and price action is confined below the middle Bollinger Band, indicating selling pressure remains dominant. The Stochastic Oscillator, with %K at 35.54 and %D at 36.03, also leans towards further downside, despite the oversold RSI. The Average Directional Index (ADX) at 22.02 suggests a moderately strong downtrend, but the overall picture is one of caution rather than immediate capitulation.
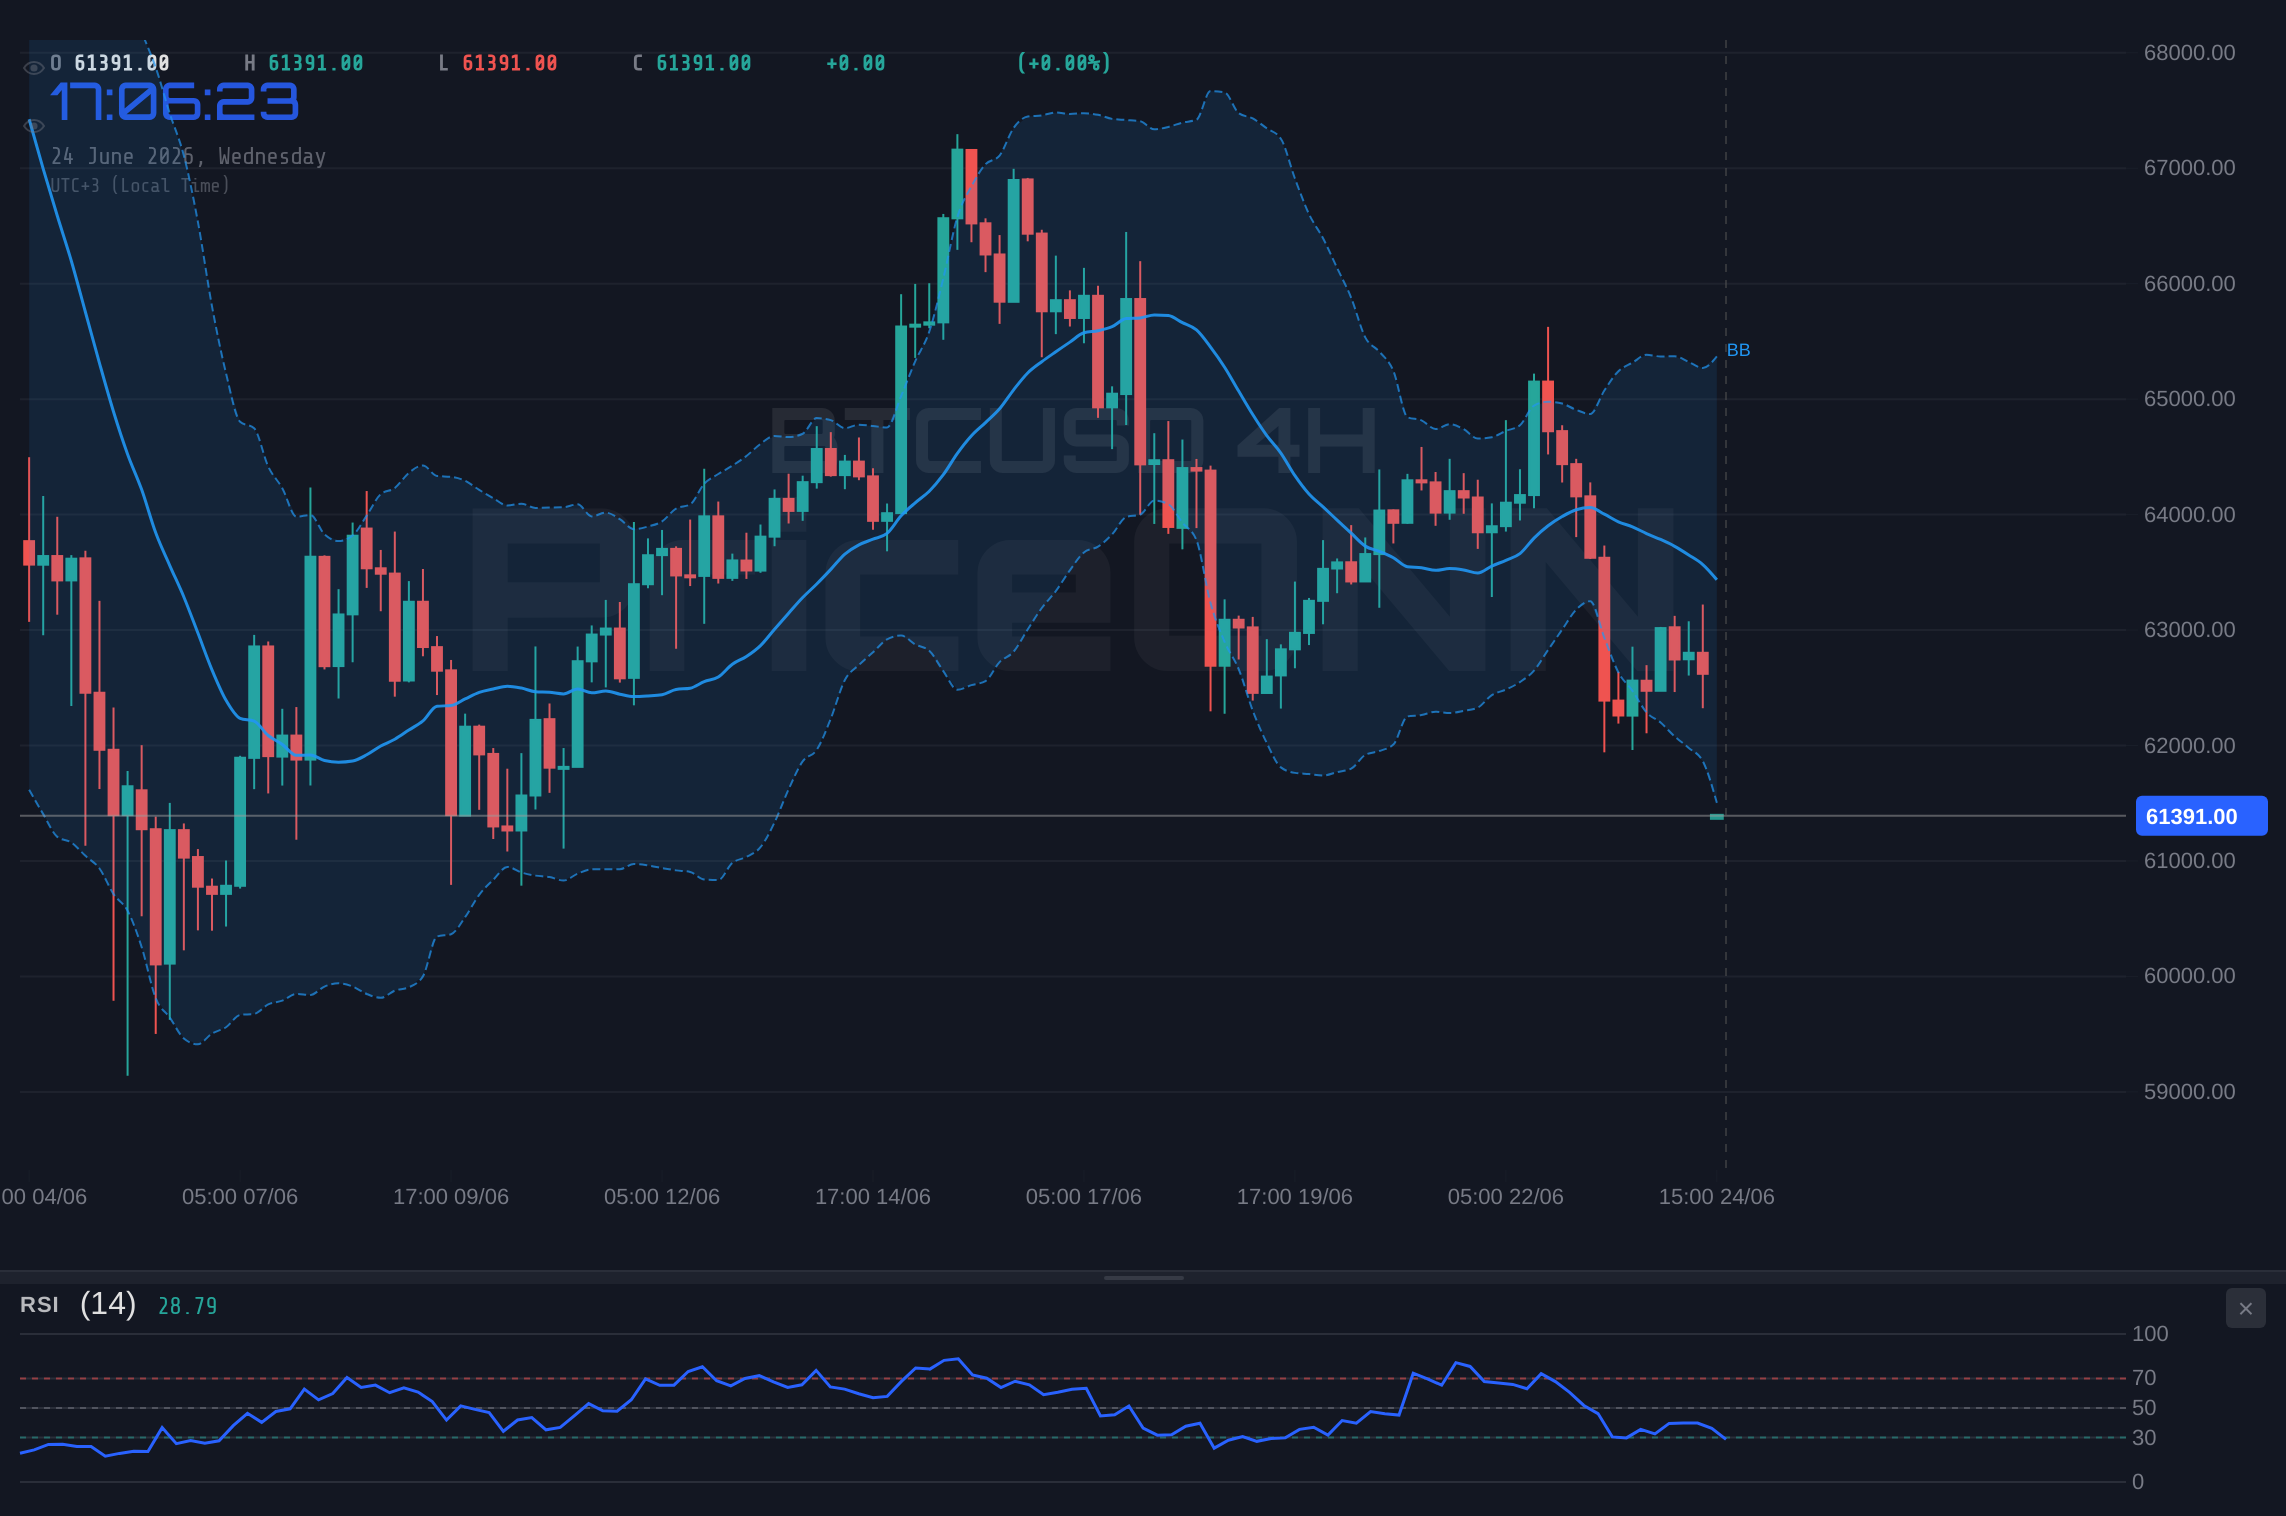
The situation intensifies when we shift to the 4-hour timeframe. Here, the bearish trend maintains an 85% strength, reinforcing the short-term outlook. The RSI sits at 31.54, still in the neutral-to-oversold zone, while the MACD continues to show negative momentum below its signal line. Price is also hugging the lower Bollinger Band, a classic sign of bearish pressure. Interestingly, the Stochastic Oscillator's %K (20.76) has crossed above its %D (20.22), hinting at a potential short-term bullish divergence within this timeframe. However, the ADX at 19.64 signifies a weaker trend compared to the 1-hour chart, suggesting a period of consolidation or indecision might be on the horizon before the next significant move.
The daily chart provides the most crucial context for understanding the broader market sentiment. The trend here is also bearish, albeit with slightly less conviction at 91% strength. The RSI at 33.68 remains in oversold territory, a recurring theme that traders are closely watching for potential buy-the-dip opportunities. The MACD shows positive momentum, with the histogram above the signal line, which is a divergence from the lower timeframes and could suggest underlying strength is building, or that the downtrend is losing steam. Price action is below the middle Bollinger Band, but the ADX at 32.26 still signals a strong downtrend. This confluence of conflicting signals across timeframes is precisely where the risk management becomes paramount.
Navigating the Price Action: Scenarios Unfold
Given the current technical landscape, several potential scenarios could unfold for BTCUSD. The interplay between the strong bearish momentum on lower timeframes and the oversold conditions on the daily chart creates a complex trading environment. Understanding the triggers and invalidation points for each scenario is crucial for navigating these choppy waters. Let's break down the most probable outcomes based on the live market data.
The Bear's Grip Tightens
65% ProbabilityThe Waiting Game at $61K
25% ProbabilityA Flicker of Hope? The Bounce Scenario
10% ProbabilityThe bearish scenario holds the highest probability at 65% primarily due to the overwhelming alignment of indicators across multiple timeframes pointing downwards. The strength of the downtrend, evidenced by ADX values consistently above 20 on all charts, suggests that any counter-trend moves might be short-lived. A daily close below the $61,449 support level would likely trigger a cascade of selling, as traders and algorithms react to the confirmed breakdown.
The neutral scenario, with a 25% probability, becomes more likely if the market fails to decisively break either the support or resistance levels in the immediate short term. This could lead to a period of sideways trading, potentially forming a base before the next significant move. Traders would need to watch for consolidation patterns on the lower timeframes, looking for signs of accumulation or distribution within the $61,449 to $63,991 range.
The bullish scenario, currently assigned a low 10% probability, would require a significant shift in market sentiment and technicals. This would likely be catalyzed by external factors, such as a dovish surprise from the Federal Reserve or a major geopolitical de-escalation, which would weaken the US Dollar Index (currently strong at 101.68). Technically, this would need to be confirmed by a strong bullish divergence on the daily RSI and a decisive break above the $63,991 resistance, potentially targeting the higher levels of $65,508 and $66,533.
Correlation and Macroeconomic Undercurrents
It's impossible to analyze BTCUSD in isolation. The broader macroeconomic environment plays a significant role in shaping risk appetite, and consequently, the performance of digital assets. The strength of the US Dollar Index (DXY), currently trading at 101.68 and showing a strong upward trend on all timeframes, is a key factor. A rising DXY typically correlates inversely with risk assets like Bitcoin, as it indicates a preference for safe-haven assets and potentially tighter global liquidity conditions.
The performance of major equity indices like the S&P 500 and Nasdaq also provides critical context. The S&P 500 is showing a mixed picture, with a 1-hour bullish trend but a daily bearish trend. The Nasdaq 100, on the other hand, is showing a bearish trend across all analyzed timeframes. This divergence suggests underlying weakness in the tech sector, which often has a spillover effect on cryptocurrencies, seen as high-growth, high-risk assets. If the Nasdaq continues its downward trajectory, it would likely exacerbate the selling pressure on BTCUSD.
Furthermore, the price of oil, currently seeing a sharp decline with Brent trading at $73.55 and WTI at $70.49, reflects concerns about global demand and potentially easing inflation. While falling oil prices might normally be seen as disinflationary, potentially easing pressure on central banks to hike rates, the current market narrative seems dominated by a flight to safety rather than an anticipation of looser monetary policy. This complex interplay means that while falling oil might reduce inflation fears, it doesn't automatically translate into a bullish sentiment for risk assets like Bitcoin.
The Role of Key Levels and Indicators
Let's zoom in on the critical technical levels that will dictate the immediate future of BTCUSD. The support at $61,449 is arguably the most important level to watch in the short term. A decisive break and daily close below this point would invalidate any immediate hopes for a bounce and likely accelerate the move towards the next support at $60,424. This level has shown some historical significance, and a failure to hold it could open the door to a more significant correction.
On the resistance side, the $63,991 level stands as the immediate hurdle. For any bullish scenario to gain traction, BTCUSD needs to not only break this level but also hold above it on a daily closing basis. Above this, the next significant resistance area lies around $65,508, followed by $66,533. These levels represent areas where selling pressure has historically emerged or where significant profit-taking could occur, capping any potential rallies.
When we examine the indicators, the divergence between the daily RSI (33.68, oversold) and the overall strong bearish trend across all timeframes is the most compelling signal. This suggests that while the price is technically oversold, the underlying momentum is still strongly bearish. This often leads to periods of consolidation or 'whipsaw' price action before a clear direction is established. The ADX readings, particularly the strong 32.26 on the daily chart, confirm that a robust trend is in play, making range-bound trading strategies less appealing unless very tight risk management is employed.
What Traders Should Watch Next
For traders looking to navigate this volatile environment, the focus must remain on risk management and adherence to the prevailing trend until clear signals of a reversal emerge. The immediate trigger for a bearish continuation would be a daily close below $61,449. Conversely, any bullish setup would require confirmation through a sustained break above $63,991, ideally accompanied by increasing volume and positive shifts in momentum indicators.
The current market sentiment, heavily influenced by the strong US Dollar and weakness in tech stocks, suggests that the path of least resistance for BTCUSD remains downwards. While oversold conditions on the daily chart might offer a short-term bounce, the probabilities favor the continuation of the bearish trend in the absence of significant positive catalysts. Patience will be key; waiting for a confirmed setup rather than trying to catch a falling knife is the more prudent approach.
Frequently Asked Questions: BTCUSD Analysis
What happens if BTCUSD breaks below the $61,449 support level?
A daily close below $61,449 would invalidate any immediate bullish hopes and likely trigger further selling pressure. This could accelerate the price decline towards the next significant support at $60,424, according to our analysis.
Should I consider buying BTCUSD near the current $61,385 levels given the oversold RSI?
While the daily RSI is oversold at 33.68, the strong bearish trend and negative momentum on lower timeframes suggest caution. A confirmed bullish signal, such as a break above $63,991 resistance, would be needed before considering long positions with high conviction.
Is the ADX reading of 32.26 a strong sell signal for BTCUSD?
An ADX value of 32.26 on the daily chart indicates a strong downtrend is in force. While not a direct sell signal, it confirms that current market conditions favor downward momentum, making short positions more favorable than long ones.
How will the strong DXY at 101.68 affect BTCUSD's short-term outlook?
The strong US Dollar Index (DXY) at 101.68 reinforces a risk-off environment, which typically puts downward pressure on risk assets like BTCUSD. This correlation suggests that continued DXY strength could hinder any potential Bitcoin rallies.
Track markets in real-time
AI-powered analysis, technical indicators and real-time price data.
Join Our Telegram Channel
Breaking market news, AI analysis and trading signals instantly.
Join Channel