The relentless climb of the US Dollar Index (DXY) to 101.7, coupled with a palpable shift towards risk aversion in global markets, has cast a long shadow over precious metals, with Silver (XAGUSD) leading the charge lower. Currently trading at a critical juncture of $59.50, the white metal is battling significant selling pressure, a trend underscored by a confluence of bearish technical indicators across multiple timeframes. The stark decline, marked by a 3.28% drop on the day, paints a concerning picture for investors and traders alike, prompting a deep dive into the underlying drivers and potential future price action.
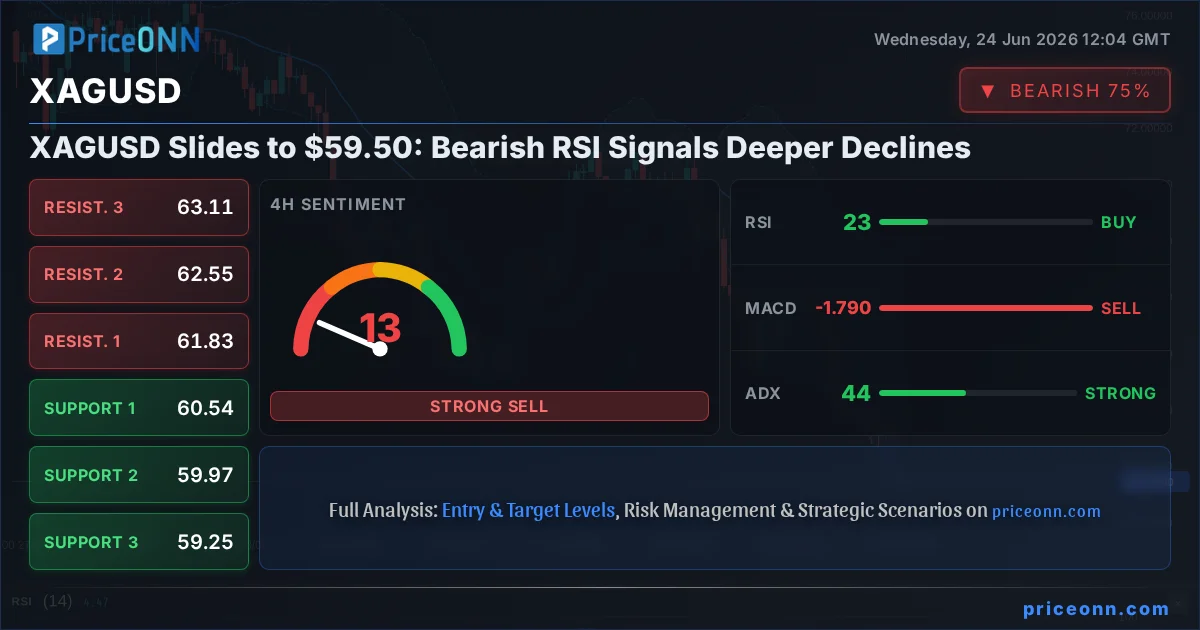
- Silver (XAGUSD) is currently trading at $59.50, down 3.28% today, with a 1H trend strength of 100% bearish.
- The daily RSI reading stands at 29.93, indicating oversold conditions, but the ADX at 33.0 suggests a strong downtrend is still in play.
- Key support levels are identified at $59.25 (4H) and $58.82 (1D), while resistance looms at $60.93 (1H) and $61.83 (4H).
- The strengthening DXY (101.7) and broader risk-off sentiment are key macro drivers pressuring XAGUSD.
The current market environment is far from forgiving for risk assets, and silver is squarely in the crosshairs. The DXY's ascent to 101.7, a level that historically exerts downward pressure on commodities priced in dollars, is a significant headwind. This strengthening dollar narrative is amplified by a broader sentiment shift away from risk, as evidenced by the cautious undertones in equity markets. While the S&P 500 and Nasdaq are showing pockets of resilience, the underlying trend suggests a preference for safety, which typically benefits the dollar and can weigh on assets like silver. The fact that the DXY is exhibiting strong upward momentum, with its 4H ADX at a robust 61.81, signals that this dollar strength is not a fleeting event but a more entrenched trend.
Technically, the picture for XAGUSD is overwhelmingly bearish across the observed timeframes. On the 1-hour chart, the trend is decisively downwards with a strength of 100%, supported by a high ADX reading of 40.63. The Relative Strength Index (RSI) at 24.47 firmly places silver in oversold territory, a reading that might tempt some buyers looking for a bargain. However, the MACD remains below its signal line, and the Stochastic oscillator's %K line is below its %D line, both reinforcing the prevailing bearish momentum. The Bollinger Bands are also illustrating this weakness, with the price trading below the lower band, indicating extreme bearish pressure and a potential for further downside if the trend continues unabated.
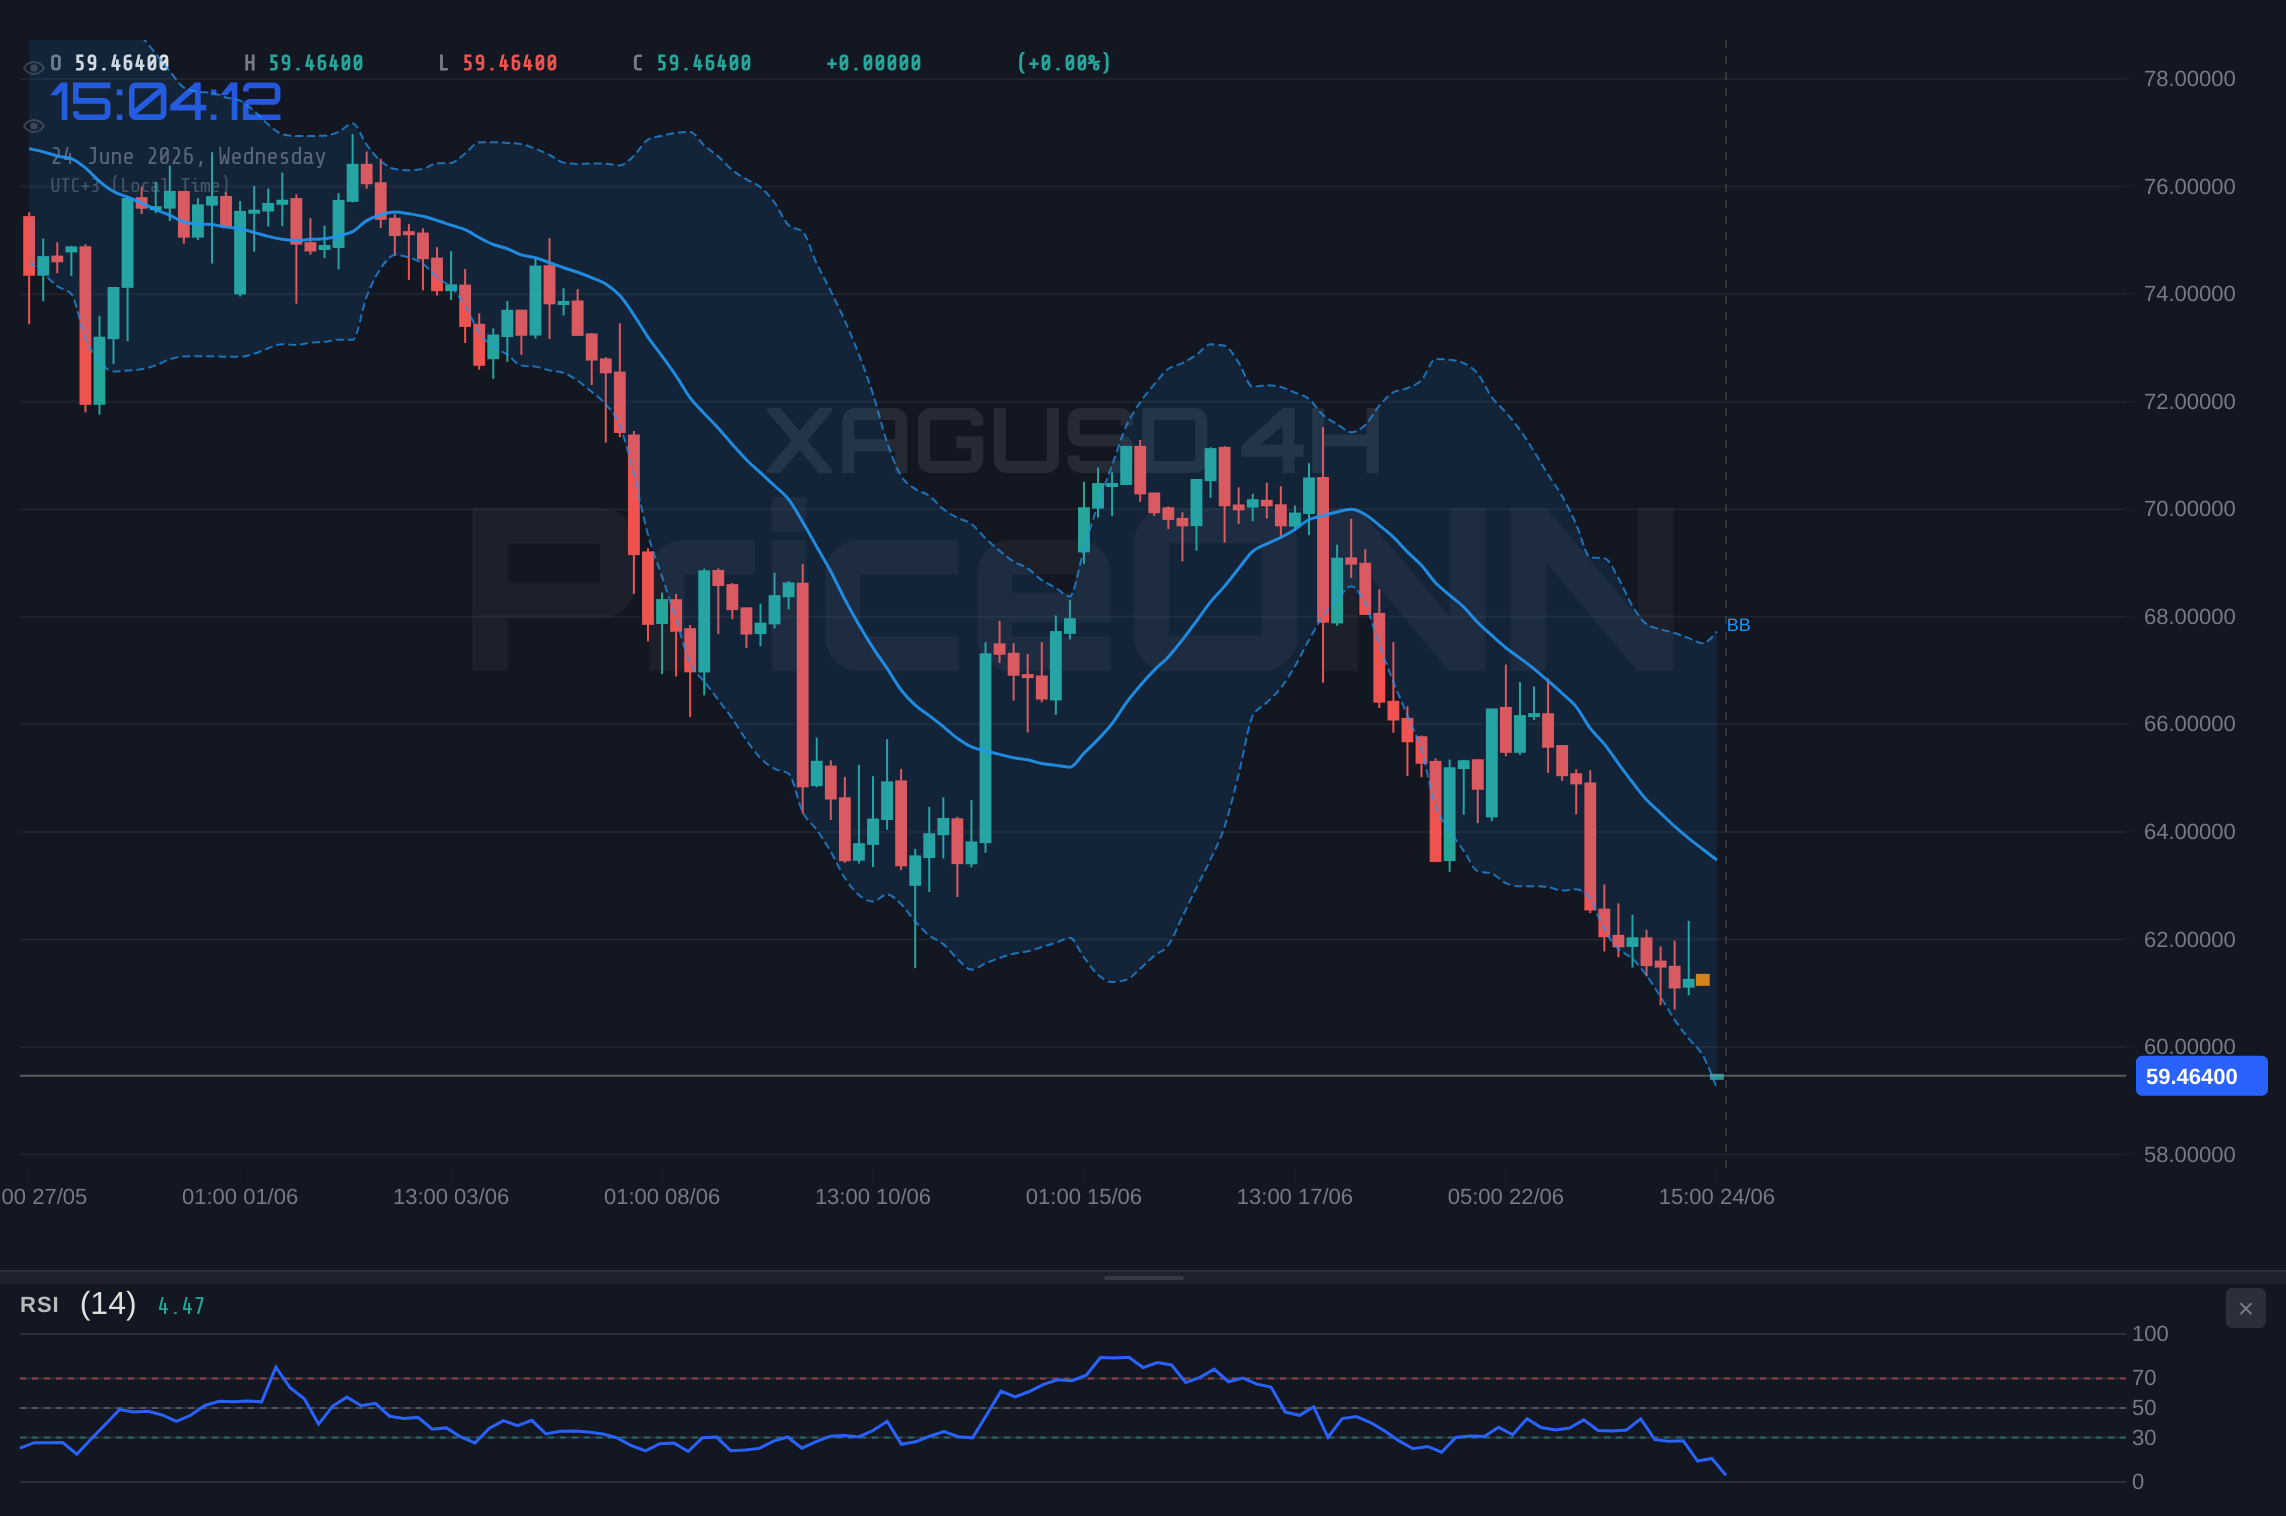
The 4-hour timeframe offers no respite, painting an even more dire technical landscape. The trend remains a staunch 100% bearish, with the ADX surging to 43.72, indicating a powerful and sustained downtrend. The RSI here is even lower, sitting at 23.23, deep within oversold conditions. Yet, similar to the 1H chart, the MACD and Stochastic indicators are aligned with the bears, confirming the negative sentiment. The price action below the lower Bollinger Band on this timeframe suggests that the selling has been aggressive, and any immediate bounces might be short-lived unless significant buying pressure emerges. The support level at $59.97 is a key immediate area to watch; a break below this could accelerate the decline.
Daily Chart Signals Deepening Downtrend
Zooming out to the daily chart, the long-term trend for XAGUSD also shows a clear bearish bias, albeit with a slightly reduced trend strength of 92%. This suggests that while the dominant direction is down, there might be slightly more room for consolidation or minor pullbacks compared to the shorter timeframes. Nevertheless, the ADX at 33.0 still points to a strong trend. The daily RSI is perched at 29.93, again firmly in oversold territory. This persistent oversold condition across all timeframes is a critical observation. While it signals that silver is technically 'cheap' from a purely momentum perspective, it doesn't negate the trend's strength. Historically, oversold conditions can persist in strong downtrends, and a buy signal is typically only considered valid after a confirmed trend reversal or significant bullish divergence. The Stochastic oscillator on the daily chart also shows a bearish signal with %K below %D, reinforcing the downward pressure.
The critical support levels on the daily chart are $58.82 and $56.32. A decisive break below $59.25, identified as a key 4H support, would likely trigger further selling towards the $58.82 mark. The resistance levels, on the other hand, are capped in the short term by $60.93 on the 1H chart and $61.83 on the 4H chart. For any bullish sentiment to even begin to resurface, XAGUSD would need to decisively break above these immediate resistance zones, ideally with increasing volume and a shift in momentum indicators. Until then, the path of least resistance appears to be downwards, with traders likely to view any rallies as opportunities for short-selling or profit-taking on existing long positions.
The broader economic context also plays a crucial role in silver's current predicament. The strengthening US Dollar Index (DXY) to 101.7 is a major factor. As a dollar-denominated asset, silver often moves inversely to the dollar. When the dollar strengthens, it becomes more expensive for holders of other currencies, potentially dampening demand and pushing prices lower. Furthermore, the current market sentiment appears to be leaning towards risk aversion. Reports indicate a sell-off in the technology sector and a general shift towards safer assets, which further bolsters the dollar and puts pressure on commodities like silver. This risk-off environment is a significant fundamental driver that technical indicators are merely reflecting.
Looking at the correlation with other markets, the weakness in silver mirrors the broader sentiment in other precious metals. Gold (XAUUSD) is also under pressure, trading at $4047.46, down 1.52% on the day. This synchronized decline in precious metals suggests a systemic factor at play, likely the strong dollar and risk aversion narrative. The fact that both gold and silver are experiencing significant drawdowns simultaneously reinforces the bearish outlook for the sector. While sometimes gold and silver can diverge, their current correlated weakness suggests a shared vulnerability to the prevailing macro-economic winds.
From a trading perspective, the current setup on XAGUSD presents a high-risk environment for long positions. The overwhelming bearish signals across multiple timeframes, combined with strong trend indicators like the ADX, suggest that betting against the trend is a risky endeavor. However, for those looking for potential shorting opportunities, the current oversold RSI readings might offer a tactical entry point, provided strict risk management is employed. A break below the immediate 4H support at $59.97 could signal the next leg lower, targeting the daily support at $58.82. Conversely, any sustained move above the 1H resistance at $60.93 would be the first sign of a potential short-term reversal, though a significant shift in the broader market sentiment would be required for a more substantial recovery.
The recent news flow also adds context to the current price action. Reports of a 'wave of selling in the technology sector' and a 'pullback in the S&P 500' highlight the prevailing risk-off sentiment. The mention of Gold's advance looking 'vulnerable' and potentially falling to $4,000 directly correlates with the pressure seen on silver. Furthermore, the Dollar Index breaking 'key Fibonacci barriers' and the Euro hitting 'fresh yearly lows' underscore the strength of the US dollar, a key driver of XAGUSD's current decline. This news aligns perfectly with the technical picture, reinforcing the bearish outlook.
Navigating the Bearish Tide: Strategy and Outlook
Given the current technical and fundamental landscape, the outlook for XAGUSD remains decidedly bearish in the short to medium term. The strong trend strength indicated by the ADX across 1H, 4H, and 1D charts, coupled with consistently oversold RSI readings that fail to spark significant buying interest, suggests that momentum is firmly with the sellers. The immediate price action at $59.50 is critical, sitting just above the key 4H support of $59.97 and the 1D support of $58.82. A decisive breach of these levels could open the door for a rapid descent towards lower price points, potentially retesting levels not seen in recent months.
The confluence of a strong US dollar, a risk-off market sentiment, and deeply oversold technical conditions creates a complex trading environment. While oversold RSI suggests a potential for a bounce, the strength of the downtrend indicated by ADX and MACD signals means that any such bounce could be a mere correction within a larger bearish trend. Traders will be closely watching the $60.93 and $61.83 resistance levels on the shorter timeframes. A failure to overcome these immediate hurdles would reinforce the bearish thesis, while a strong break above them, especially with increased volume, might signal the beginning of a short-term recovery. However, without a broader shift in market sentiment or a significant change in the dollar's trajectory, a sustained bullish move remains unlikely in the immediate future.
The critical question for traders now is not if XAGUSD will bounce, but when and from what level, and whether that bounce will be a sustainable trend reversal or just a temporary reprieve. The current data strongly suggests the latter. The strength of the downtrend, evidenced by the ADX readings consistently above 30 across timeframes, indicates that the bears are in firm control. The oversold RSI, while tempting, often persists in strong downtrends, meaning it can remain in oversold territory for extended periods without a corresponding price recovery. Therefore, any positioning should be cautious, with a clear focus on risk management and waiting for stronger confirmation signals before considering any long trades.
The scenario cards below outline potential paths forward, but the prevailing technical indicators and market sentiment lean heavily towards the bearish outlook. Any deviation from this path would require a significant catalyst, such as a sharp reversal in the DXY, a sudden shift back to risk appetite, or a major geopolitical event that drives safe-haven demand. Until then, the focus remains on the downside, with key support levels at $59.25 and $58.82 acting as potential targets for sellers.
Bearish Scenario: Downside Momentum Continues
70% ProbabilityNeutral Scenario: Consolidation Around $59.50
20% ProbabilityBullish Scenario: Short-Covering Rally
10% ProbabilityKey Levels and Technical Summary
| Indicator | Value | Signal | Interpretation |
|---|---|---|---|
| RSI (14) | 29.93 | Bearish | Oversold, but trend strength remains high. |
| MACD | -0.47 | Bearish | Below signal line, negative momentum. |
| Stochastic | K=12.58, D=37.59 | Bearish | %K |
| ADX | 33.0 | Strong Trend | Indicates a strong downtrend. |
| Bollinger Bands | Price below Mid Band | Bearish | Suggests downward pressure. |
Frequently Asked Questions: XAGUSD Analysis
What happens if XAGUSD breaks below the $58.82 support level?
A break below the $58.82 daily support level would confirm the continuation of the strong downtrend. This could trigger further selling pressure, potentially targeting lower levels not seen recently, as the bearish momentum would be further validated.
Should I consider buying XAGUSD at current levels around $59.50 given the oversold RSI?
Buying at current levels is highly risky given the strong bearish trend indicated by the ADX (33.0) and MACD. While the RSI at 29.93 is oversold, it can remain so in strong downtrends. A confirmed bullish reversal signal, like breaking above $60.93 with conviction, is needed before considering long positions.
Is the daily RSI at 29.93 a reliable sell signal for XAGUSD?
No, an RSI reading of 29.93 is an oversold signal, not a sell signal. It indicates that the price has fallen significantly and may be due for a bounce. However, in a strong downtrend, oversold conditions can persist, so it should not be acted upon in isolation without other confirming bullish indicators.
How will the strong DXY at 101.7 affect XAGUSD's outlook this week?
The strengthening DXY at 101.7 is a major headwind for XAGUSD, as precious metals often move inversely to the dollar. This sustained dollar strength is likely to continue pressuring silver prices lower, especially if risk aversion persists in the broader markets.
Track markets in real-time
AI-powered analysis, technical indicators and real-time price data.
Join Our Telegram Channel
Breaking market news, AI analysis and trading signals instantly.
Join Channel