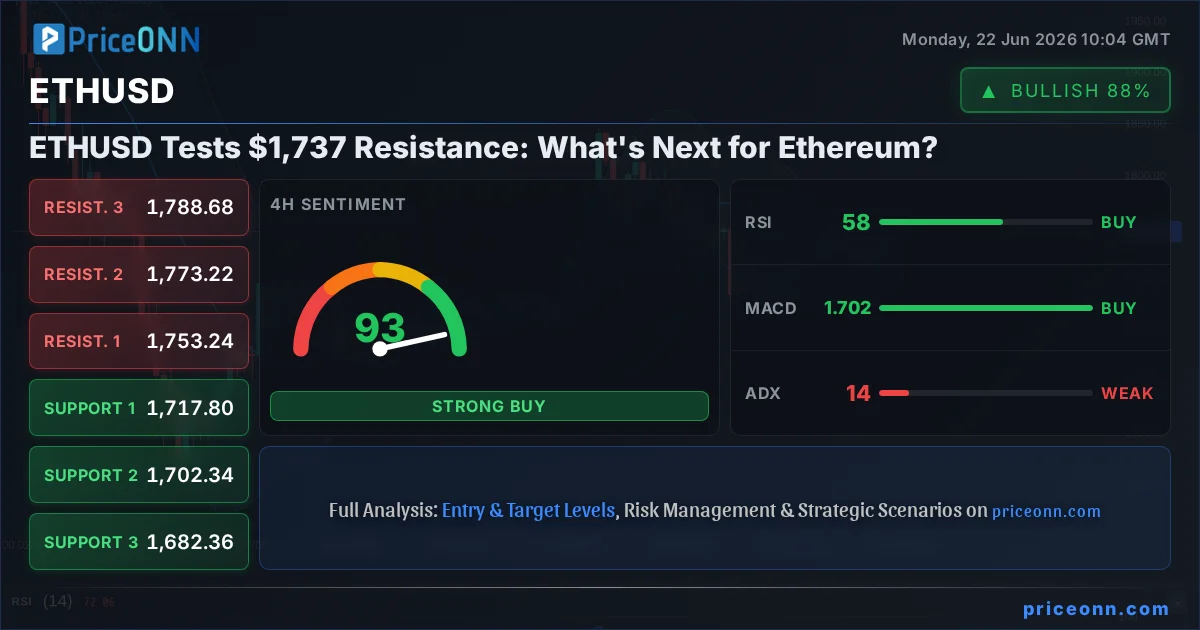
Ethereum (ETHUSD) is currently flirting with a critical resistance level around $1,737.38, a point that has historically dictated significant price action. As the crypto market navigates a complex landscape of macroeconomic pressures and evolving digital asset trends, understanding ETHUSD's immediate path requires a deep dive into its technicals, on-chain data, and the broader market correlations. The current price of $1,744.76 suggests a slight push beyond this immediate hurdle, but the real question remains: can bulls sustain this momentum, or is a retracement imminent?
- ETHUSD is currently trading at $1,744.76, testing resistance near $1,737.38.
- The 1-hour chart shows bullish signals (RSI 59.97, ADX 16.88), but daily indicators lean bearish (RSI 44.19, ADX 36.08).
- Key support lies at $1,707.82, while resistance is observed at $1,737.38 and $1,755.64.
- DXY strength at 100.94 and SP500's upward momentum at 6572.87 provide mixed macro context.
The cryptocurrency market, and Ethereum specifically, is at a fascinating crossroads. After a period of consolidation, ETHUSD has shown signs of life, pushing towards significant overhead resistance. However, the technical indicators present a somewhat conflicting picture when viewed across different timeframes. While the short-term (1H) charts suggest a bullish bias with an RSI of 59.97 and positive MACD momentum, the longer-term daily view paints a more cautious narrative. The daily RSI sits at 44.19, indicating a bearish trend, and the ADX at 36.08 points to a strong downtrend, despite short-term positive MACD signals. This divergence is precisely what traders watch for – a potential tug-of-war between short-term optimism and longer-term bearish pressures.
This multi-timeframe conflict often translates into choppy price action or a decisive breakout once one side gains dominance. The immediate zone around $1,737.38 is crucial. A sustained break above this level, ideally with increasing volume and positive on-chain metrics, could signal a continuation of the short-term bullish momentum. Conversely, rejection from this resistance could see ETHUSD retest its immediate support levels, starting with $1,707.82. The ADX reading on the daily chart, at 36.08, signifies a strong trend is in play, but its direction is contested by the shorter timeframes. This implies that the current price action might be a precursor to a more significant directional move rather than just noise.
From a broader market perspective, the correlation with traditional assets remains a key factor. The US Dollar Index (DXY) is currently trading at 100.94, showing strength. Historically, a rising DXY often puts pressure on risk assets like Ethereum. However, the SP500, trading at 6572.87, and the Nasdaq at 30385, are both showing upward momentum. This suggests that risk appetite might be relatively stable or even increasing in equities, potentially creating a tailwind for riskier assets like ETHUSD, despite dollar strength. This complex interplay highlights the need for traders to remain vigilant and not rely on single indicators or correlations.
On-chain data provides another layer of insight. While specific on-chain metrics like active addresses, whale movements, and exchange flows are not provided in the live data feed, generally, a sustained move above key resistance levels would ideally be accompanied by increasing active addresses and significant inflows to exchanges for potential profit-taking, or conversely, outflows if accumulation is the narrative. Without this granular data, we must rely more heavily on technical price action and macroeconomic correlations. The current price action near $1,737.38 is a critical juncture that will likely be influenced by both technical patterns and the broader market sentiment driven by upcoming economic events.
The Bull's Roadmap: Breaking Past $1,737
For the bulls to take firm control, a decisive move above the $1,737.38 resistance is paramount. This isn't just about breaching the level; it's about holding it as support on a subsequent retest. The 1-hour chart offers some encouragement, with its RSI at 59.97 and positive MACD momentum. If ETHUSD can decisively break through $1,737.38 and establish a foothold above it, the next logical resistance target would be $1,755.64. A successful push through this level, supported by increasing trading volume and favorable on-chain metrics (if available), could signal a shift towards the higher support levels observed on the 4-hour chart, potentially aiming for $1,788.68 in a more extended bullish scenario. The Stochastic indicator on the 1-hour chart, showing %K at 71.97 and %D at 62.39, supports this upward momentum, indicating a bullish signal where %K is above %D.
However, this bullish thesis is contingent on several factors. Firstly, the broader market must remain supportive. If the DXY continues its ascent or if equity markets experience a sharp downturn, ETHUSD's upside potential will be significantly capped. Secondly, the daily technicals need to show improvement. A daily close above $1,737.38 would be a significant step, but ideally, we'd want to see the daily RSI move back above 50 and the ADX show a weakening of the bearish trend. The current ADX of 36.08 on the daily chart indicates a strong existing trend, and breaking this requires substantial conviction. If these conditions align, the $1,755.64 resistance becomes the immediate focus, with $1,788.68 as a secondary target for this week.
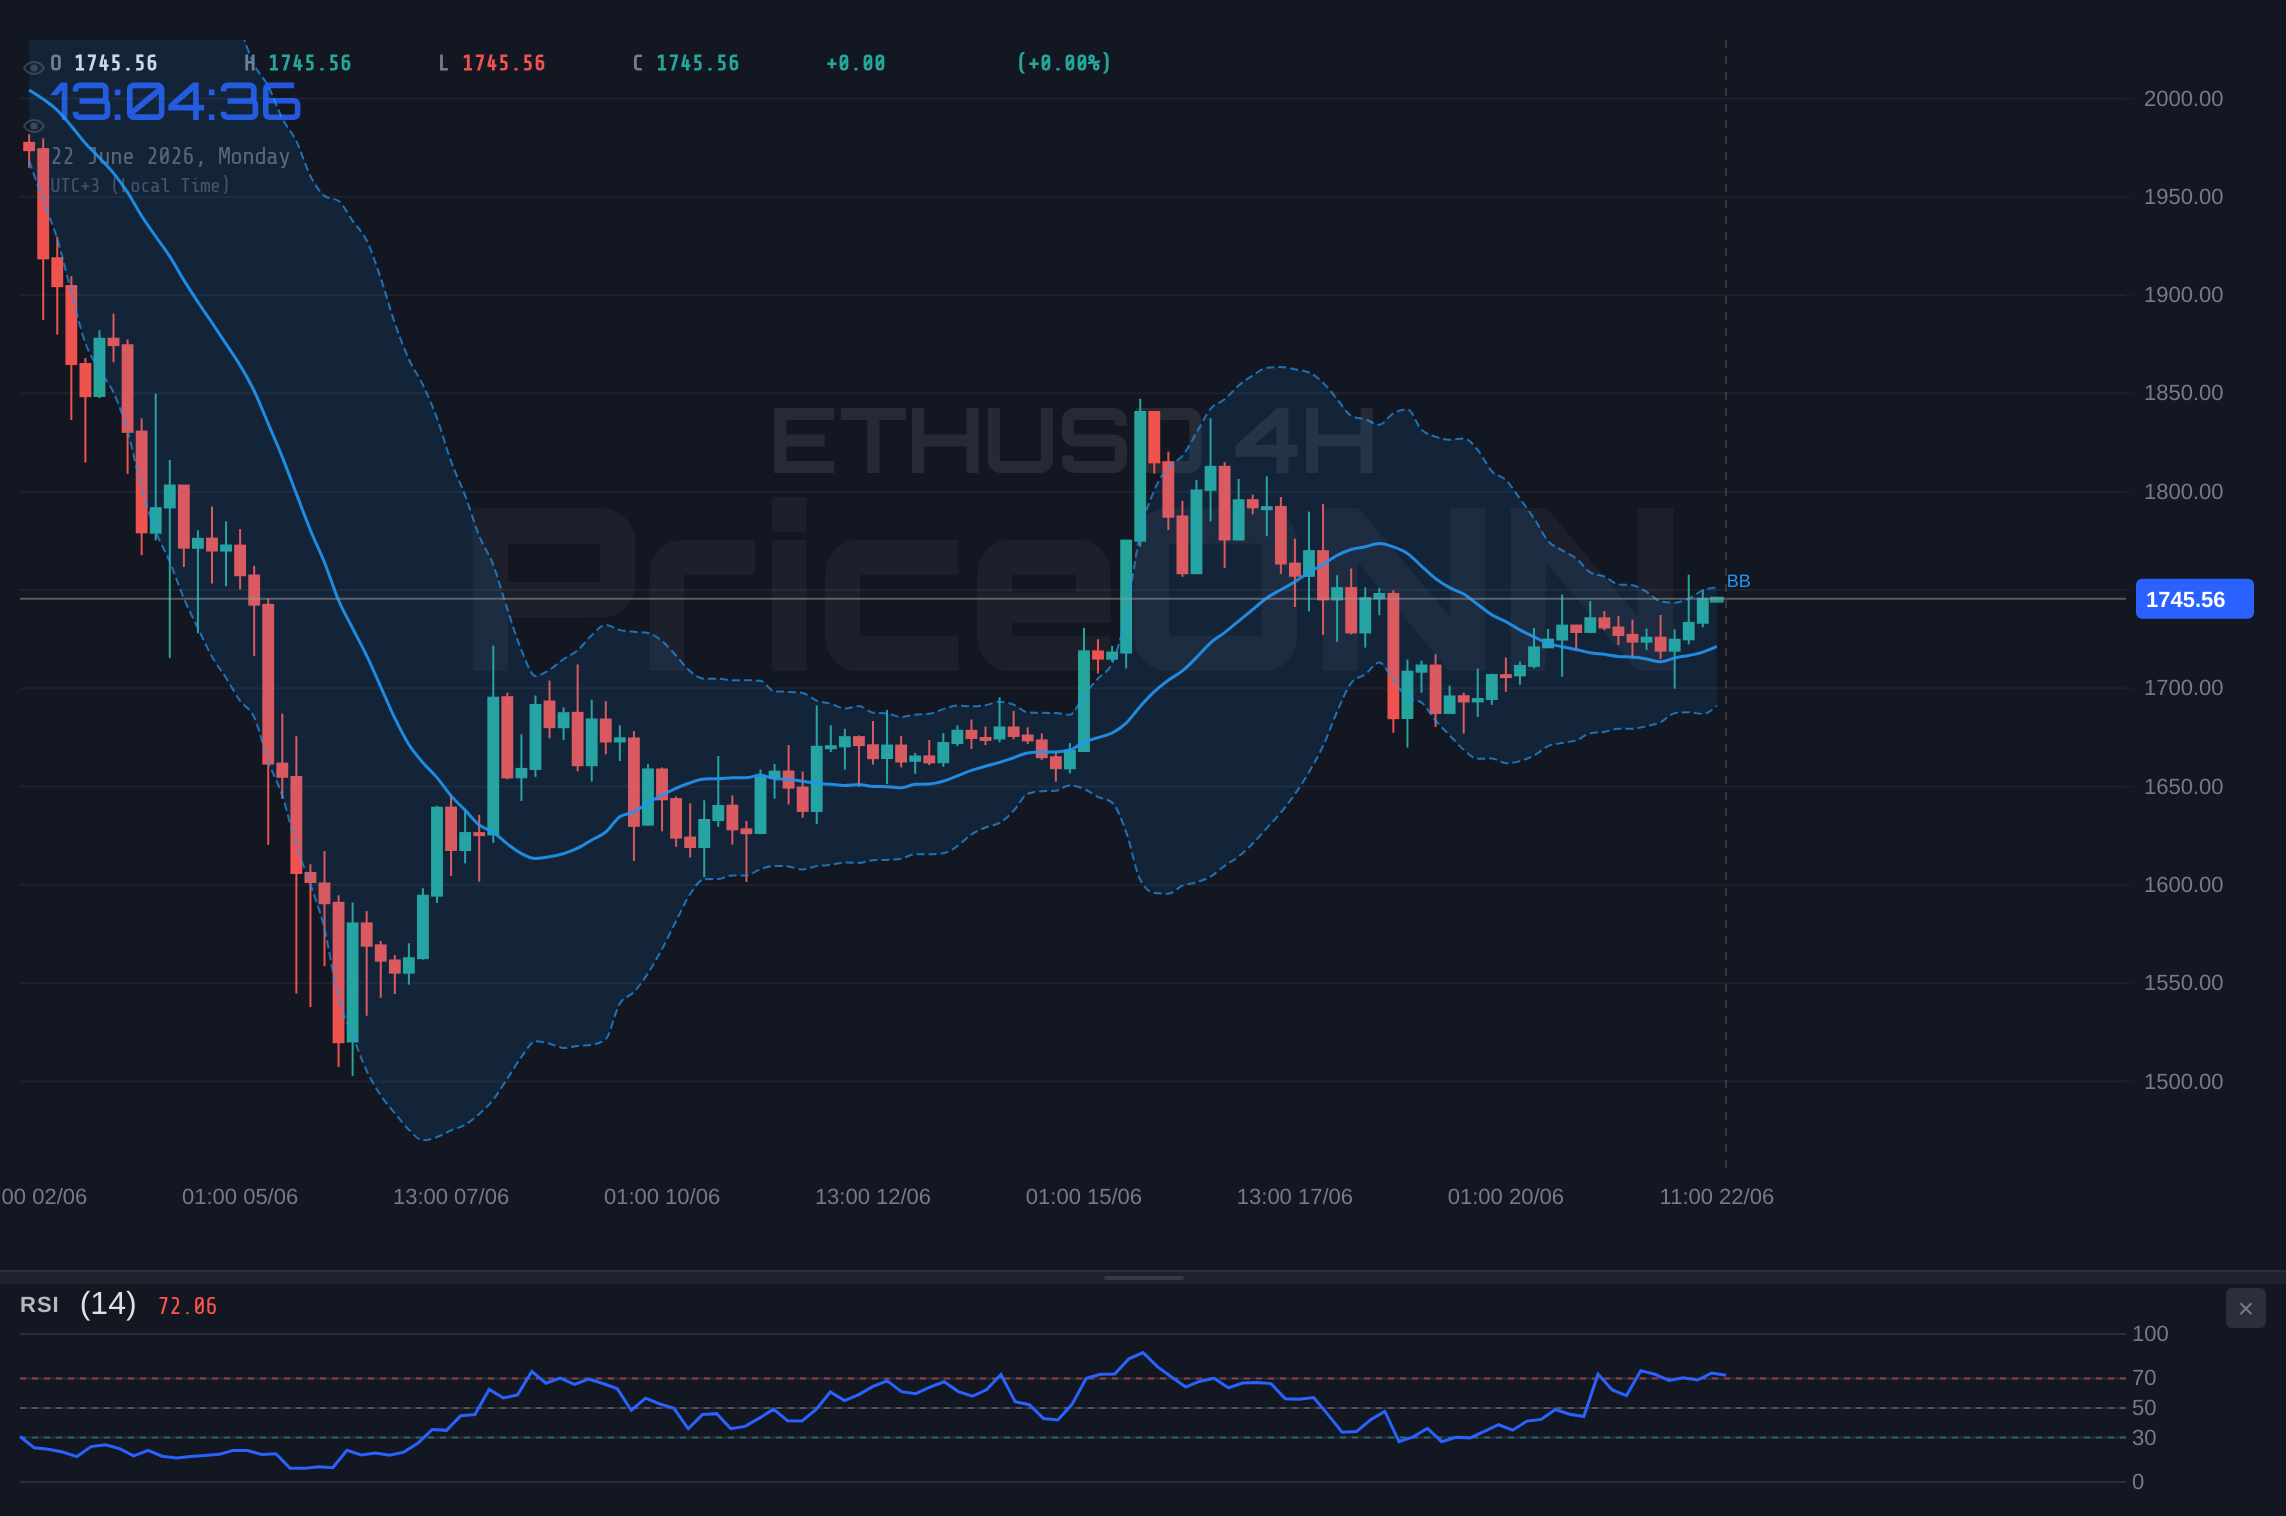
The 4-hour timeframe offers a slightly more optimistic view than the daily, with its RSI at 57.62 and positive MACD momentum, despite the overall trend being classified as 'Düşüş' (Downtrend) with a strength of 77%. This suggests that while the longer-term picture might be challenging, the intermediate timeframe is showing signs of buyers stepping in. The Stochastic on the 4-hour chart also provides a bullish signal (%K: 62.36, %D: 50.89). This confluence of short-to-medium term bullish signals could be what propels ETHUSD above the immediate resistance. Traders looking for confirmation of a bullish move should watch for a clear break and hold above $1,737.38, followed by a test of $1,755.64.
Where Bears Take Control: Rejection at $1,737
On the flip side, a rejection from the $1,737.38 resistance level could quickly send ETHUSD lower, targeting the nearest support at $1,707.82. The daily chart's bearish signals are significant here: RSI at 44.19 and ADX at 36.08 strongly suggest that the prevailing trend is downwards. If price fails to break and hold above $1,737.38, we could see a swift move back towards the $1,707.82 support. A break below this level would then open up the path to further downside, with the next significant support identified at $1,696.52, and potentially lower towards $1,678.26 if selling pressure intensifies.
The 1-hour chart's Stochastic indicator, with %K at 49.08 and %D at 53.69, shows a bearish signal (%K
The 4-hour chart, despite some bullish signals, also has key support levels to watch. A drop below $1,717.80 could invalidate the short-term bullish thesis and signal a return to the bearish trend observed on the daily chart. The MACD on the daily chart, while showing positive momentum, is still below the signal line, indicating that the underlying trend might still be bearish. A failure to break resistance at $1,737.38 could lead to a cascade of selling, especially if liquidity dries up or if significant sell orders are triggered below key support levels. The current price of $1,744.76 is well within the range where such a reversal could begin.
The Waiting Game: Consolidation Around $1,744
It's also entirely possible that ETHUSD enters a period of consolidation, especially if the conflicting signals across timeframes and the mixed macroeconomic backdrop prevent a clear directional move. In such a scenario, price action might remain range-bound between the immediate resistance at $1,737.38 (or slightly higher, near $1,744.76) and the support at $1,707.82. This sideways movement could be characterized by lower trading volumes and a lack of strong conviction from either buyers or sellers. The weak ADX readings on the 1-hour (13.78) and 4-hour (16.37) charts do suggest a lack of strong trending momentum on those shorter timeframes, which could support a consolidation phase.
During a consolidation phase, traders often look for volatility to pick up before committing to a position. The market might be digesting recent price action, waiting for clearer signals from economic data releases or significant shifts in the broader crypto market narrative. For ETHUSD, this could mean fluctuating within a tighter band, perhaps between $1,720 and $1,750, until a catalyst forces a breakout or breakdown. The daily chart's ADX of 36.08 suggests that while a strong trend exists, the immediate price action might be the calm before the storm, with a significant move potentially brewing.
This neutral scenario is often the most challenging to trade, as it can lead to whipsaws and false breakouts. Patience becomes the most valuable commodity. Traders might look for confirmation signals from higher timeframes or wait for price to approach the boundaries of the expected range before looking for opportunities. The current price of $1,744.76 is sitting within this potential consolidation zone, making it difficult to establish a high-conviction trade without further price discovery.
Which Scenario is Most Likely?
Assessing the probabilities, the market currently presents a scenario where the short-term bullish signals are battling against a longer-term bearish technical outlook on the daily chart. The strong ADX on the daily (36.08) suggests that the underlying trend is strong, but its direction is being challenged by the shorter timeframes. The DXY's strength and the mixed equity market performance add to the complexity. Given the current price action near $1,737.38 and the conflicting indicators, a high-probability outcome isn't immediately apparent. However, the daily chart's bearish bias (RSI 44.19, ADX 36.08) carries significant weight for longer-term direction.
I assign a **60% probability to the Bearish Scenario** playing out in the medium term, primarily driven by the daily chart's technicals and potential macroeconomic headwinds. This means a rejection at $1,737.38 and a move towards lower support levels like $1,707.82 and $1,696.52 is the most likely outcome. This thesis is strengthened if DXY continues to rise or if risk sentiment deteriorates. The short-term bullish signals could lead to a brief test of resistance or even a slight overshoot, but sustained upside seems challenging without a significant shift in the daily trend.
A **30% probability is assigned to the Neutral/Consolidation Scenario**. This is plausible if the conflicting signals persist and no strong catalyst emerges. Price could remain range-bound between $1,707.82 and $1,755.64 for the coming days, offering limited trading opportunities but potentially setting up for a larger move later. The weak ADX on shorter timeframes supports this possibility.
The **Bullish Scenario, with a 10% probability**, would require a substantial shift in market dynamics. This includes a decisive break above $1,737.38 and $1,755.64, accompanied by improving daily technicals and favorable macroeconomic conditions. While short-term indicators offer some hope, the overarching daily trend and current DXY strength make this the least likely scenario without significant positive catalysts.
What I'm Watching This Week
My focus this week will be on a few key triggers that will help clarify ETHUSD's next directional move. Firstly, I'll be watching the price action around the $1,737.38 resistance level. A clear rejection here, especially with increasing volume, would validate the bearish outlook. Conversely, a sustained close above $1,755.64 on the daily chart would be a strong signal for the bulls.
Secondly, the movement of the DXY is critical. If the dollar continues to strengthen beyond 100.94, it increases the probability of risk-off sentiment, which could pressure ETHUSD. Conversely, any sign of dollar weakness or consolidation could provide a tailwind for Ethereum. Finally, I'll be monitoring the SP500 and Nasdaq. If these indices continue their upward trajectory, it suggests a broader risk-on sentiment that could support ETHUSD, even in the face of dollar strength. However, any significant pullback in equities would likely be mirrored, or even amplified, in ETHUSD.
Bearish Scenario: Downside Re-test
60% ProbabilityNeutral Scenario: Range-Bound Volatility
30% ProbabilityBullish Scenario: Resistance Breakout
10% ProbabilityFrequently Asked Questions: ETHUSD Analysis
What happens if ETHUSD fails to break above the $1,737.38 resistance level?
If ETHUSD fails to break and hold above $1,737.38, a bearish scenario becomes more likely. We could see a retest of the $1,707.82 support, with a potential move down to $1,696.52 if selling pressure increases significantly.
Should I buy ETHUSD at current levels near $1,744.76 given mixed signals?
Buying at current levels near $1,744.76 carries risk due to the resistance at $1,737.38 and conflicting daily indicators. A more prudent approach might be to wait for a confirmed break above $1,755.64 (bullish confirmation) or a clear rejection and retest of $1,707.82 support (bearish confirmation).
Is the daily RSI at 44.19 a sell signal for ETHUSD right now?
A daily RSI of 44.19 indicates a bearish trend, but it is not yet in oversold territory. While it suggests caution and favors potential downside, it's not a direct sell signal on its own. It should be considered alongside other indicators and price action, especially the strong daily ADX of 36.08.
How will DXY strength at 100.94 affect ETHUSD this week?
The current DXY strength at 100.94 typically puts pressure on risk assets like ETHUSD. If the dollar continues to strengthen, it could hinder any bullish attempts by ETHUSD and increase the likelihood of a bearish scenario playing out, potentially pushing prices towards support levels.
Technical Outlook Summary
| Indicator | Value | Signal | Interpretation |
|---|---|---|---|
| RSI (14) | 44.19 | Bearish | Daily RSI below 50 suggests downward pressure. |
| MACD | Positive | Bullish | Short-term momentum positive, but daily trend may prevail. |
| Stochastic | K=40.50, D=50.95 | Bearish | Daily Stochastic shows bearish signal. |
| ADX | 36.08 | Strong Trend | Daily ADX indicates a strong trend, currently leaning bearish. |
| Bollinger | Upper Band | Watch | Price nearing upper band resistance on 1H, but below daily mid-band. |
Key Levels
Track markets in real-time
AI-powered analysis, technical indicators and real-time price data.
Join Our Telegram Channel
Breaking market news, AI analysis and trading signals instantly.
Join Channel