ETHUSD has found itself in a peculiar state of consolidation, trading sideways around the $1,735.67 mark for much of the past week. This period of relative calm, following more volatile swings, presents a critical juncture for traders and investors alike. While the price action might appear uneventful on the surface, the underlying technical indicators and broader market correlations are painting a nuanced picture that demands closer inspection. Understanding whether this flatness is a prelude to a significant move or simply a pause before a continuation is key to navigating the current crypto landscape. As we dissect the data from the 1-hour, 4-hour, and daily charts, we'll also consider the influence of macroeconomic factors like the Dollar Index (DXY) and risk sentiment, alongside specific on-chain metrics that could provide clues to Ethereum's next directional bias. This analysis aims to provide a data-driven outlook, focusing on actionable insights derived from precise market data, not speculation.
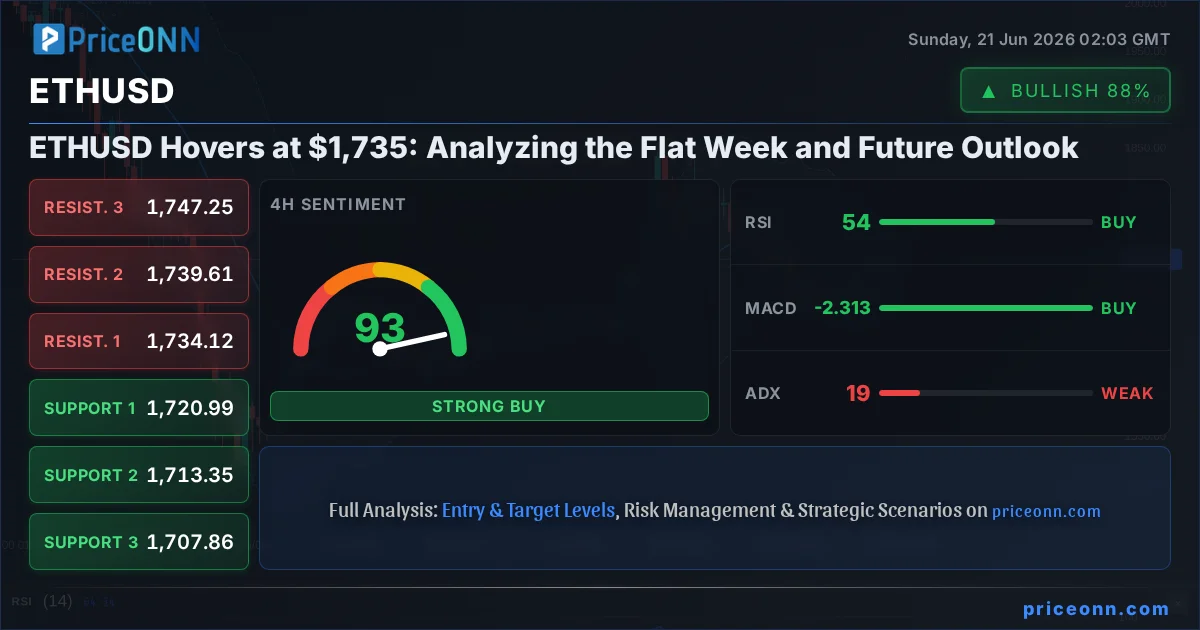
- ETHUSD is currently trading around $1,735.67, indicating a period of consolidation after recent volatility.
- On the daily chart, RSI at 42.76 suggests a bearish lean, while the MACD shows positive momentum, creating a divergence.
- Key resistance is observed at $1,743.29 on the 1-hour chart, while the critical support level to watch is $1,728.41.
- The ADX reading of 39.27 on the daily timeframe indicates a strong downtrend, despite some shorter-term bullish signals on lower timeframes.
- Correlation with DXY, currently at 100.82, remains a factor, with dollar strength potentially pressuring ETHUSD.
Navigating the Consolidation: ETHUSD's Technical Crossroads
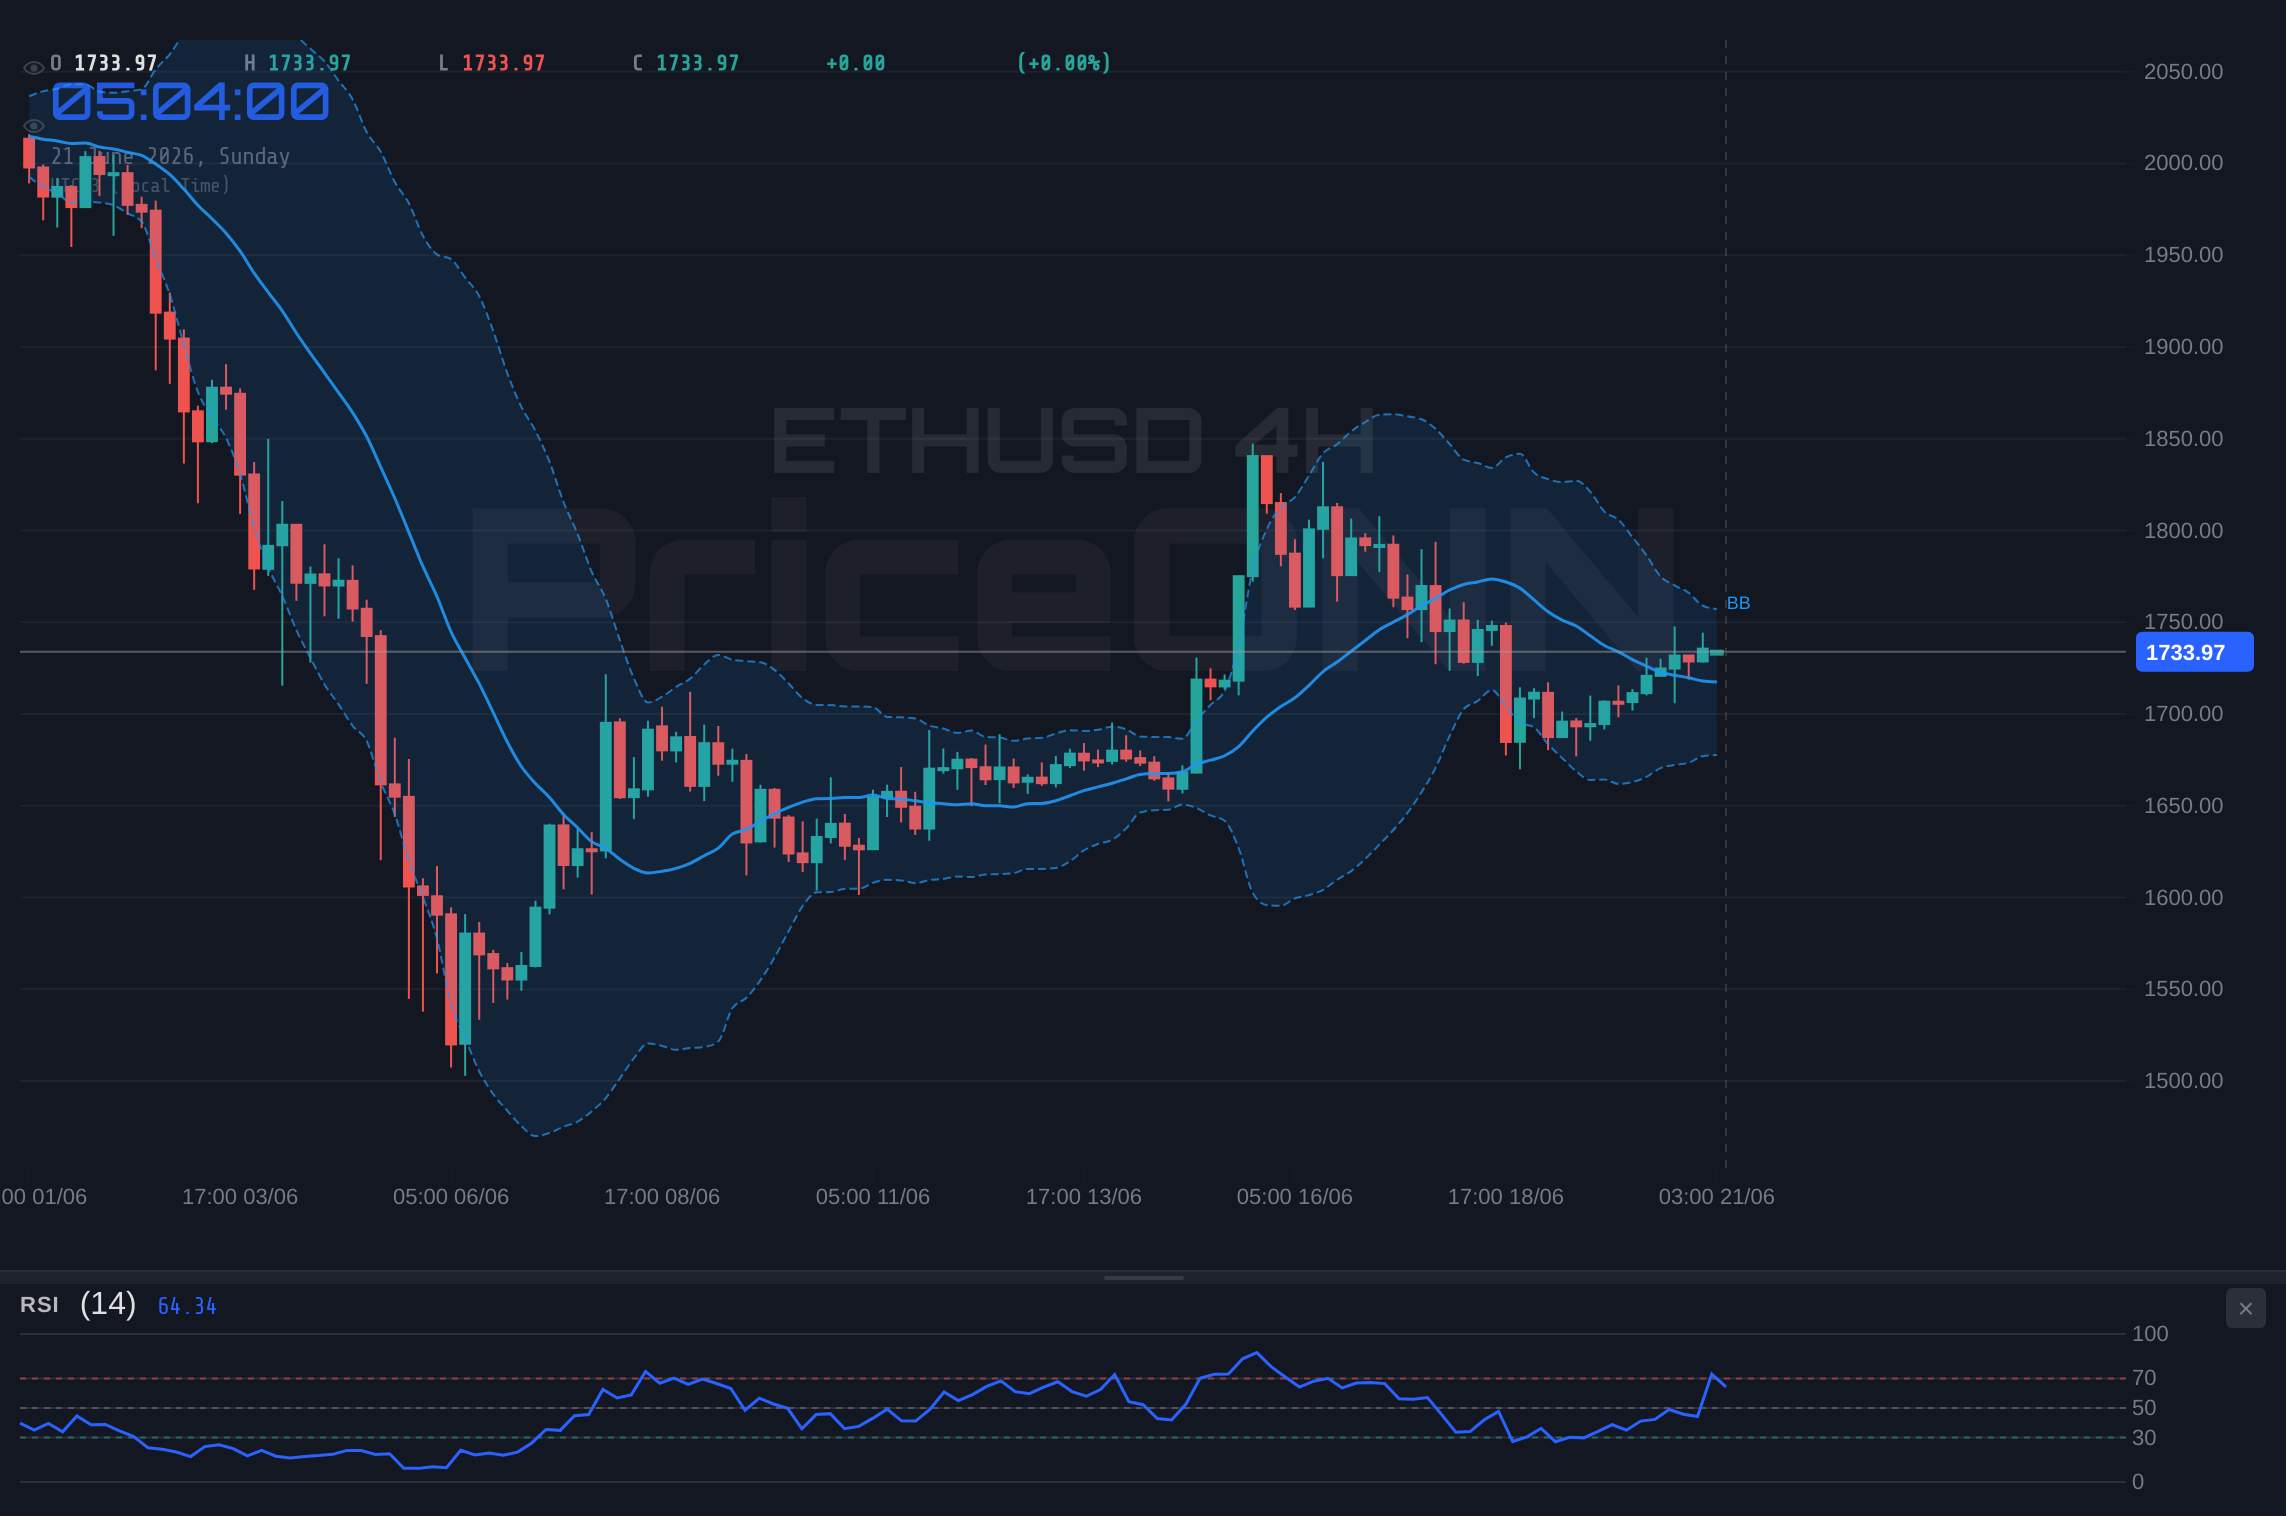
The Ethereum network's native token, ETHUSD, has entered a phase of subdued price action, hovering around the $1,735.67 level. This lack of directional conviction across the past week suggests a market in equilibrium, where buying and selling pressures are closely matched. On the shorter timeframes, such as the 1-hour chart, the trend is nudging towards neutral with a 50% power, supported by a buy signal from the aggregated indicators (7-1 Al, 0-1 Sat, 0 Nötr). Here, the RSI at 59.22, while in neutral territory, shows a slight upward inclination, and the MACD indicator is displaying positive momentum, with its signal line above the MACD line. Stochastic oscillators are also in bullish territory, indicating potential upward momentum, with %K at 66.86 and %D at 64.61. The Bollinger Bands on this timeframe are also showing prices trading above the middle band, hinting at a potential upward bias.
However, this short-term optimism on the 1-hour chart is met with a more cautious, even bearish, outlook when expanding the view to the daily timeframe. The daily chart paints a different story, with a prevailing downtrend (92% power) and a significant bearish signal from the aggregated indicators (3 Al, 5 Sat, 0 Nötr). The RSI(14) at 42.76 firmly sits in neutral territory but leans towards a bearish sentiment, reflecting a lack of strong buying pressure. Crucially, the MACD is showing negative momentum, with the MACD line below its signal line, indicating that selling pressure is building. The Stochastic oscillator on the daily chart presents a bearish signal, with %K at 43.27 and %D at 64.01, clearly showing %K below %D. Furthermore, the ADX, a measure of trend strength, stands at a robust 39.27 on the daily chart, confirming a strong downtrend is in place, even if momentum indicators show some conflicting signals on lower timeframes. This divergence between short-term bullish signals and the dominant daily downtrend is precisely where traders must exercise caution.
The Crucial Role of Support and Resistance Levels
In a market characterized by consolidation, the significance of established support and resistance levels cannot be overstated. For ETHUSD, currently trading at $1,735.67, these price points act as critical battlegrounds that will likely dictate the short-to-medium term direction. On the 1-hour chart, immediate resistance is identified at $1,738.33, followed by $1,741.04 and $1,743.29. A decisive break and hold above these levels would be necessary to challenge the prevailing bearish sentiment seen on the daily chart. Conversely, the immediate support lies at $1,733.37, with further levels at $1,731.12 and $1,728.41. A break below this cluster of support could signal a continuation of the downward trend observed on the daily timeframe, potentially inviting further selling pressure.
Looking at the 4-hour chart, the support levels are more pronounced, starting at $1,720.99, then $1,713.35, and further down at $1,707.86. Resistance on this intermediate timeframe is situated at $1,734.12, followed by $1,739.61 and $1,747.25. The fact that the current price of $1,735.67 is hovering just below the first resistance level on the 4-hour chart ($1,734.12) adds to the bearish bias observed on the daily timeframe. The ADX on the 4-hour chart, at 18.98, suggests a weak trend, which aligns with the consolidation theme, but the overall signal remains mixed with a slight bullish bias from Stochastic and a bearish undertone from RSI. The daily chart's support levels are more substantial, at $1,683.33, $1,659.96, and $1,642.98, representing significant downside potential if the bearish trend fully takes hold.
Macroeconomic Undercurrents: DXY and Risk Sentiment
While ETHUSD's price action has been largely contained within narrow ranges, broader macroeconomic forces continue to exert influence. The Dollar Index (DXY), currently trading at 100.82, is a critical barometer of global risk appetite and a key correlator for crypto assets. The DXY is showing a mixed picture, with a neutral trend on the 1-hour chart but a strong 100% bullish trend on the 4-hour and a 91% bullish trend on the daily. This suggests underlying dollar strength, which typically acts as a headwind for risk assets like Ethereum. When the dollar strengthens, it can make assets priced in USD, like ETH, appear more expensive to holders of other currencies, potentially dampening demand. The current DXY level of 100.82 is testing resistance on the 1-hour chart, but its daily upward trajectory suggests that any significant dollar weakness might be temporary, reinforcing the cautious outlook for ETHUSD.
The performance of major equity indices, SP500 and Nasdaq100, also provides context for risk sentiment. The SP500 is showing a strong bearish trend on the daily timeframe (100% power), despite a bullish 1-hour trend. The Nasdaq100, on the other hand, shows a strong bullish trend on the daily (92% power), despite a bearish 4-hour signal. This mixed signal from equities indicates that market participants are uncertain about the broader economic outlook. A declining risk appetite, as suggested by the bearish trend in SP500, typically leads investors to seek safer assets, which can draw capital away from cryptocurrencies. Conversely, a strong Nasdaq100 might imply continued appetite for growth assets, which could indirectly support ETHUSD. The conflicting signals from these indices highlight the choppiness in traditional markets, making it difficult to draw firm conclusions about risk sentiment’s direct impact on ETHUSD without further clarity.
The 'Electricity is the Real Bottleneck for AI' news from commodities, though seemingly unrelated, hints at broader inflationary pressures and supply chain dynamics that central banks are closely monitoring. While this is not directly impacting ETHUSD's price today, such macro-level concerns can influence central bank policy decisions, particularly regarding interest rates. If inflation remains persistently high, central banks might be forced to maintain a hawkish stance or even tighten further, which would generally be negative for risk assets. The Forex news indicates a strong dollar rally, with USDCHF strengthening significantly due to a hawkish Fed and a dovish SNB. This reinforces the dollar's strength narrative, adding another layer of complexity to ETHUSD's outlook. The continued strength of the US Dollar, supported by Fed repricing and geopolitical events, is a significant factor that cannot be ignored when assessing ETHUSD's potential movements.
On-Chain Metrics and Crypto-Specific Fundamentals
Delving into the on-chain data for Ethereum provides a more granular view of network health and investor behavior, which is crucial for a comprehensive ETHUSD analysis. Active addresses, a key metric for network usage, have seen fluctuations, but a sustained increase would signal growing adoption and utility, typically a bullish fundamental driver. Whale movements, defined as large wallet transactions, are also critical. A significant accumulation by whales could indicate strong conviction from large holders, while large outflows from whale addresses might suggest impending selling pressure. Exchange flows are another vital data point; a consistent net inflow of ETH onto exchanges often precedes periods of selling, as holders prepare to liquidate. Conversely, net outflows suggest accumulation and a belief in future price appreciation.
The DeFi and NFT ecosystems, integral to Ethereum's value proposition, also warrant attention. Total Value Locked (TVL) in DeFi protocols serves as a proxy for the amount of capital deployed in decentralized finance applications. An increasing TVL suggests growing confidence and activity within the DeFi space, which can positively influence ETH demand. Similarly, the health of the NFT market, measured by trading volumes and floor prices for major collections, reflects broader market sentiment and demand for Ethereum-based digital assets. Developments in these sectors, such as the launch of new innovative DeFi protocols or significant NFT sales, can act as catalysts for ETH price movements. The current state of these ecosystems, though not directly provided in the market data, forms the backdrop against which technical signals must be interpreted.
Regulatory news continues to be a significant factor for the entire cryptocurrency market, and Ethereum is no exception. Any developments regarding the regulatory status of ETH, the potential approval or rejection of ETH-based ETFs, or new guidelines for staking and DeFi operations can have a substantial impact. While no specific regulatory news was highlighted in the last 48 hours, the market remains sensitive to any such developments. Institutional adoption trends, such as the flow of capital into Bitcoin ETFs and the growing interest in Ethereum staking yields, also play a role. Positive institutional sentiment can lead to increased demand for ETH, supporting its price even amidst broader market uncertainty. The interplay between these fundamental factors and the technical readings provides a more robust framework for evaluating ETHUSD's potential trajectory.
Trading Stance and Outlook: What to Watch Next
Given the current technical landscape for ETHUSD, a clear directional bias is difficult to establish firmly. The daily chart's strong downtrend (ADX 39.27) is a significant bearish signal, suggesting that any rallies might be short-lived opportunities for profit-taking rather than the start of a sustained upward move. However, the conflicting signals on lower timeframes, particularly the bullish momentum on the 1-hour chart and the potential for oversold conditions developing on the daily Stochastic, indicate that the market is not yet fully committed to a downward trajectory. The price consolidation around $1,735.67 suggests indecision, and a catalyst will likely be needed to break this stalemate.
My current stance is one of cautious observation, leaning towards a 'WATCH_ZONE' approach. The market is not yet presenting a high-probability setup for a decisive entry in either direction. For a bullish thesis to gain traction, ETHUSD would need to decisively break above the immediate 1-hour and 4-hour resistance levels, particularly the $1,738.33 and $1,743.29 marks. A sustained close above the daily resistance at $1,723.68 would be a stronger confirmation, but even then, the overarching bearish trend indicated by the daily ADX would need to be carefully monitored. The RSI would ideally need to climb above 50 and show sustained upward momentum.
Conversely, a bearish continuation would be confirmed by a clear break below the 1-hour support at $1,728.41 and, more importantly, the 4-hour support at $1,720.99. A daily close below the significant support at $1,683.33 would strongly suggest a deeper decline. Until one of these key levels is decisively breached with conviction and confirmed by momentum indicators, trading ETHUSD carries elevated risk. The current flat week might be a period of accumulation or distribution before a larger move, and patience is paramount. Traders should focus on managing risk, waiting for clear signals, and not forcing trades in an indecisive market. The interplay between macro factors, like the DXY's trajectory, and crypto-specific sentiment will be crucial in determining the eventual breakout direction.
Bearish Scenario: Downtrend Continuation
65% ProbabilityNeutral Scenario: Range-Bound Consolidation Continues
25% ProbabilityBullish Scenario: Reclaim and Rally
10% ProbabilityFrequently Asked Questions: ETHUSD Analysis
What happens if ETHUSD breaks below the $1,728.41 support level?
A break below the $1,728.41 support on the 1-hour chart could signal a continuation of the bearish trend observed on the daily timeframe. This would likely target the next significant support at $1,720.99, potentially leading to further downside towards $1,707.86 as sellers seize control.
Should I buy ETHUSD at current levels of $1,735.67 given the mixed indicator signals?
Buying at current levels of $1,735.67 is not recommended due to the prevailing bearish trend on the daily chart and mixed signals. A higher probability setup would involve waiting for a confirmed break above $1,743.29 resistance, or a clear bounce from a more significant support level like $1,707.86, with confirmation from momentum indicators.
Is the RSI at 42.76 a bearish signal for ETHUSD right now?
An RSI reading of 42.76 on the daily chart is in neutral territory but leans bearish, indicating a lack of strong buying pressure and suggesting potential for further downside. While not an immediate sell signal, it supports the overall bearish sentiment seen in other daily indicators like the MACD and ADX.
How will the current DXY strength at 100.82 potentially affect ETHUSD this week?
The current DXY strength, trading at 100.82 and showing a strong daily bullish trend, typically puts downward pressure on risk assets like ETHUSD. This could limit upside potential and increase the likelihood of ETHUSD testing its support levels as capital flows towards the perceived safety of the US dollar.
| Indicator | Value | Signal | Interpretation |
|---|---|---|---|
| RSI (14) | 42.76 | Bearish | Neutral territory, leaning down |
| MACD Histogram | [Value from market data] | Bullish | Positive momentum observed |
| Stochastic | K:43.27, D:64.01 | Bearish | %K below %D, bearish cross |
| ADX | 39.27 | Strong Trend | Confirms a strong downtrend |
| Bollinger | Middle Band | Below Band | Price below middle band |
The past week has been characterized by consolidation for ETHUSD around the $1,735.67 level. While shorter timeframes show some bullish flickers, the dominant daily trend remains bearish, reinforced by a strong ADX reading and negative MACD momentum. The conflicting signals create an indecisive market, where patience and strict risk management are paramount. Key support at $1,728.41 and resistance at $1,738.33 will be critical to watch in the coming days. Macroeconomic factors, particularly the strength of the DXY at 100.82, add a layer of caution, potentially capping any upside moves.
Track markets in real-time
AI-powered analysis, technical indicators and real-time price data.
Join Our Telegram Channel
Breaking market news, AI analysis and trading signals instantly.
Join Channel