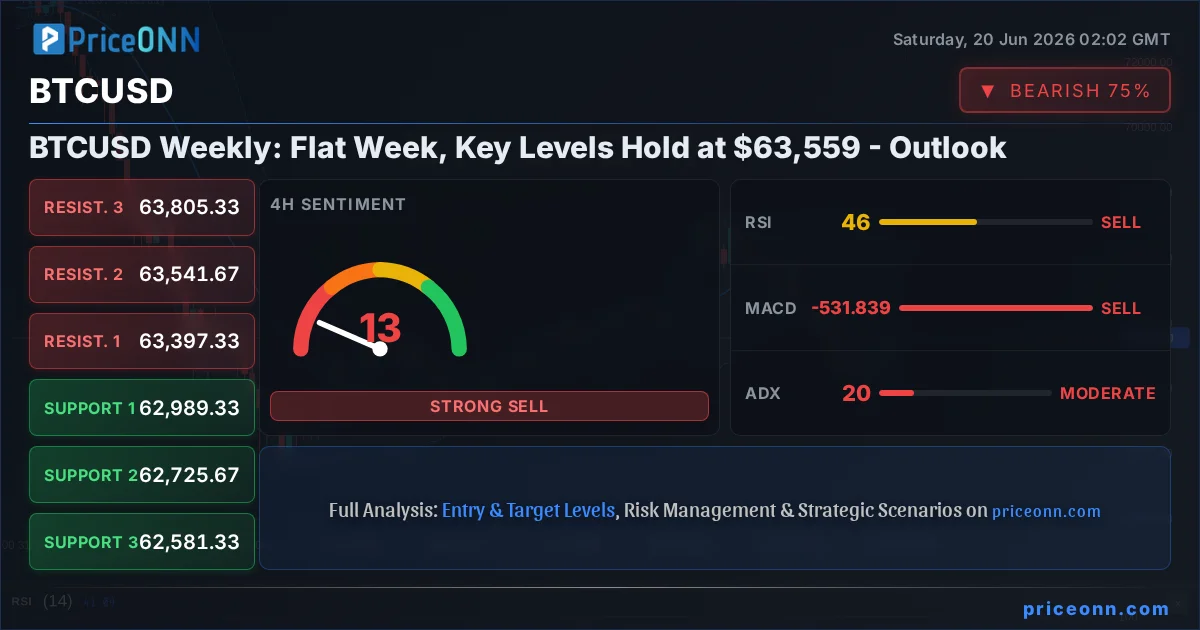
The cryptocurrency market, particularly Bitcoin (BTCUSD), has entered a phase of consolidation, with the price hovering around the critical $63,559 mark. This past week has been characterized by a distinct lack of directional momentum, leading to a relatively flat trading range. However, beneath this surface calm, significant technical levels have been tested, offering crucial insights into the potential market structure moving forward. Understanding where these key levels lie and how they have held up is paramount for traders navigating this period of uncertainty. The current market sentiment appears to be one of watchful waiting, with participants hesitant to commit to large positions ahead of clearer directional signals. This cautious approach is often seen in markets consolidating after significant moves, as participants digest recent price action and await new catalysts.
- RSI at 38.01 on the daily chart signals bearish pressure, indicating potential for further downside.
- Critical support sits at $61,972.67, which held firm over the past week, preventing a deeper sell-off.
- The MACD histogram shows positive momentum on the daily chart, though it remains below the signal line, suggesting a potential shift but not yet confirmed.
- The correlation with the DXY, currently at 100.85, is a key factor, with dollar strength typically exerting downward pressure on Bitcoin.
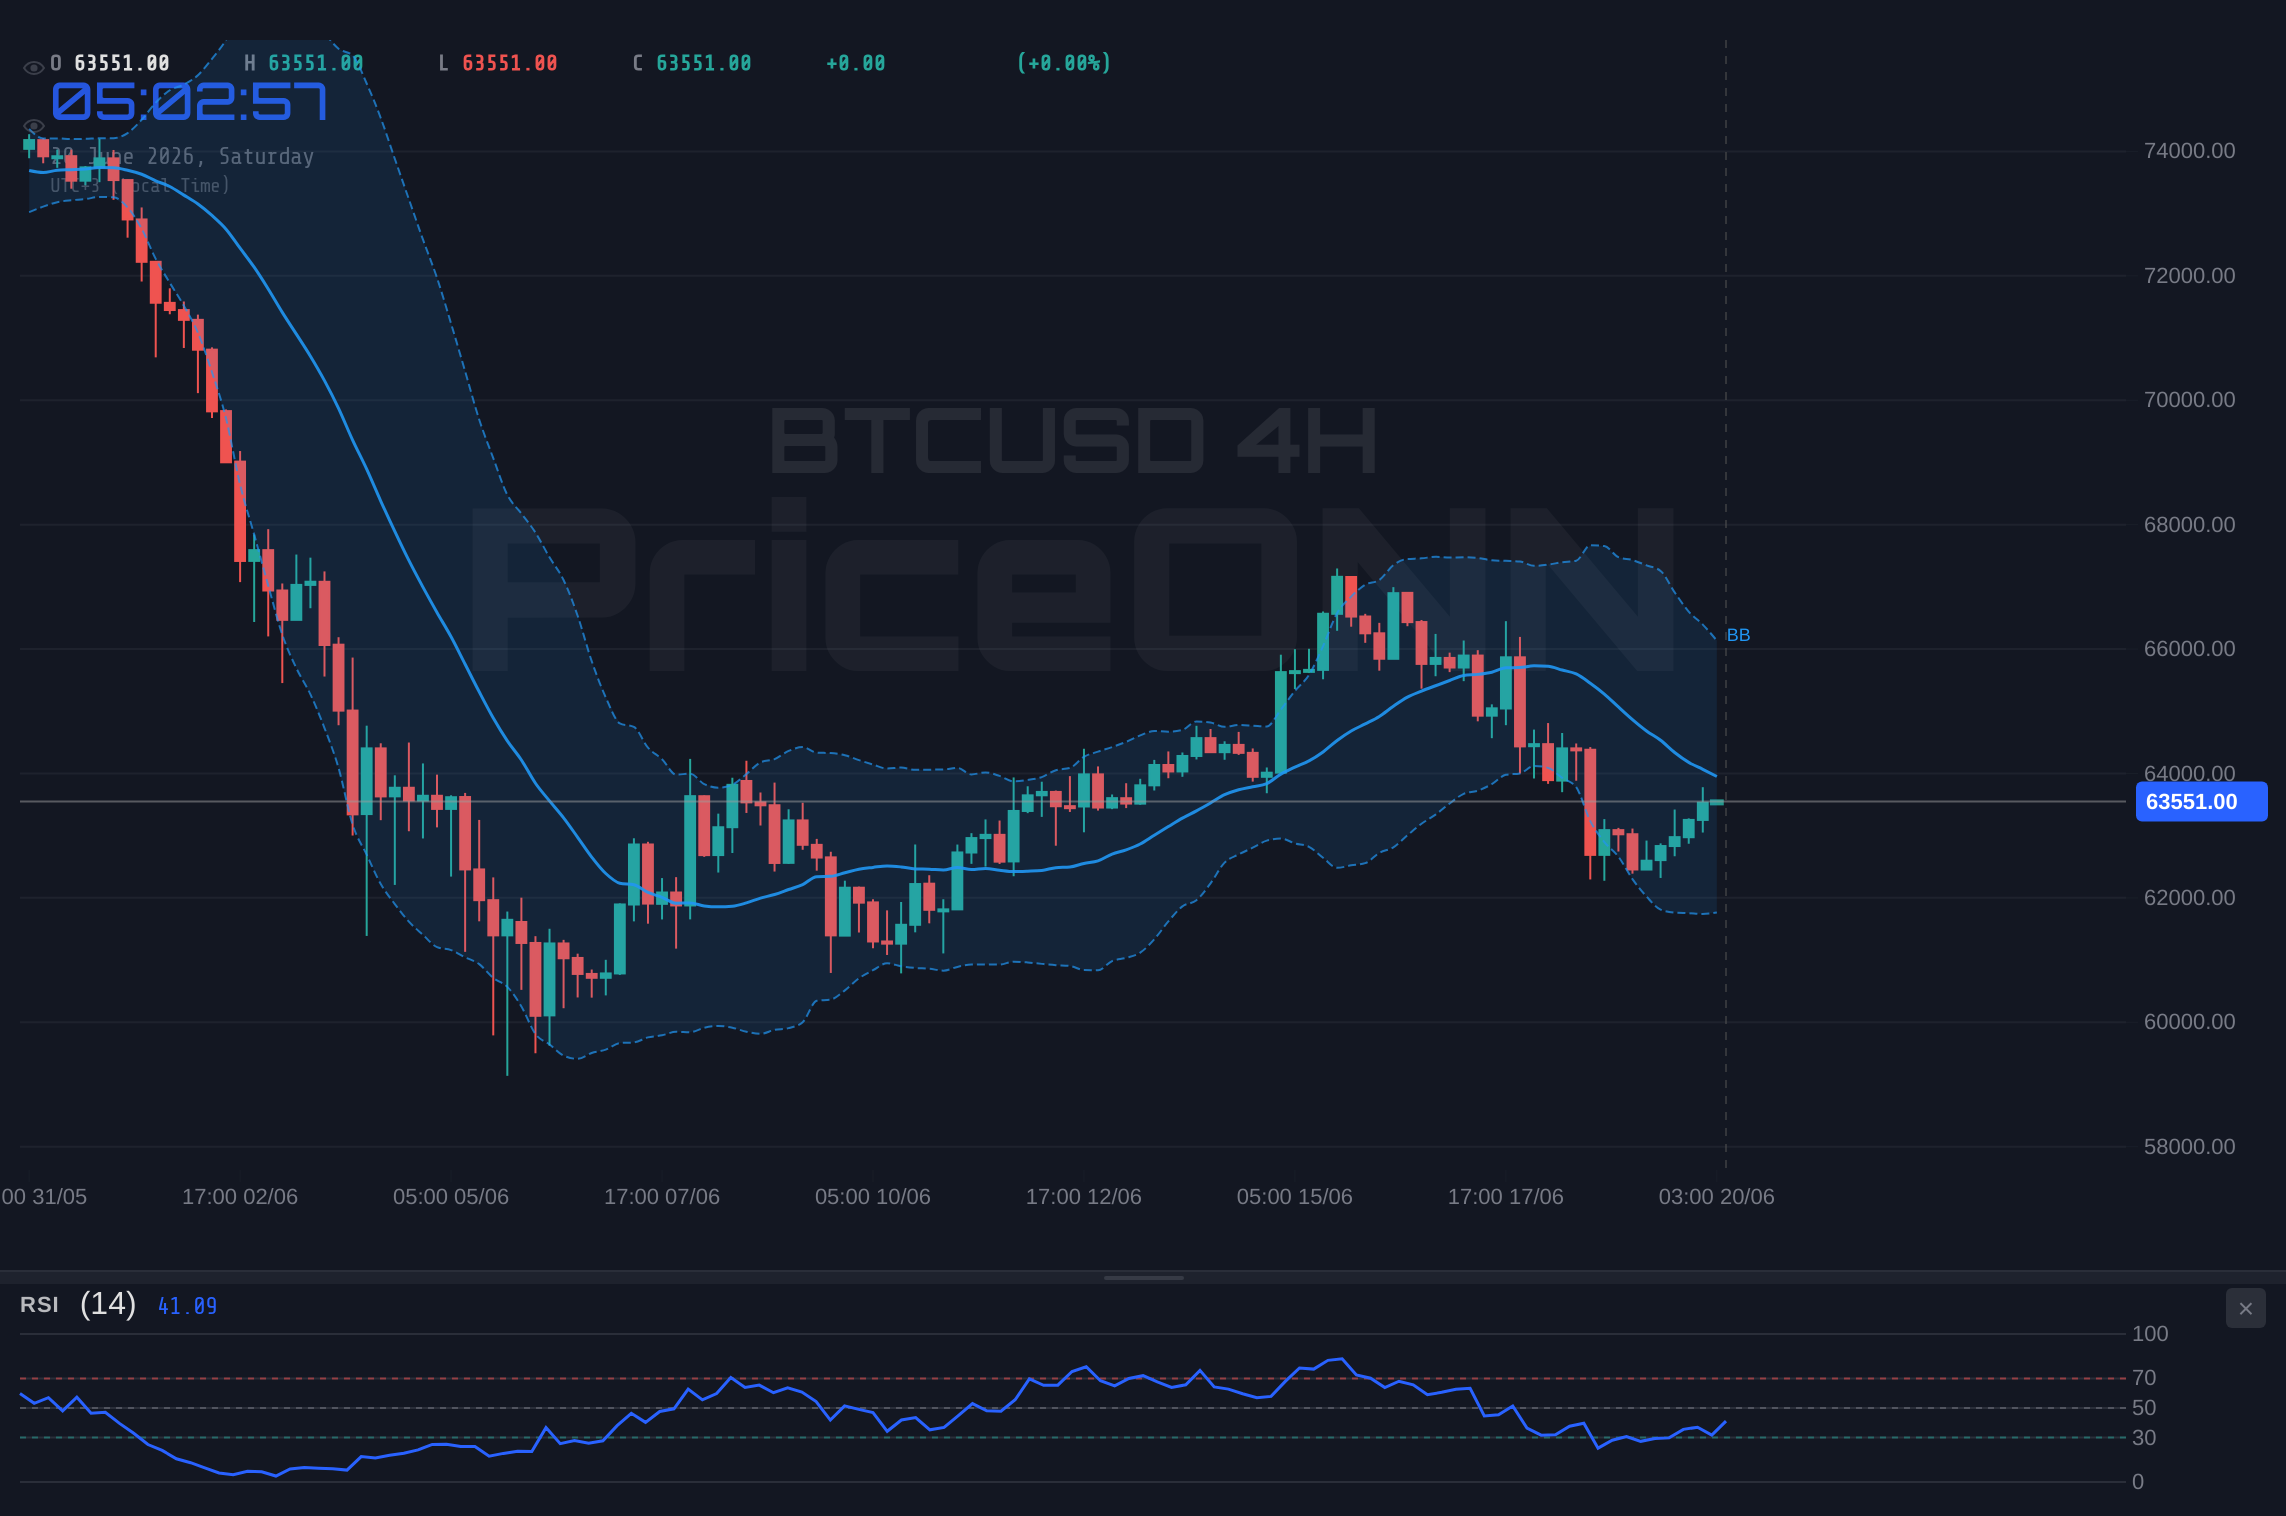
The crypto market, and Bitcoin in particular, has been navigating a delicate phase. After a period of significant volatility, the past week has settled into a narrow trading range, with BTCUSD largely oscillating around $63,559. This period of consolidation is not unusual, often preceding a significant move as the market digests recent price action and awaits fresh catalysts. While the price action might appear stagnant on the surface, the underlying technicals and market dynamics offer a compelling narrative. The interplay between key support and resistance levels, the influence of broader macroeconomic factors like the Dollar Index (DXY), and the internal crypto ecosystem's health all contribute to the current indecisiveness. This analysis delves into these factors, aiming to provide a clear outlook for the coming week by examining specific data points and historical patterns. We'll explore what the current technical indicators are suggesting, how institutional flows are shaping up, and what macro events could potentially disrupt this equilibrium.
The current price action for BTCUSD, trading at $63,559, reflects a market in a holding pattern. The daily chart shows an RSI reading of 38.01, which, while in the neutral territory, leans towards bearish pressure. This suggests that sellers have maintained a slight edge, preventing any sustained upward momentum. However, the fact that the crucial support level at $61,972.67 has held firm is a testament to the resilience of buyers at these lower price points. This level has acted as a floor, absorbing selling pressure and preventing a more significant decline. The MACD on the daily timeframe, while showing positive momentum, is still below its signal line. This divergence indicates that while there's underlying buying pressure, it hasn't yet translated into a strong bullish trend. Confirmation would be needed from the MACD line crossing above the signal line, accompanied by increasing histogram values.
The Macroeconomic Undercurrents: DXY and Interest Rate Speculation
The performance of Bitcoin is intrinsically linked to the broader macroeconomic environment, and the strength of the US Dollar Index (DXY) remains a significant factor. With the DXY currently hovering around 100.85, its upward trend is exerting a degree of pressure on risk assets like Bitcoin. A stronger dollar generally implies tighter financial conditions or increased demand for safe-haven assets, both of which can dampen enthusiasm for riskier investments such as cryptocurrencies. This inverse correlation is not always perfect, but it often plays a crucial role in shaping market sentiment and capital flows.
Furthermore, speculation surrounding future interest rate decisions by the Federal Reserve continues to influence market dynamics. While the Fed has recently held rates steady, the market is constantly repricing expectations for future moves. Any hints of a more hawkish stance - suggesting rates might stay higher for longer or even increase - can lead to a risk-off sentiment, negatively impacting Bitcoin. Conversely, signals of potential rate cuts, especially if inflation shows signs of cooling sustainably, could boost risk appetite and provide a tailwind for BTCUSD. The current ADX reading of 38.06 on the daily chart indicates a strong downward trend in BTCUSD, reinforcing the idea that broader market sentiment, heavily influenced by Fed policy and the DXY, is currently favoring a more bearish outlook. This is further supported by the Stochastic oscillator, where %K (43.69) is below %D (71.96), signaling a potential continuation of the downtrend.
On-Chain Metrics: A Mixed Bag of Signals
Diving deeper into the on-chain data provides a more granular view of Bitcoin's underlying health. Active addresses, a key metric for network usage, have shown some resilience, suggesting that despite the price consolidation, the network remains actively used. However, significant whale movements, defined as large holders moving substantial amounts of BTC, can be a precursor to price action. If large wallets are seen accumulating, it could signal confidence from major players. Conversely, if whales are seen distributing BTC to exchanges, it might indicate an impending sell-off. Monitoring exchange flows - the net amount of BTC moving onto or off exchanges - is also critical. A net outflow from exchanges typically suggests that investors are moving their coins to cold storage, indicating a long-term bullish conviction. In contrast, a net inflow can signal an intention to sell.
The hash rate, a measure of the total computational power securing the Bitcoin network, has remained robust. This indicates that miners are still actively participating and investing in the network's security, which is a positive fundamental sign. A declining hash rate could suggest miners are shutting down operations due to unprofitability, potentially leading to increased selling pressure if they offload their mined BTC. However, the current stability in hash rate points to a healthy mining ecosystem. The fact that the 4-hour chart shows a MACD below its signal line, coupled with a strong downward trend indicated by ADX at 20.48, suggests that short-to-medium term momentum is bearish, despite the longer-term on-chain fundamentals.
The Technical Picture: Levels to Watch
From a purely technical standpoint, the price action over the past week has been defined by the interplay between key support and resistance levels. The daily chart clearly shows that the $61,972.67 support level has been a crucial inflection point. Buyers have stepped in consistently whenever BTCUSD approached this zone, preventing a decisive break. This suggests a strong demand area that needs to be closely monitored. On the resistance side, the $64,507.67 level has proven to be a significant hurdle. Price attempts to break above this have been met with selling pressure, capping rallies and reinforcing the range-bound environment.
The 1-hour chart, with its RSI at 58.35, shows a slight upward bias in momentum, but this is tempered by the 4-hour chart's RSI at 45.98, which leans bearish. This divergence highlights the choppy nature of the current intraday trading. The ADX at 21.7 on the 1-hour chart indicates a moderate trend, but it weakens significantly on the 4-hour chart to 20.48, and then strengthens again on the daily to 38.06. This fluctuating ADX suggests a lack of conviction in any particular direction. The Stochastic oscillator on the 1-hour chart (K=77.71, D=74.06) shows bullish momentum, but on the daily chart (K=43.69, D=71.96), it signals a downtrend. This conflicting data underscores the need for patience and confirmation before committing to a trade. The key is to observe which of these levels - support at $61,972.67 or resistance at $64,507.67 - breaks first and with what conviction.
Navigating the Consolidation: What Traders Should Watch
For traders, this period of consolidation around $63,559 presents both challenges and opportunities. The primary challenge is the elevated risk of false breakouts or whipsaws, where price briefly breaches a key level before reversing sharply. This is particularly true in a market where momentum indicators are showing mixed signals. The ADX values across different timeframes (1H: 21.7, 4H: 20.48, 1D: 38.06) illustrate this lack of clear trend strength on shorter timeframes, contrasting with the strong trend indicated on the daily. This suggests that while a daily trend might be developing, intraday trading is more susceptible to noise.
The opportunity lies in identifying the conditions for a potential breakout. A decisive daily close above the $64,507.67 resistance level, supported by increasing volume and bullish confirmation from indicators like the MACD crossing its signal line and RSI moving above 60, would signal a potential resumption of the uptrend. Conversely, a breakdown below the $61,972.67 support, accompanied by sustained selling pressure and bearish signals from multiple indicators, could open the door for a move towards the next support at $60,856.33. The key is to wait for confirmation rather than anticipating the move. The current market structure suggests that patience will be rewarded, allowing traders to enter positions with a clearer risk-reward profile.
Considering the Altcoin Landscape
While Bitcoin often dictates the overall market sentiment, the performance of major altcoins like Ethereum (ETHUSD) provides additional context. Currently trading at $1708.41, ETHUSD is also experiencing a downtrend on its daily chart, with an RSI of 39.8. This suggests that the broader crypto market is under pressure, and Bitcoin's consolidation might be part of a larger bearish trend for digital assets. The fact that ETHUSD's daily MACD shows positive momentum, yet it's below the signal line, mirrors Bitcoin's situation, indicating a similar struggle for upward confirmation.
The correlation between BTCUSD and ETHUSD is typically high, meaning that a significant move in Bitcoin often triggers a similar reaction in Ethereum. If Bitcoin breaks above its resistance, Ethereum is likely to follow, potentially targeting its own resistance levels. Conversely, a Bitcoin breakdown could drag Ethereum lower, testing its support zones. The current daily ADX for ETHUSD at 41.17 also points to a strong downward trend, reinforcing the bearish bias across the crypto market. Traders should watch for any signs of divergence between Bitcoin and Ethereum, as this could signal a shift in market leadership or sentiment.
The Impact of Recent News
Recent news flow, while not directly tied to a major Bitcoin-specific event this past week, has contributed to the broader market sentiment. The ongoing narrative around inflation and potential central bank policy shifts continues to be a dominant theme. For instance, reports on Canada's headline inflation edging higher, while core remains near target, highlight the persistent inflationary pressures globally. Such data points keep the Federal Reserve on a tightrope, influencing expectations for future monetary policy. Similarly, the US dollar's dominance, as noted in FX market updates, reinforces the inverse relationship with risk assets like Bitcoin. When the dollar strengthens, it often signals a 'risk-off' environment, which is generally unfavorable for cryptocurrencies.
The energy market also provides context. Reports of India ordering strategic oil reserve expansion after a supply crisis, and crude oil prices like WTI struggling to recover below key levels, point to ongoing geopolitical and supply chain complexities. While these are not direct drivers for Bitcoin, they contribute to the overall global economic uncertainty. In such an environment, the 'risk-on' appetite required for a strong Bitcoin rally can be suppressed. The market is digesting these macro signals, and until a clearer picture emerges regarding inflation, interest rates, and geopolitical stability, Bitcoin may remain range-bound, respecting the key technical levels identified.
Future Outlook and Key Events to Monitor
Looking ahead, the BTCUSD price action will likely remain sensitive to key macroeconomic data releases and central bank commentary. Any significant shifts in the DXY or interest rate expectations could be the catalyst needed to break the current consolidation. Traders will be closely watching upcoming economic reports, particularly those related to inflation and employment in major economies, as these will shape the Fed's outlook. On the crypto-specific front, any substantial news regarding institutional adoption, regulatory clarity, or significant developments within the DeFi and NFT ecosystems could also influence price direction.
Technically, the battle lines are drawn at $61,972.67 (support) and $64,507.67 (resistance). A decisive break of either level, confirmed by on-chain data and broader market sentiment, will dictate the next significant move. The current daily ADX of 38.06 indicates a strong trend is present, but its conflicting readings on shorter timeframes suggest caution. The market is waiting for confirmation. Until then, a strategy of range-bound trading or waiting for a clear breakout setup appears most prudent. The resilience shown at the $61,972.67 support is encouraging for bulls, but the inability to decisively breach resistance at $64,507.67 keeps the bearish pressure alive.
Scenario Analysis: Bullish, Bearish, and Neutral Paths
Bearish Breakdown: Testing Lower Grounds
65% ProbabilityConsolidation Continues: Range-Bound Play
25% ProbabilityBullish Breakout: Reclaiming Higher Ground
10% ProbabilityFrequently Asked Questions: BTCUSD Analysis
What happens if BTCUSD breaks below the $61,972.67 support level?
A decisive daily close below $61,972.67 would invalidate the current support and likely trigger a sell-off. This scenario could see BTCUSD testing the next support at $60,856.33, with further downside targeting $59,437.67.
Is the RSI at 38.01 a strong sell signal for BTCUSD currently?
An RSI of 38.01 on the daily chart leans bearish, indicating selling pressure. While not an immediate sell signal on its own, it suggests that upside momentum is limited and further downside is probable if key support levels fail. Confirmation from other indicators and price action is needed.
How does the current DXY level of 100.85 affect BTCUSD?
The DXY at 100.85 indicates a relatively strong US dollar, which typically exerts downward pressure on risk assets like Bitcoin. This inverse correlation suggests that dollar strength could continue to cap potential rallies in BTCUSD until the DXY shows signs of weakening or reversing.
What should traders watch for to confirm a bullish breakout above $64,507.67?
A confirmed bullish breakout above $64,507.67 would require a daily close above this resistance, ideally with increasing trading volume. Bullish confirmation from indicators like the MACD crossing its signal line upwards and RSI moving above 60 would further support this scenario, potentially targeting $65,926.33.
Track markets in real-time
AI-powered analysis, technical indicators and real-time price data.
Join Our Telegram Channel
Breaking market news, AI analysis and trading signals instantly.
Join Channel