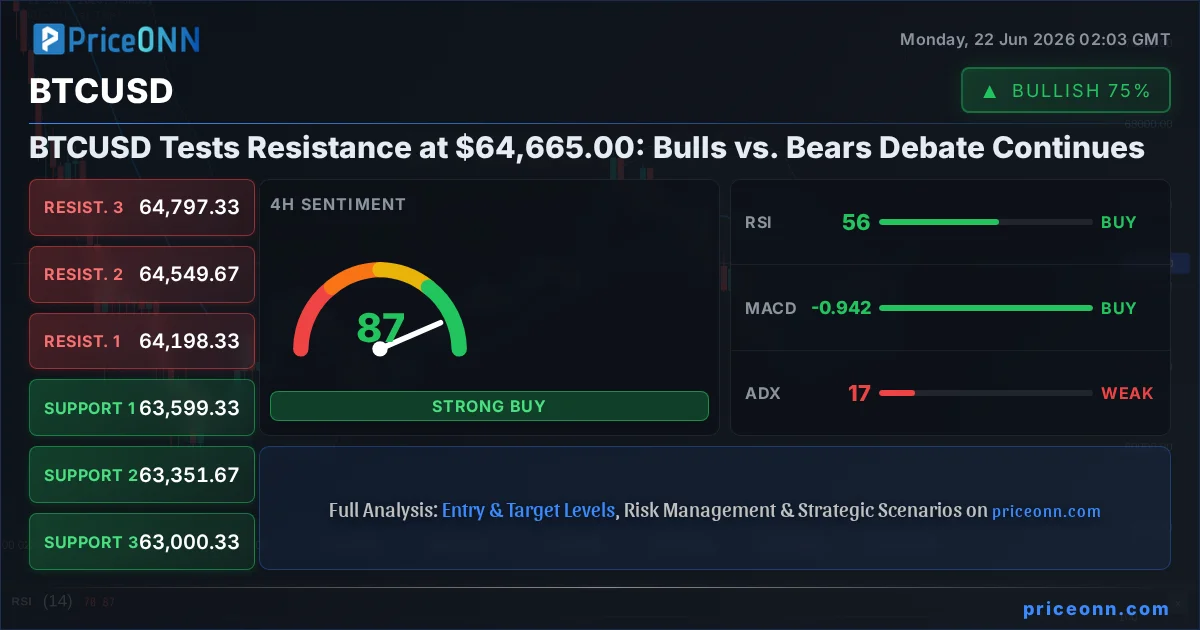
The cryptocurrency market is at a critical juncture, with Bitcoin (BTCUSD) consolidating near the significant resistance level of $64,665.00. This price point is more than just a number; it represents a battleground where bulls and bears are fiercely contesting control. Having experienced a notable surge, Bitcoin now faces the daunting task of breaking through this psychological and technical barrier. The current market sentiment, as indicated by the RSI at 61.96 on the 1-hour chart, suggests lingering bullish momentum, yet the proximity to resistance and broader market correlations, particularly with the strengthening US Dollar Index (DXY) at 100.91, introduces a layer of caution. This analysis delves into the intricate dynamics at play, dissecting the arguments for both a continued ascent and a potential pullback, and examining the technical indicators and fundamental factors that could sway the market's direction.
- Bitcoin faces key resistance at $64,665.00, with the 1-hour RSI at 61.96 signaling ongoing bullish pressure but nearing overbought territory.
- Critical support for BTCUSD is identified at $63,443.67, while resistance looms at $64,552.33 and $65,007.67.
- The MACD histogram on the 1-hour chart shows negative momentum, diverging from the RSI's bullish lean, suggesting a potential weakening of upward force.
- The strengthening DXY at 100.91 presents a headwind, as a stronger dollar typically correlates with pressure on risk assets like Bitcoin.
The Bullish Case: A Breakout on the Horizon?
The bulls are certainly making their presence felt, pushing BTCUSD towards the $64,665.00 mark. On the 1-hour timeframe, the technical indicators offer a somewhat optimistic picture. The RSI at 61.96, while not yet in extreme overbought territory, shows a clear upward trend, indicating that buyers have been active. The MACD, despite its histogram showing negative momentum on this specific timeframe, has its MACD line above the signal line, which can sometimes precede a bullish crossover. More significantly, the Stochastic oscillator is showing a clear bullish signal with %K (51.02) crossing above %D (35.57), suggesting upward momentum is building from oversold conditions on shorter timeframes. The ADX at 22.14 on the 1-hour chart indicates a moderately strong uptrend is developing, providing a foundation for further price appreciation. The overall 'AL' (Buy) signal on the 1-hour chart, with 7 buy signals versus 1 sell signal, further bolsters the bullish sentiment for intraday traders. This confluence of signals suggests that if the bulls can maintain their pressure, a decisive breakout above the $64,665.00 resistance could be on the cards, potentially targeting higher levels.
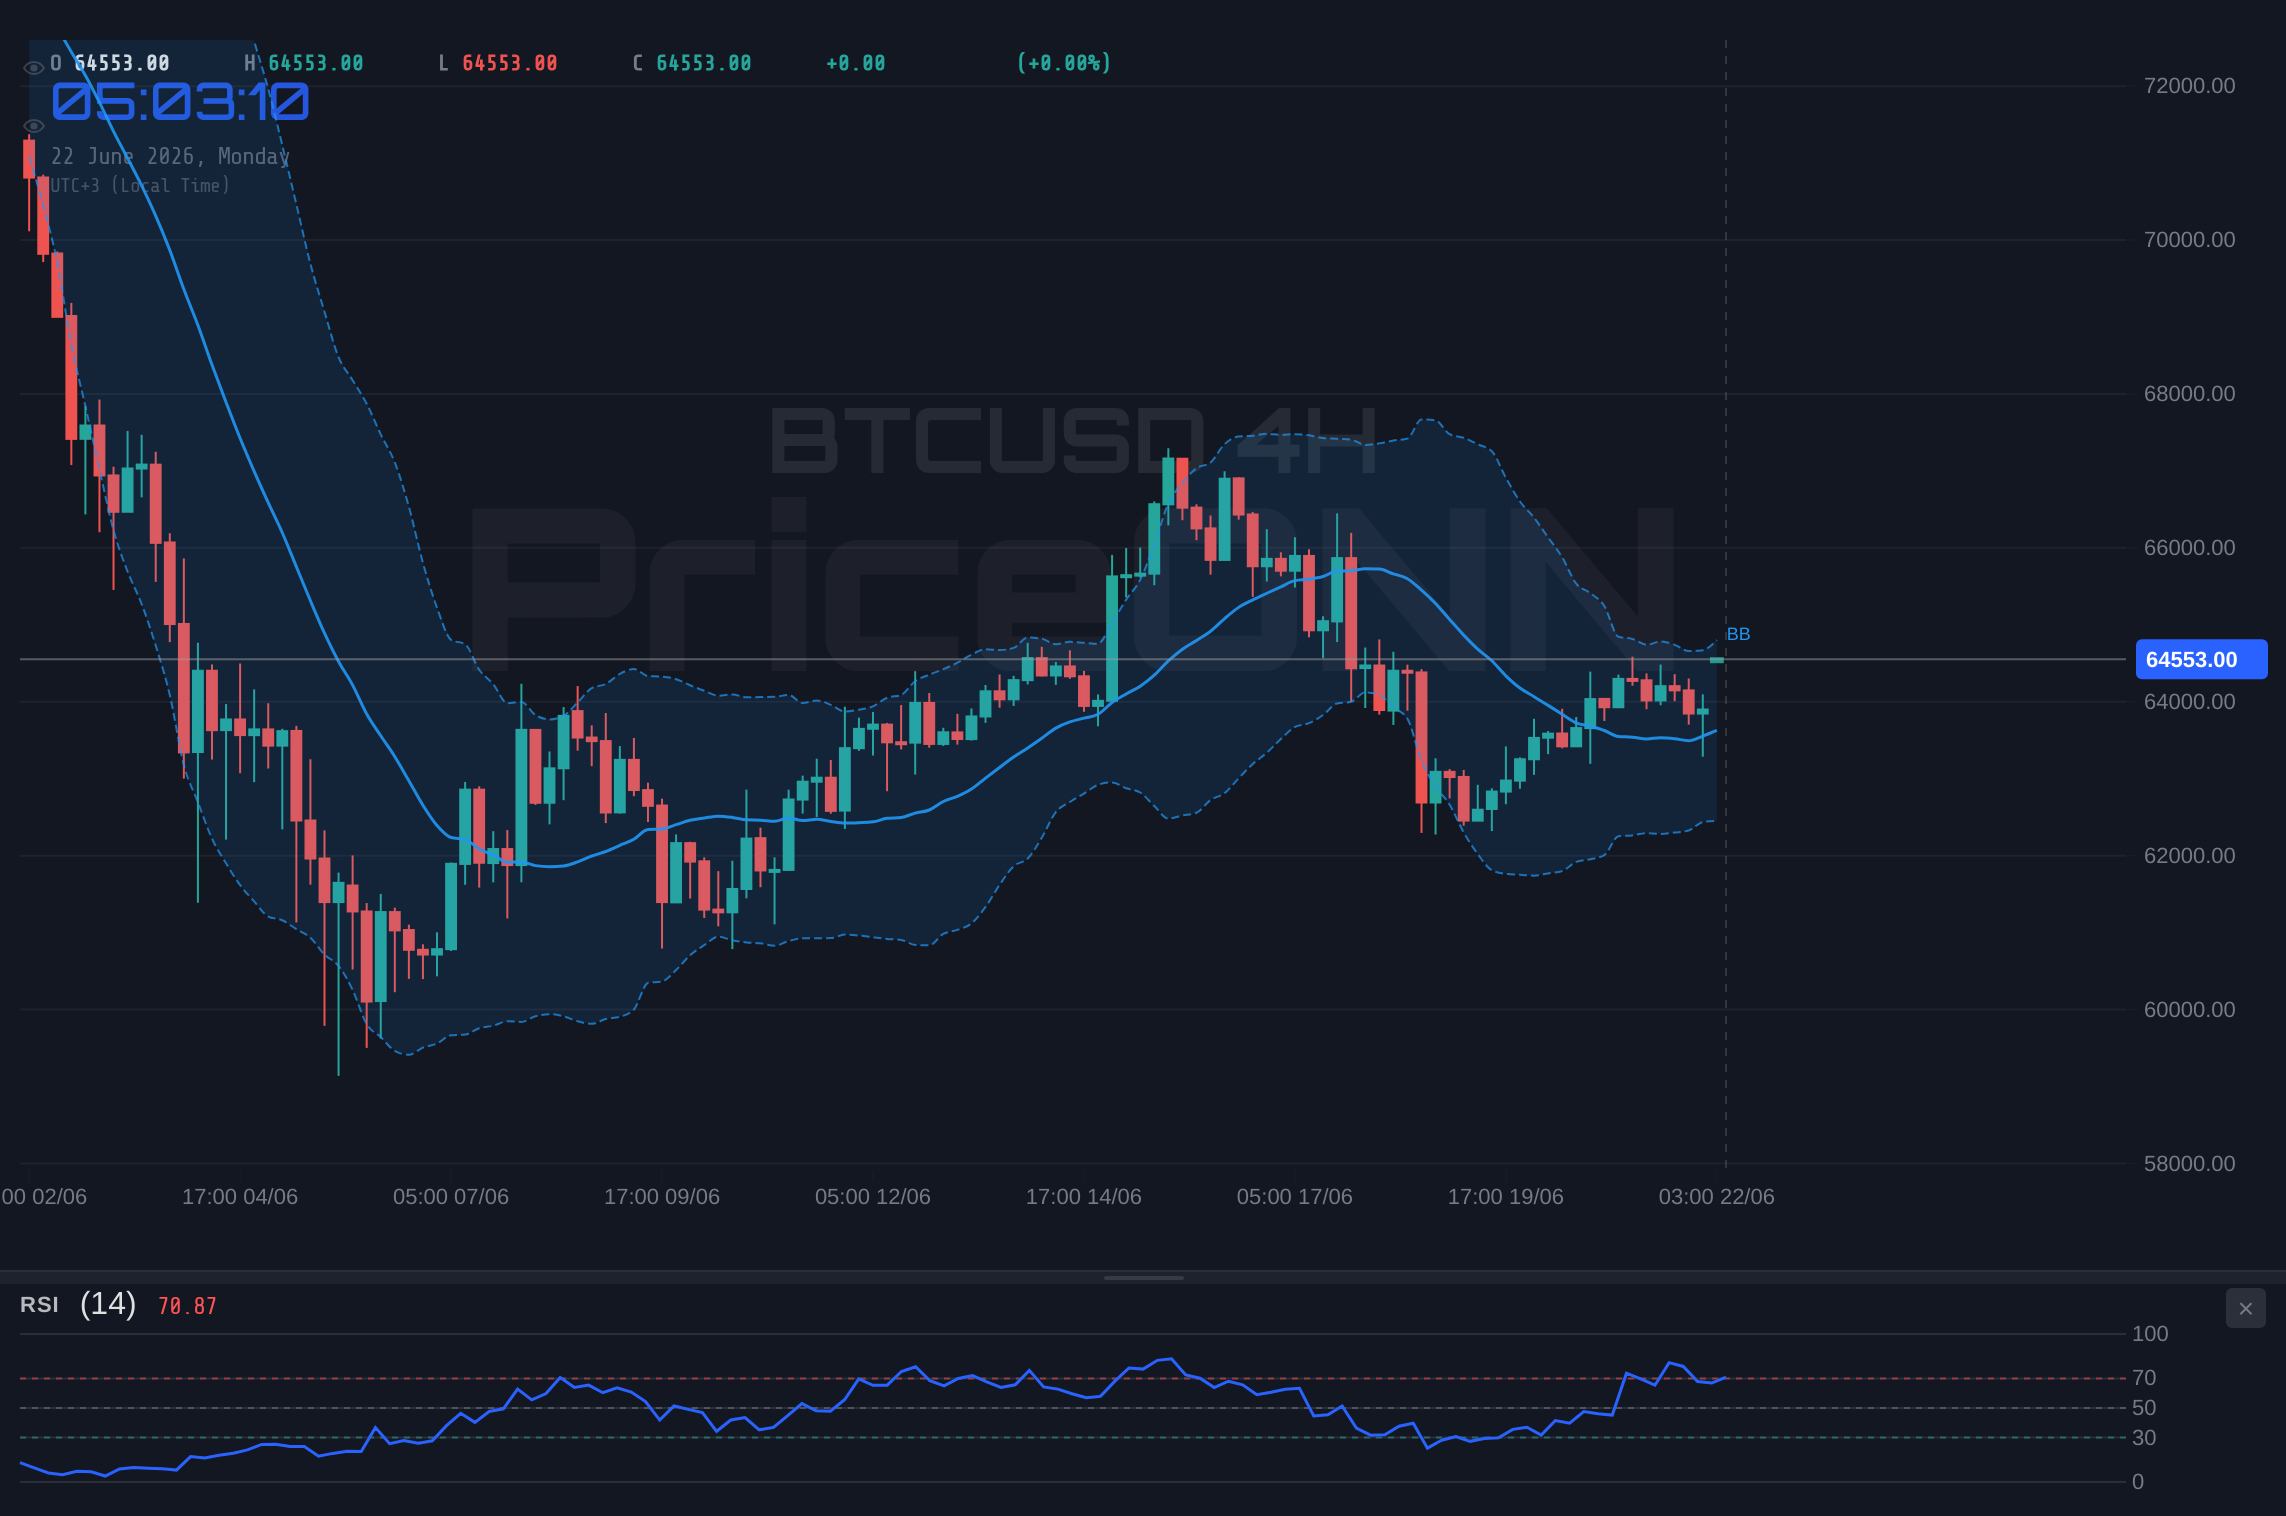
Furthermore, the 4-hour chart, while showing a mixed signal with 6 'AL' and 2 'SAT' indicators, still leans positive. The RSI at 57.29 remains in bullish territory, and the MACD is showing positive momentum with the MACD line above the signal line. The Stochastic oscillator here is showing a slight bearish divergence (%K=71.84, %D=73.28), but the overall trend strength indicated by ADX at 16.57 is weak, suggesting consolidation rather than a strong reversal. This implies that the current price action might be a period of accumulation before the next significant move. From a fundamental perspective, any positive news regarding institutional adoption, regulatory clarity, or a broader market risk-on sentiment could act as a catalyst. The recent inflows into Bitcoin ETFs, although not explicitly detailed in the provided data, remain a foundational support for a bullish outlook. The halving event earlier this year has historically been a precursor to bull cycles, and many analysts believe we are still in the early stages of a new upward trend, with current price action merely a pause before the next leg higher.
The sheer resilience shown by Bitcoin in recent weeks, bouncing back from lower levels and consistently finding buyers near the $63,000 region, speaks volumes about underlying demand. The support level at $63,443.67 on the 1-hour chart has acted as a crucial floor, preventing a deeper correction. If this level holds, it reinforces the idea that the market is in a higher-low formation. The bullish case hinges on the ability of buyers to absorb the selling pressure expected around the $64,665.00 resistance. A successful breach above this level, particularly with increasing volume, would likely trigger a cascade of buy orders as traders and algorithms react to the breakout confirmation. This could then open the path towards the next significant resistance at $65,007.67, and potentially further towards $65,552.33.
The Bearish Counter-Argument: Resistance Holds Firm
However, the narrative is far from one-sided. The resistance at $64,665.00 is a formidable barrier, and the technical indicators on longer timeframes present a more cautious, if not outright bearish, outlook. The daily chart for BTCUSD paints a starkly different picture. The RSI is at 42.65, indicating a bearish inclination and plenty of room before reaching oversold conditions. The MACD is showing positive momentum, with the MACD line above the signal line, but this is contrasted by the ADX at 35.67, which signifies a strong downtrend is in play. This divergence between MACD's positive momentum and ADX's strong downtrend reading is a classic sign of a market potentially heading lower. The Stochastic oscillator on the daily chart also shows a bearish signal, with %K (38.41) below %D (54.93), suggesting downward pressure is building. The overall 'SAT' (Sell) signal on the daily chart, with 5 sell signals versus 3 buy signals, strongly supports the bearish thesis.
The 4-hour chart also contributes to the bearish argument. While the 1-hour and 4-hour charts show some bullish signs, the overall trend strength on the 4-hour is weak (ADX 16.57), and the Stochastic's bearish crossover (%K=71.84, %D=73.28) suggests a potential reversal. The MACD on the 4-hour chart is showing positive momentum, but this is overshadowed by the daily chart's bearish signals. The fact that Bitcoin is currently trading below the upper Bollinger Band on the 1-hour chart, and the middle band on the 4-hour and daily charts, indicates potential overextension or a struggle to maintain upward velocity. The immediate support level at $63,443.67 is critical; a failure to hold this level would invalidate the short-term bullish setup and likely accelerate selling towards the next support at $62,988.33, and potentially down to $62,661.67.
Furthermore, the correlation with the US Dollar Index (DXY) cannot be ignored. The DXY is currently trading at 100.91, showing strength on the 1-hour (ADX 35.82) and 4-hour (ADX 46.59) charts, and a strong uptrend on the daily (ADX 32.38). A rising DXY generally puts pressure on risk assets like Bitcoin, as a stronger dollar makes dollar-denominated assets more expensive for holders of other currencies and can signal a shift towards safer assets. This macro backdrop provides a significant headwind for Bitcoin bulls. If the DXY continues its upward trajectory, it could easily drag BTCUSD lower, regardless of the short-term bullish technical signals on crypto-specific charts. The prevailing narrative of sticky inflation and potential Fed hawkishness, as hinted at by recent news regarding the Federal Reserve's stance on interest rates, further supports a stronger dollar and, consequently, a weaker Bitcoin.
Technical Showdown: Indicators in Conflict
The technical landscape for BTCUSD is a fascinating tug-of-war between different timeframes and indicators. On the 1-hour chart, the general signal is 'AL' (Buy), driven by RSI (61.96), Stochastic (bullish crossover), and a majority of buy signals. The ADX at 22.14 suggests a developing uptrend. However, the MACD histogram shows negative momentum, hinting at waning buying power. This intraday bullish bias is directly challenged by the longer-term daily chart, which presents a predominantly 'SAT' (Sell) signal. Here, the RSI at 42.65, the strong downtrend indicated by ADX 35.67, and the bearish Stochastic signal paint a picture of potential downside. The conflict is clear: short-term traders might see opportunities for quick gains, while longer-term investors might be wary of an impending correction.
The 4-hour chart offers a middle ground, with a mixed bag of signals. While the overall signal leans towards 'AL' (Buy) with 6 out of 8 indicators suggesting a buy, the Stochastic's bearish crossover and the ADX at 16.57 (weak trend) suggest that this bullish momentum might not have strong legs. The key is to observe how price action interacts with the immediate resistance at $64,665.00 and support at $63,443.67. A decisive close above resistance on increased volume, confirmed by bullish signals across multiple timeframes, would validate the short-term bullish outlook. Conversely, a rejection from resistance, followed by a breakdown below the $63,443.67 support, would confirm the bearish bias suggested by the daily chart and the DXY's strength.
The prevailing ADX values across timeframes are telling. On the 1-hour, it's 22.14 (moderate uptrend), on the 4-hour it's 16.57 (weak trend), and on the daily it's 35.67 (strong downtrend). This inconsistency highlights the choppy nature of the current market. A strong ADX on the daily chart suggests that any upward move might be met with significant selling pressure from established downtrend participants. Conversely, the weaker ADX on the 4-hour chart could indicate that the downtrend is losing steam, allowing for short-term bounces. The challenge for traders is to discern which timeframe's trend carries more weight. Given the current price hovering at resistance, the daily chart's strong downtrend signal, coupled with the DXY's strength, suggests that caution is the more prudent approach.
The Verdict: A Watchful Stance Near Resistance
Considering the conflicting signals across different timeframes and the significant resistance at $64,665.00, the most prudent approach for traders right now is to adopt a 'WATCH_ZONE' strategy. The bulls have managed to push the price to a critical level, and the short-term indicators show some positive signs. However, the longer-term daily chart indicators, particularly the ADX at 35.67 indicating a strong downtrend, and the strengthening DXY at 100.91, present a strong case for caution. The market is at an inflection point, and a clear breakout above $64,665.00, confirmed by sustained buying pressure and bullish signals across multiple timeframes, is needed to invalidate the bearish lean. Until then, the risk of a pullback or consolidation remains elevated. The support at $63,443.67 is the immediate level to watch; a failure to hold this could signal the start of a more significant correction, aligning with the daily chart's bearish outlook.
A valid bullish setup would require a decisive daily close above the $64,665.00 resistance zone, ideally accompanied by increasing volume and a shift in longer-term indicators towards a bullish consensus. This would suggest that the bears have been overwhelmed and the market is ready to forge new highs. Conversely, a bearish scenario would be confirmed by a rejection from the current resistance, followed by a breakdown below the $63,443.67 support. This would likely trigger stop-loss orders and accelerate selling towards the next support levels. The current environment demands patience and disciplined risk management. It's a period where observing price action and waiting for clear confirmation signals is paramount, rather than trying to anticipate the next move prematurely.
Bearish Scenario: Resistance Holds, Reversal Looms
65% ProbabilityNeutral Scenario: Consolidation Around Resistance
25% ProbabilityBullish Scenario: Breakout Above Key Level
10% ProbabilityFrequently Asked Questions: BTCUSD Analysis
What happens if BTCUSD breaks above the $64,665.00 resistance zone?
A decisive daily close above $64,665.00 with increased volume would validate the bullish scenario, potentially targeting $65,007.67 and $65,552.33. This would signal a continuation of the uptrend, but confirmation from longer-term indicators is crucial.
Should I consider buying BTCUSD at current levels near $64,665.00 given the RSI at 61.96?
Buying at current resistance levels carries significant risk. While the 1-hour RSI at 61.96 shows bullish pressure, the daily chart's strong downtrend signal (ADX 35.67) and the strengthening DXY at 100.91 suggest caution. A higher probability setup would emerge after a confirmed breakout above resistance or a pullback to a clearly defined support level.
Is the MACD histogram showing negative momentum on the 1-hour chart a sell signal for BTCUSD?
The negative MACD histogram on the 1-hour chart, despite the MACD line being above the signal line, suggests waning buying momentum. While not an immediate sell signal on its own, it indicates potential weakness and could precede a bearish move if other indicators and price action align. It conflicts with the bullish Stochastic signal on the same timeframe.
How might the strengthening DXY at 100.91 impact BTCUSD's price action this week?
A strengthening DXY, currently at 100.91 and showing strong uptrend signals on multiple timeframes, typically exerts downward pressure on risk assets like Bitcoin. This macro headwind could cap any upside potential for BTCUSD and increase the probability of a rejection from current resistance levels, as investors may rotate towards safer dollar-denominated assets.
| Indicator | Value | Signal | Interpretation |
|---|---|---|---|
| RSI (14) | 61.96 | Neutral | Nearing overbought on 1H, but bullish lean. Daily RSI at 42.65. |
| MACD Histogram | -0.33 (1H) | Bearish | Negative momentum on 1H suggests waning power; positive on 4H/1D. |
| Stochastic | K=51.02, D=35.57 (1H) | Bullish | Bullish crossover on 1H. Daily Stochastic shows bearish signal (K=38.41, D=54.93). |
| ADX | 22.14 (1H) | Bullish | Moderate uptrend on 1H. Strong downtrend (35.67) on Daily. |
| Bollinger Bands | Above Mid (1H) | Watch | 1H above middle band, Daily below middle band indicates mixed signals. |
Track markets in real-time
AI-powered analysis, technical indicators and real-time price data.
Join Our Telegram Channel
Breaking market news, AI analysis and trading signals instantly.
Join Channel