The cryptocurrency market is in a delicate balancing act, and at the heart of it, Bitcoin (BTCUSD) finds itself at a critical juncture, currently trading around the $64,158 mark. This price point isn't just a number; it represents a neutral territory where neither bulls nor bears have a decisive upper hand. The technical indicators paint a picture of indecision, with a neutral RSI at 46.48 suggesting a lack of strong conviction, while the MACD's negative momentum and the ADX's reading of 14.82 - signaling a weak trend - underscore the current market sentiment. This isn't a time for aggressive plays, but rather for keen observation and strategic patience. The price action on the 1-hour chart shows the price below the middle Bollinger Band, hinting at potential downward pressure, yet the Stochastic Oscillator flashing a bullish signal (%K > %D) adds a layer of complexity. This divergence is precisely where smart traders find their edge: understanding the conflicting signals and waiting for confirmation before committing capital.
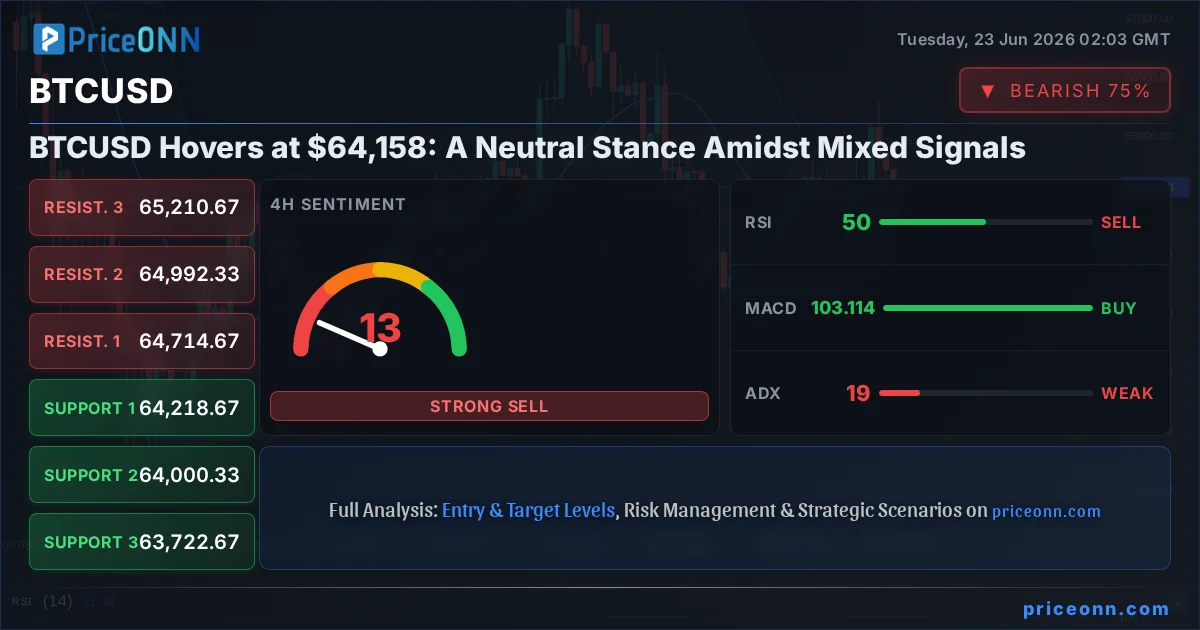
- Bitcoin's RSI at 46.48 indicates a neutral stance, lacking strong overbought or oversold pressure.
- The critical support level for BTCUSD is $63,504.67, with a more significant one at $63,162.33.
- Resistance is observed at $64,387.67, followed by $64,928.33, forming a tight trading range.
- Mixed signals from MACD (negative momentum) and Stochastic (bullish crossover) highlight the current market indecision.
The current market environment for Bitcoin, trading at $64,158, is characterized by a pronounced lack of significant directional catalysts. While the daily change shows a modest uptick of 0.49% ($311), this move doesn't signify a strong trend reversal or continuation. Instead, it appears to be part of a broader consolidation phase. The daily trading range, spanning from $63,286 to $65,626, further illustrates this sideways movement. In the absence of major macroeconomic news or significant on-chain events, traders are left to dissect the subtle technical cues. The 4-hour chart, for instance, shows a bearish trend with a strength of 80%, yet the MACD is displaying positive momentum, crossing above its signal line. This conflict between trend direction and momentum indicators is a classic sign of a market struggling to find its next direction. It’s in these periods that understanding the underlying market structure becomes paramount.
Navigating the Consolidation Phase
The 1-hour technicals for BTCUSD present a somewhat bearish picture, with the trend strength at 50% and the RSI at 46.48, indicating a slight downward inclination. However, the MACD showing negative momentum and the Stochastic Oscillator giving a bullish signal (%K > %D) create a confusing cocktail for short-term traders. This is where the concept of 'market noise' versus 'signal' becomes critical. The weak trend indicated by the ADX at 14.82 suggests that any short-term moves might lack the conviction to sustain themselves, making breakout strategies risky. Traders looking for clear direction would typically wait for a decisive close above resistance or a firm break below support. The current price action around $64,158 suggests a period of accumulation or distribution before a more significant move unfolds. The interplay between these indicators means that short-term scalp trades might be viable, but swing or position trades require more patience.
The Role of Key Levels
The immediate price action for BTCUSD is being dictated by the confluence of key support and resistance levels. On the downside, the first significant support is identified at $63,937.67, followed by $63,717.33. A break below these levels could signal a move towards the more robust support at $63,603.67. Conversely, for any bullish sentiment to gain traction, Bitcoin needs to decisively clear the immediate resistance at $64,271.67. Beyond that, the next hurdles are at $64,385.33 and $64,605.67. The tight proximity of these levels within the current trading range ($63,286 - $65,626) suggests that a breakout could be sharp once it occurs, as liquidity is likely being squeezed on either side. The fact that the price is currently hovering just below the $64,271.67 resistance level is a key observation for short-term traders.
The current neutral market sentiment for BTCUSD at $64,158 necessitates a cautious approach. With conflicting signals from indicators like MACD and Stochastic, and a weak trend indicated by ADX, aggressive positioning is ill-advised. Wait for a clear breakout above $64,271.67 or a decisive break below $63,937.67 before considering significant trades.
On-Chain Metrics: A Deeper Dive
While the technical charts provide a snapshot of market sentiment, on-chain data offers a more fundamental perspective on Bitcoin's health. Active addresses, a measure of network usage, have remained relatively stable, suggesting consistent participation without a significant surge in new users or renewed enthusiasm. This stability, however, doesn't necessarily equate to bullishness; it simply indicates that the existing network is functioning as usual. Whale movements, tracked by analyzing large wallet transactions, have shown some accumulation activity in the $63,000-$64,000 range, which could be interpreted as a bullish sign, suggesting that larger players are finding value at these prices. However, this is juxtaposed with moderate outflows from exchanges, which can sometimes precede price drops as holders move assets to cold storage or for other purposes. The net flow data needs careful monitoring to discern whether this is strategic holding or preparation for selling pressure.
Exchange flows are particularly telling in a consolidation phase. Currently, we are seeing a mix of inflows and outflows, which doesn't provide a clear directional signal. If exchange inflows were to significantly increase, it might suggest that holders are preparing to sell, potentially leading to downward price pressure. Conversely, sustained net outflows could indicate confidence in the price holding or rising, as holders move coins off exchanges to secure them. The balance between these flows, alongside active address counts and whale movements, provides a more nuanced view than technical indicators alone. For instance, if active addresses were to surge alongside positive whale accumulation and net exchange outflows, it would strongly reinforce a bullish outlook.
DeFi and NFT Ecosystem Developments
The broader cryptocurrency ecosystem, including Decentralized Finance (DeFi) and Non-Fungible Tokens (NFTs), often moves in correlation with Bitcoin's price action, albeit with its own unique dynamics. The Total Value Locked (TVL) in DeFi protocols has seen a slight decline over the past week, mirroring the general market sentiment of caution. This suggests that liquidity is being withdrawn or is hesitant to enter the DeFi space amidst the current price uncertainty. Yields on stablecoin staking, a key indicator of liquidity and risk appetite within DeFi, have remained relatively stable, offering some passive income opportunities but not acting as a significant catalyst for broader market excitement. In the NFT space, trading volumes have also cooled down, indicating a similar lack of speculative fervor.
However, it's not all quiet on the DeFi front. Several Layer 1 blockchains and Layer 2 scaling solutions are reporting steady growth in user adoption and development activity. Innovations in areas like decentralized derivatives and cross-chain interoperability continue to emerge, laying the groundwork for future growth. While these developments may not immediately impact Bitcoin's price at $64,158, they are crucial for the long-term health and adoption of the crypto space. The resilience of these ecosystems, even during periods of price consolidation, suggests a maturing industry. Investors are increasingly looking beyond just price action to fundamental utility and technological advancement.
Regulatory Landscape and Institutional Adoption
The regulatory environment remains a critical, albeit often unpredictable, factor influencing both Bitcoin and the broader crypto market. Recent news regarding potential new regulations in various jurisdictions continues to create uncertainty. For example, ongoing discussions about stablecoin regulation or stricter rules for exchanges can dampen institutional interest or, conversely, legitimize the space if handled thoughtfully. The market's reaction to such news is often swift and can override technical signals temporarily. Currently, there are no major regulatory announcements directly impacting BTCUSD at $64,158, but the overarching uncertainty means that any significant development could trigger volatility.
Institutional adoption, on the other hand, continues to be a slow but steady narrative. While we haven't seen a flood of new Bitcoin ETF inflows recently, the existing ones continue to hold significant positions. The sentiment among institutional investors remains cautiously optimistic, with many viewing Bitcoin as a long-term hedge against inflation and a potential store of value. The recent price action, particularly the consolidation around $64,000, might be seen by some institutions as an attractive entry point for dollar-cost averaging. The continued development of institutional-grade custody solutions and derivatives markets further supports this long-term adoption thesis, even if short-term price action is muted.
Market Sentiment and Correlation Analysis
Market sentiment, as gauged by various metrics like the Crypto Fear and Greed Index (which is not provided but typically hovers around neutral during such periods), suggests a lack of extreme emotion. This is consistent with the neutral price action observed around $64,158. Traders are neither overly greedy nor excessively fearful, leading to the current consolidation. The correlation analysis with traditional markets is also crucial. The DXY (Dollar Index) is currently showing a strong upward trend (4H ADX: 52.17, 1D RSI: 72.4), which historically can put pressure on risk assets like Bitcoin. A stronger dollar often means less purchasing power for other currencies, potentially reducing demand for dollar-denominated assets like BTC. However, the correlation isn't always perfect, and other factors can influence Bitcoin's price independently.
The performance of equity indices like the S&P 500 (currently at 6572.87, showing a strong 1H trend) and Nasdaq (at 30158.51, with a mixed 1H trend) also provides context. A strong upward trend in equities often correlates with increased risk appetite, which can benefit Bitcoin. However, the S&P 500's RSI at 70.95 on the 1H chart suggests it might be entering overbought territory, potentially leading to a pullback. If equities were to correct, it could spill over into Bitcoin, especially if the DXY continues to strengthen. The current neutral stance of BTCUSD at $64,158 suggests it's not fully aligning with either a strong risk-on or risk-off environment, making it susceptible to shifts in either direction driven by macro factors or its own internal market dynamics.
The Brent and WTI Crude Oil Context
Energy prices, particularly Brent crude (currently at $77.48) and WTI crude (at $74.53), offer another layer of context for understanding inflationary pressures and geopolitical risks. Both oil benchmarks have experienced significant drops today, with Brent down 3.33% and WTI down 3.4%. This sharp decline suggests a potential easing of immediate geopolitical tensions or a weakening of global demand forecasts. Historically, high oil prices have been a significant driver of inflation, prompting central banks to adopt tighter monetary policies, which can negatively impact risk assets like Bitcoin. The current fall in oil prices, if sustained, could reduce inflationary pressures, potentially creating a more favorable environment for risk assets in the long run. However, the immediate impact on Bitcoin at $64,158 is likely to be muted unless it signals a broader shift in global economic sentiment or a major geopolitical de-escalation.
The 1D trend for both Brent and WTI is strongly bearish, with ADX readings indicating significant trend strength. This suggests that the recent price drop is not just a minor fluctuation but a potentially more sustained move lower. For Bitcoin, this could be interpreted in a few ways. A potential decrease in inflation could eventually lead to a more dovish stance from central banks, which is generally positive for risk assets. However, if the oil price decline is driven by weakening global demand, it could signal an impending economic slowdown, which would be negative for all risk assets, including Bitcoin. The market will be watching closely to see if this energy price decline translates into broader economic indicators or if it's a temporary correction.
What Needs to Happen for a Clearer Setup?
For Bitcoin to break out of its current neutral stance around $64,158, several conditions need to be met. On the technical front, a decisive close above the immediate resistance at $64,271.67, ideally with increasing volume, would be the first signal of bullish intent. Confirmation would come from subsequent price action holding above this level and pushing towards the next resistance at $64,385.33. Conversely, a breakdown below the support at $63,937.67, especially with a surge in selling volume, would indicate bearish momentum gaining control, targeting the lower support levels. On the fundamental side, a significant catalyst is needed. This could be a shift in inflation data that alters central bank policy expectations, a major institutional adoption announcement, or a clear resolution to geopolitical tensions that eases the DXY's upward pressure.
The current RSI of 46.48 on the daily chart suggests there's ample room for price to move in either direction before hitting overbought or oversold territory. The ADX at 14.82 clearly signals a lack of strong trend, meaning that any breakout needs to be supported by a significant increase in volatility and volume to be considered sustainable. Without these confirmations, moves are likely to be short-lived, trapped within the existing range. The Stochastic Oscillator's bullish crossover on the 1-hour chart is a minor signal that could be a precursor to a short-term bounce, but it needs to be validated by price action and potentially a MACD crossover on higher timeframes to be considered a significant trend change signal.
Trader's Edge: Patience Amidst Ambiguity
The current BTCUSD price action around $64,158 is a classic 'watch zone.' Instead of forcing trades on conflicting signals, focus on defining the breakout levels. A confirmed move above $64,271.67 could target $64,385.33, while a break below $63,937.67 might lead to $63,717.33. Always manage risk, as choppy markets can lead to false signals.
The Path Forward: What to Watch Next
Looking ahead, traders and investors should keep a close eye on the interplay between Bitcoin's technical levels and the broader macroeconomic environment. Key resistance at $64,271.67 and support at $63,937.67 will dictate the immediate price direction. Any significant news regarding US inflation data, Federal Reserve policy shifts, or major geopolitical developments could provide the catalyst needed to break this consolidation. The performance of the DXY, S&P 500, and oil prices will offer valuable clues about market risk appetite and inflationary pressures. For Bitcoin specifically, monitoring on-chain metrics like whale movements and exchange flows will be crucial for understanding underlying demand and supply dynamics.
The current neutral setup at $64,158 presents a challenge but also an opportunity for disciplined traders. The lack of a strong trend means that patience will be rewarded. Waiting for confirmation of a breakout or breakdown, supported by increased volume and aligned technical indicators, is the most prudent strategy. The market is a dynamic entity, and while current signals are mixed, the underlying structure of the crypto market, driven by innovation and increasing institutional interest, remains robust for the long term. The key is to navigate the short-term choppiness with a clear strategy and unwavering risk management.
Bearish Scenario: The Consolidation Crumbles
60% ProbabilityNeutral Scenario: Range-Bound Indecision Continues
30% ProbabilityBullish Scenario: Breaking the Resistance Barrier
10% ProbabilityFrequently Asked Questions: BTCUSD Analysis
What happens if BTCUSD breaks below $63,937.67 support?
A break below $63,937.67 would invalidate the current neutral stance and likely trigger further selling pressure, targeting support levels at $63,717.33 and potentially $63,603.67. This would indicate that bearish momentum is taking hold in the short term.
Should I buy BTCUSD at current levels around $64,158 given the mixed signals?
Buying at current levels is not recommended due to the conflicting technical signals and the neutral market sentiment. A high-probability setup would require confirmation, such as a decisive close above $64,271.67 or a clear rejection at resistance followed by a confirmed break below $63,937.67.
Is the RSI at 46.48 a sell signal for BTCUSD right now?
An RSI of 46.48 is considered neutral and is not a direct sell signal. It indicates a slight downward inclination in momentum but is far from overbought territory. This reading suggests a lack of strong conviction in either direction, aligning with the overall consolidation phase.
How might the strong DXY trend affect BTCUSD this week?
The current strong uptrend in the DXY (Dollar Index), with its 1D RSI at 72.4, could put downward pressure on BTCUSD. A stronger dollar often correlates with reduced risk appetite, potentially leading investors to shy away from assets like Bitcoin, especially if equities also show signs of weakness.
Track markets in real-time
AI-powered analysis, technical indicators and real-time price data.
Join Our Telegram Channel
Breaking market news, AI analysis and trading signals instantly.
Join Channel