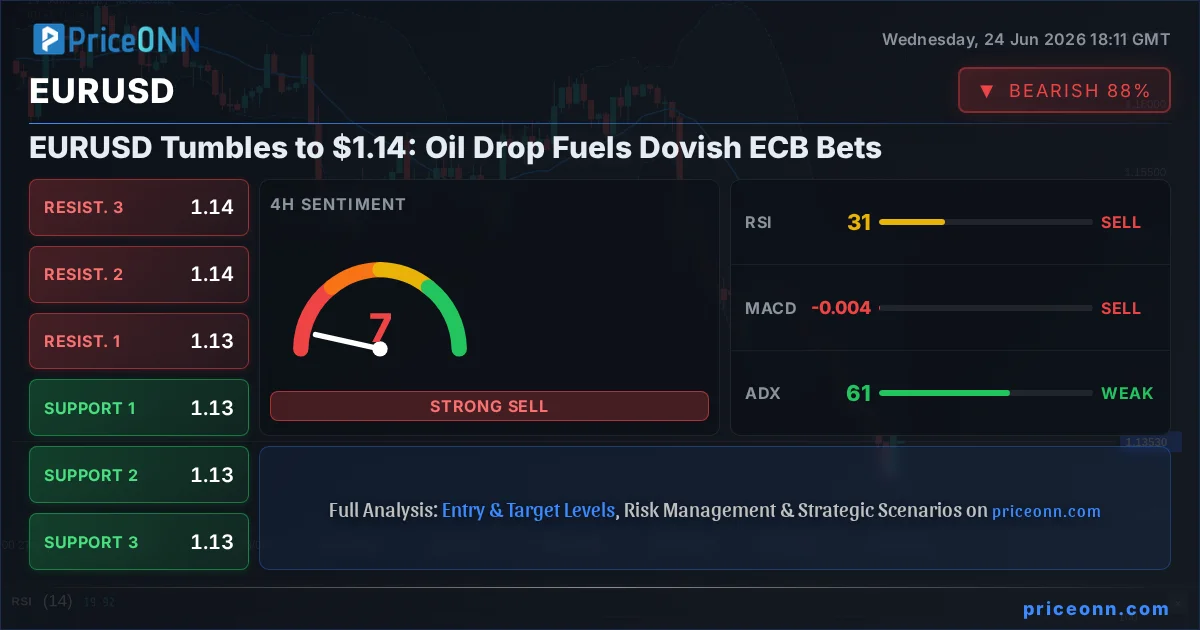
The euro is in freefall, sinking to a fresh one-year low against the dollar at $1.14. This sharp decline isn't happening in a vacuum; it's a direct consequence of the dramatic sell-off in Brent crude, which has plummeted to $73.88. This isn't just a headline event; it's a potent signal that the market is pricing in a more dovish stance from the European Central Bank (ECB), potentially paving the way for further downside in EURUSD. The technical picture across multiple timeframes paints a grim, yet clear, bearish narrative, suggesting that this move could have further legs if key levels fail to hold.
- EURUSD is trading at $1.14, a new one-year low, driven by falling oil prices.
- Brent crude has dropped to $73.88, fueling speculation of impending ECB rate cuts.
- Technical indicators across 1H, 4H, and 1D charts show strong bearish momentum for EURUSD, with RSI in oversold territory.
- The Dollar Index (DXY) is strengthening, currently at 101.66, adding pressure to the single currency.
The narrative driving EURUSD's sharp descent is multi-faceted, but the immediate catalyst is undeniably the aggressive sell-off witnessed in crude oil markets. Brent crude, a bellwether for global energy prices and a significant inflation indicator, has shed a considerable amount of value, currently trading at $73.88. This drop is a double-edged sword for the Eurozone. On one hand, lower energy costs could theoretically ease inflationary pressures, providing some relief to consumers and businesses. However, in the current market environment, the dominant interpretation is that this decline signals weakening global demand, a scenario that casts a long shadow over the economic outlook for Europe, a region heavily reliant on energy imports.
The Domino Effect: From Oil Prices to ECB Policy
This slide in oil prices has immediate and significant implications for the European Central Bank's monetary policy outlook. Inflation has been the primary concern for central bankers globally, and falling energy prices are a key disinflationary force. The market is now rapidly repricing the probability of future ECB rate cuts. With inflation potentially cooling faster than anticipated, the argument for the ECB to maintain its hawkish stance weakens considerably. Traders are now betting that the central bank might be forced to pivot towards easing sooner rather than later to support a fragile economy. This shift in expectations is a powerful driver for the euro, as it suggests a wider interest rate differential favoring the US dollar, especially if the Federal Reserve maintains a more cautious approach.
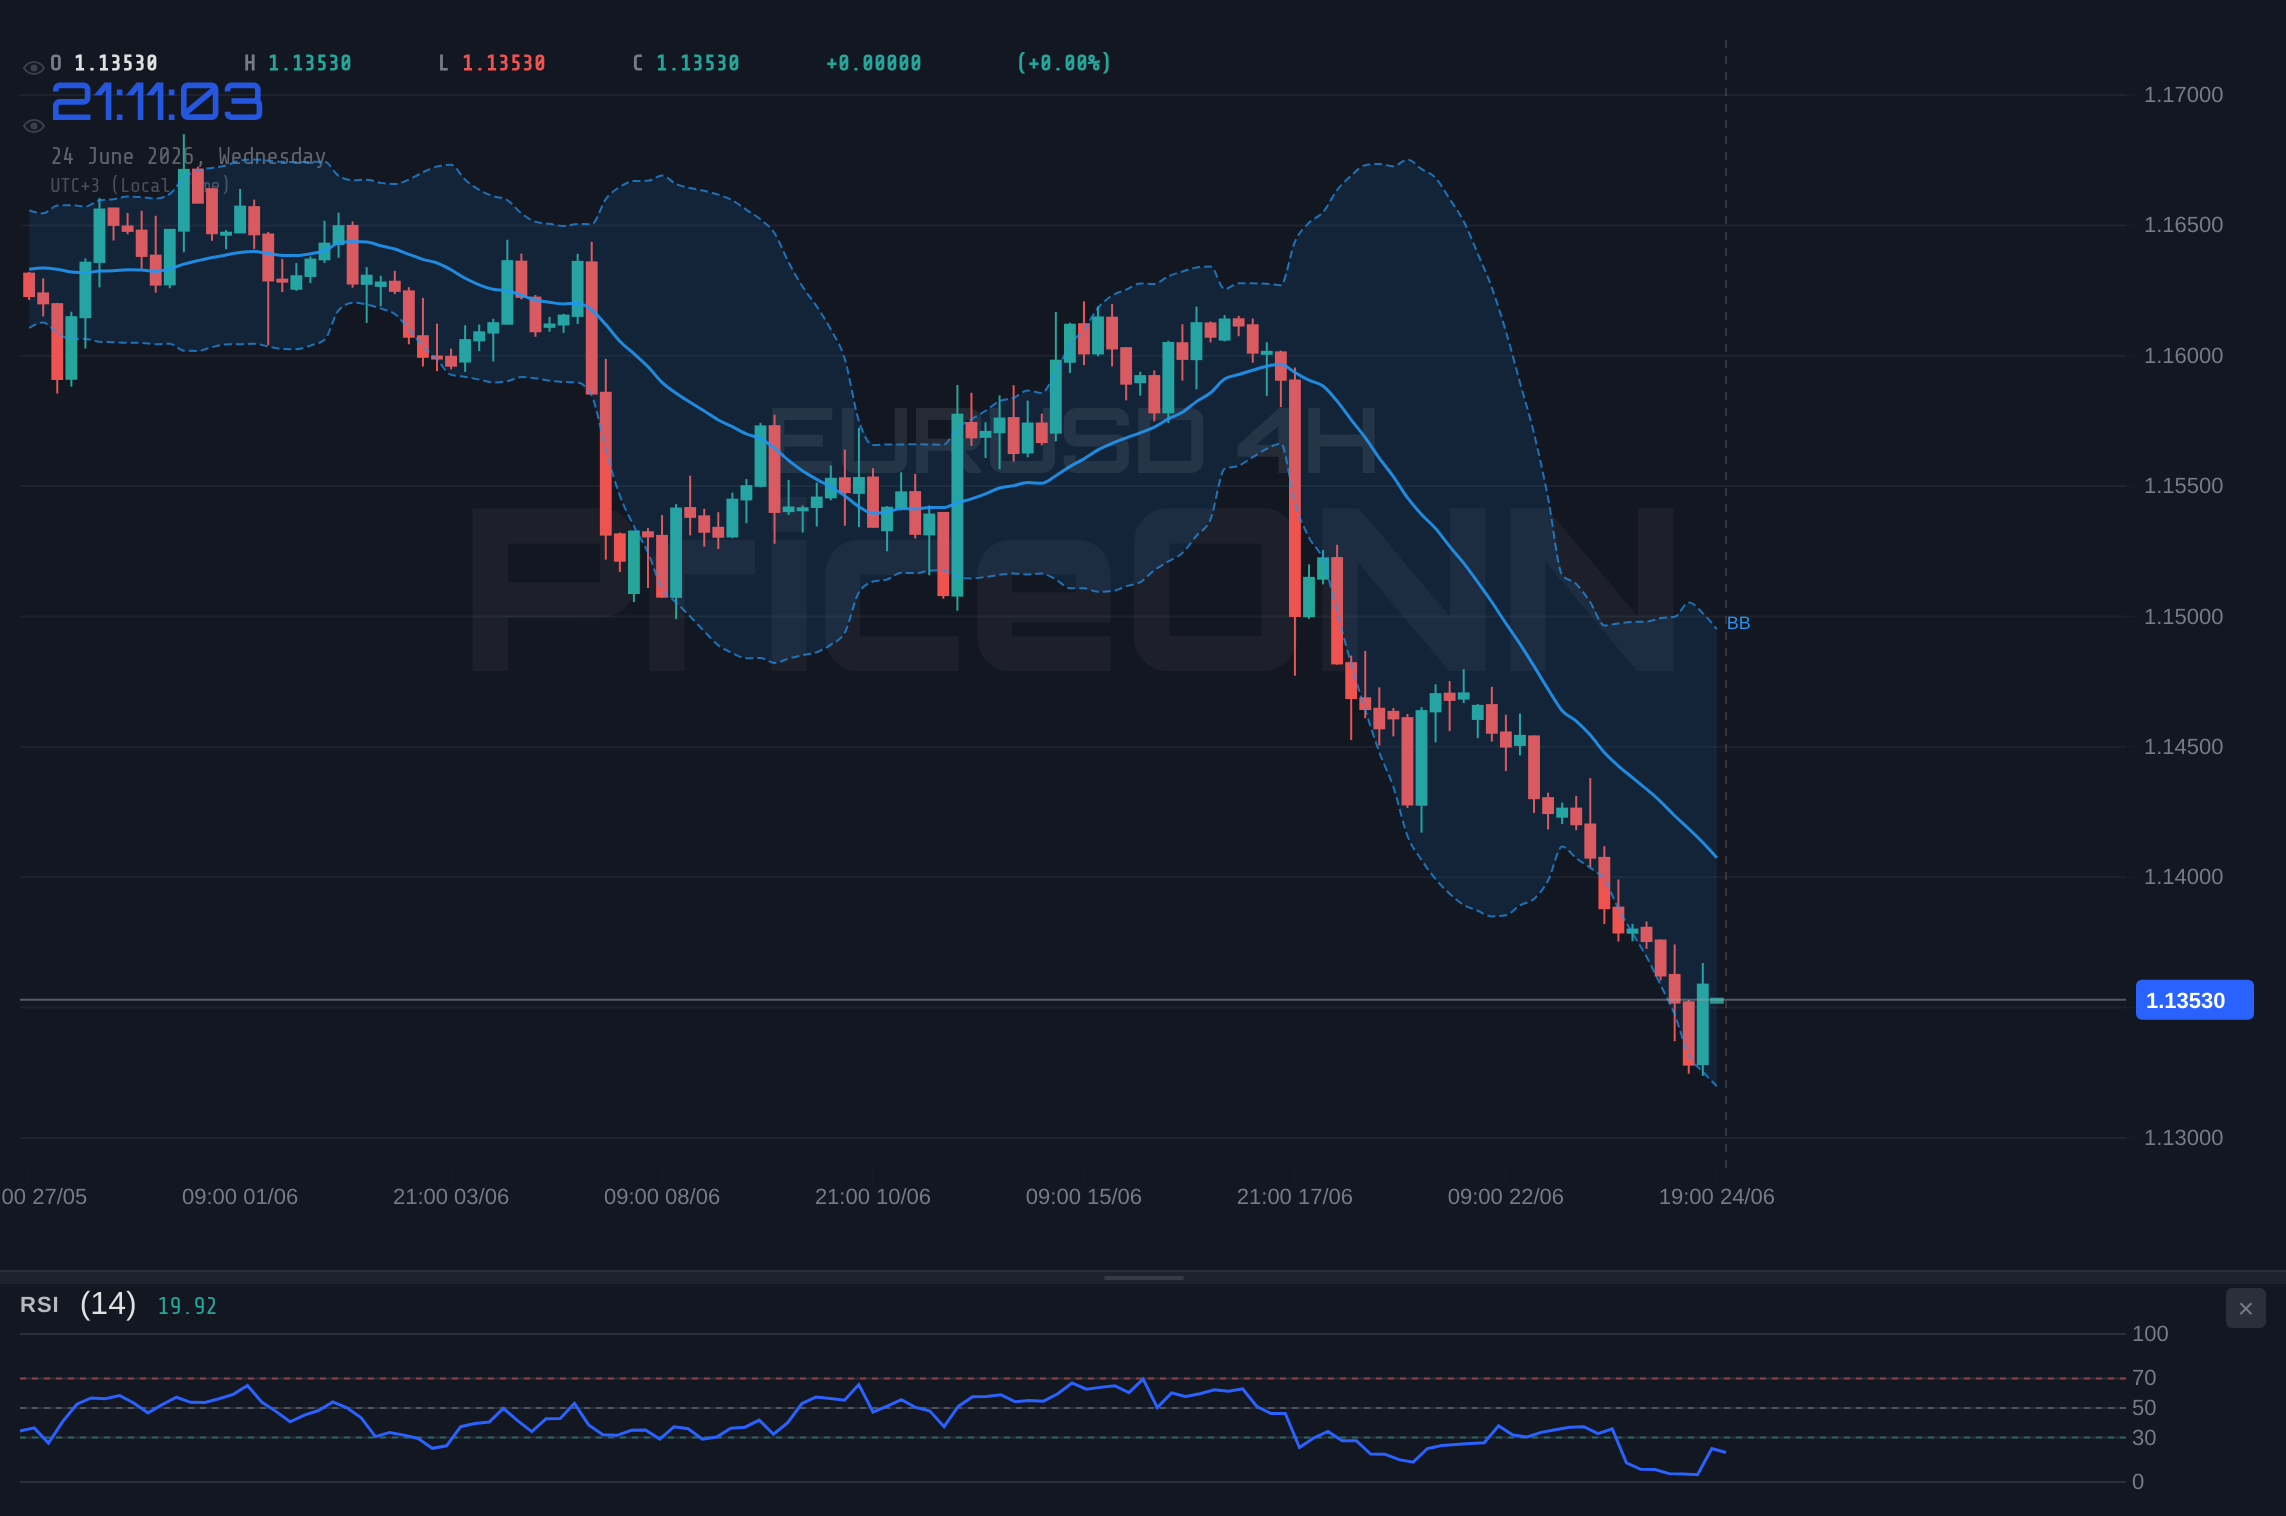
The current price action on EURUSD reflects this growing conviction. The pair has decisively broken below key support levels, with the 1.14 handle now acting as a psychological and technical battleground. On the 1-hour chart, the trend is unequivocally bearish, with an ADX reading of 47.67 indicating strong directional movement. The RSI(14) at 29.08 is deep in oversold territory, suggesting that while the selling pressure is intense, a short-term bounce could be on the cards if buyers step in. However, the MACD remains firmly negative, and Bollinger Bands show the price trading below the lower band, a sign of extreme bearish sentiment or a potential continuation of the downtrend.
Looking at the 4-hour timeframe, the bearish sentiment is even more pronounced. The trend strength remains high at 97%, and the RSI(14) has fallen to 24.88, indicating extreme oversold conditions. This suggests that the current price levels might be attractive for contrarian buyers looking for a short-term reversal, but the overwhelming trend bias is still downwards. The ADX at 44.95 reinforces the strength of the prevailing downtrend. Support levels at 3957.05 and 3926.59 are now in focus, and a break below these could signal a further acceleration of the decline.
Daily Chart: The Bigger Picture of Decline
The daily chart confirms the bearish outlook, painting a picture of sustained weakness. The trend is down with 95% strength, and the RSI(14) is hovering around 29.74, still firmly in oversold territory but showing a slight improvement from the lower timeframes. This suggests that while the selling has been severe, the momentum might be exhausting at these lower levels. However, the MACD continues to print negative momentum, and the price is trading below the lower Bollinger Band. The ADX at 39.67 still points to a strong downtrend. Key daily support levels are now located at 4067.88, 4025.72, and crucially, 3960.64. A decisive break below the 3960.64 level would signal a significant escalation of the bearish trend.
The strengthening US dollar index (DXY) is a critical factor amplifying the weakness in EURUSD. The DXY is currently trading at 101.66, showing a clear upward trajectory. On the 4-hour chart, the DXY exhibits a very strong uptrend with an ADX of 63.81, and its RSI is in overbought territory at 74.6. This suggests that the dollar's strength is robust, and it's likely to continue exerting downward pressure on currency pairs like EURUSD. The correlation is clear: as the dollar gains strength, driven by factors such as risk aversion and potentially different central bank policy paths, the euro struggles to find buyers.
Technical Scenarios for EURUSD
Given the confluence of bearish technical indicators and a strengthening dollar, the market is presenting clear scenarios for traders. The prevailing sentiment is bearish, but the oversold conditions on shorter timeframes warrant a look at potential counter-trend movements or consolidation phases. Understanding these scenarios, their triggers, and invalidation points is crucial for navigating the current volatility.
Bearish Scenario: Downward Momentum Continues
65% ProbabilityNeutral Scenario: Consolidation and Indecision
25% ProbabilityBullish Scenario: Short-Term Rebound
10% ProbabilityThe bearish scenario holds the highest probability, driven by the strong downtrend signals across all major timeframes and the weak economic outlook for the Eurozone implied by falling oil prices. A break below the immediate 1H support at 1.13266 would confirm this path, potentially leading EURUSD towards the 4-hour support at 1.12892. Invalidation for this scenario would occur if the pair manages to reclaim and hold above the 1H resistance at 1.13896, suggesting a temporary pause or reversal in the bearish momentum.
The neutral scenario envisages a period of consolidation, likely as traders digest the recent sharp moves and await further economic data or central bank commentary. This would involve price action oscillating between the immediate 1H support and resistance levels, roughly between 1.13266 and 1.13686. Such a phase could offer limited trading opportunities for range-bound strategies, but it would also signal a lack of conviction from either the bulls or the bears, making it a potentially tricky environment for trend-following strategies.
The bullish scenario, while currently carrying the lowest probability, cannot be entirely dismissed. A short-term rebound is possible, especially given the oversold readings on the 1-hour RSI. For this to gain traction, EURUSD would need to hold the critical 1.13266 support and then decisively break through the 1.13686 resistance. If this occurs, the pair could retest the 1.13783 level and potentially target the daily resistance at 1.14202. However, this scenario is highly dependent on a shift in market sentiment or unexpected positive news for the Eurozone, which seems unlikely given the current oil price action and ECB signals.
The Role of Other Assets: Correlation Analysis
Understanding EURUSD's movement requires looking beyond the pair itself. The strengthening Dollar Index (DXY) at 101.66 is a major headwind. As the DXY pushes higher, it naturally puts downward pressure on EURUSD. The DXY's own technicals on the 4-hour chart show a strong uptrend (ADX 63.81) with RSI in overbought territory (74.6), suggesting its rally might be due for a pause, but the overall trend remains bullish for now. This correlation is a crucial element for any trader analyzing EURUSD.
Meanwhile, major equity indices present a mixed picture that adds to the complexity. The S&P 500 is showing some strength, trading at 6572.87, but its 1-hour chart shows a bearish MACD and oversold Stochastic, hinting at potential short-term weakness. The Nasdaq 100, however, is decidedly bearish, trading at 29152.26, with strong downtrend signals across all timeframes. This divergence in equity markets could suggest a cautious risk appetite, which often favors safe-haven assets like the US dollar, further reinforcing the bearish case for EURUSD.
Gold, a traditional safe-haven, is also experiencing a significant downturn, trading at $3977.31. This is unusual behavior for gold during periods of dollar strength and equity weakness, suggesting that perhaps the market is pricing in a different set of macro factors, or that the selling in gold is driven by technical factors (like strong bearish trends indicated by ADX readings above 40 across timeframes) rather than a broad risk-off sentiment. The sharp drop in gold, alongside the fall in oil, could indicate a deflationary scare or a significant shift in global economic expectations.
Trading Implications and Risk Management
For traders, the current environment on EURUSD screams caution, but also presents opportunities for those who respect the prevailing trend and manage risk effectively. The strong bearish momentum, supported by falling oil prices and a strong dollar, suggests that shorting rallies or playing for breakdowns could be the primary strategy. However, the oversold conditions on shorter timeframes mean that chasing the market lower without clear confirmation could be risky. Waiting for a clear trigger, such as a break of the 1.13266 support level on the 1-hour chart, or a failed attempt to rally back above 1.13686, would provide a more defined entry point.
Risk management is paramount. Given the volatility and the potential for sharp reversals, especially with oversold indicators, setting tight stop-losses is essential. For those looking to fade the move, invalidating the bearish thesis would require a close above 1.13896 on the 1H chart. For trend traders, entry on a confirmed breakdown below 1.13266, with a stop-loss placed just above that level or the 1.13686 resistance, could offer a favorable risk-reward ratio, targeting the lower support levels.
The rapid decline in oil prices and the resulting speculation about ECB policy shifts create a volatile environment. Traders should be aware of potential sharp reversals and ensure strict risk management protocols are in place. Upcoming economic data releases from both the US and Eurozone could provide further catalysts.
The economic calendar is also a crucial factor to monitor. While specific high-impact events were not detailed in the provided data, any significant inflation or employment figures from the Eurozone or the US could dramatically influence EURUSD. A weaker-than-expected inflation report for the Eurozone would further cement the dovish ECB narrative, while strong US employment data could bolster the dollar's strength. Traders should stay vigilant for these data releases, as they could either confirm the current bearish trend or trigger a significant correction.
Frequently Asked Questions: EURUSD Analysis
What happens if EURUSD breaks below the $1.13266 support level?
If EURUSD closes decisively below $1.13266 on the 1-hour chart, it would validate the bearish scenario, likely triggering further selling pressure. The immediate target would then be the $1.12892 level, a support zone identified on the 4-hour timeframe, as the market prices in continued downward momentum.
Should I consider buying EURUSD at current levels around $1.14 given the oversold RSI?
While the RSI is in oversold territory on shorter timeframes, the overall trend remains strongly bearish. A contrarian buy at these levels would be high-risk. A more prudent approach would be to wait for confirmation of a bullish reversal, such as a break above $1.13686, or a clear bounce from a major support level like $1.12892, with a probability estimate of at least 10-15% for such a move.
Is the MACD signal a sell for EURUSD at the current price?
Yes, the MACD indicator is showing negative momentum across all timeframes (1H, 4H, 1D), with the MACD line below the signal line. This consistently indicates bearish pressure and aligns with the overall downtrend, reinforcing the sell signal for EURUSD at current levels around $1.14.
How will the falling oil prices affect EURUSD in the short term?
The sharp fall in Brent crude to $73.88 is a significant bearish catalyst for EURUSD. It increases the likelihood of the ECB adopting a more dovish policy stance due to disinflationary pressures. This is expected to keep EURUSD under pressure in the short term, potentially driving it towards lower support levels as the market prices in a widening interest rate differential favoring the US dollar.
The current technical setup for EURUSD is strongly bearish, amplified by the sharp drop in oil prices and a strengthening dollar. While oversold conditions on shorter timeframes might suggest a temporary pause or minor bounce, the overwhelming evidence points towards further downside potential. Traders should remain focused on the key support levels, particularly the 1.13266 mark on the 1H chart, as a potential trigger for the next leg down. Patience and strict risk management will be key to navigating this volatile market. The market is clearly signaling a path of least resistance downwards, and until key resistance levels are decisively reclaimed, the bears are likely to remain in control.
Technical Outlook Summary
| Indicator | Value | Signal | Interpretation |
|---|---|---|---|
| RSI (14) | 29.08 | Bearish | Deep in oversold territory on 1H, indicating strong selling pressure but potential for a short-term bounce. |
| MACD Histogram | -0.00253 | Bearish | Negative momentum persists across timeframes, confirming the bearish trend. |
| Stochastic | K=25.2, D=26.42 | Bearish | Falling %K below %D confirms downward movement, though nearing oversold zones. |
| ADX | 46.03 | Strong Trend | Indicates a very strong existing downtrend, suggesting continuation is likely. |
| Bollinger | Lower Band Break | Bearish | Price trading below the lower band signals extreme bearish sentiment or a potential continuation. |
Key Levels
Track markets in real-time
AI-powered analysis, technical indicators and real-time price data.
Join Our Telegram Channel
Breaking market news, AI analysis and trading signals instantly.
Join Channel