Is the Nasdaq100 poised for a rebound, or are we looking at further downside from its current perch of $29,176.43? This is the million-dollar question on many traders' minds as the index hovers near critical support levels. Having tracked the Nasdaq100 through the recent market gyrations, it's clear that while the daily trend points south, the 1-hour and 4-hour charts present a more nuanced picture, with conflicting signals demanding close attention. The interplay between the dollar's strength, the tech sector's sentiment, and broader market risk appetite is creating a complex environment. This analysis dives deep into the current technical landscape, exploring the most probable scenarios and the key triggers that could dictate the index's next significant move.
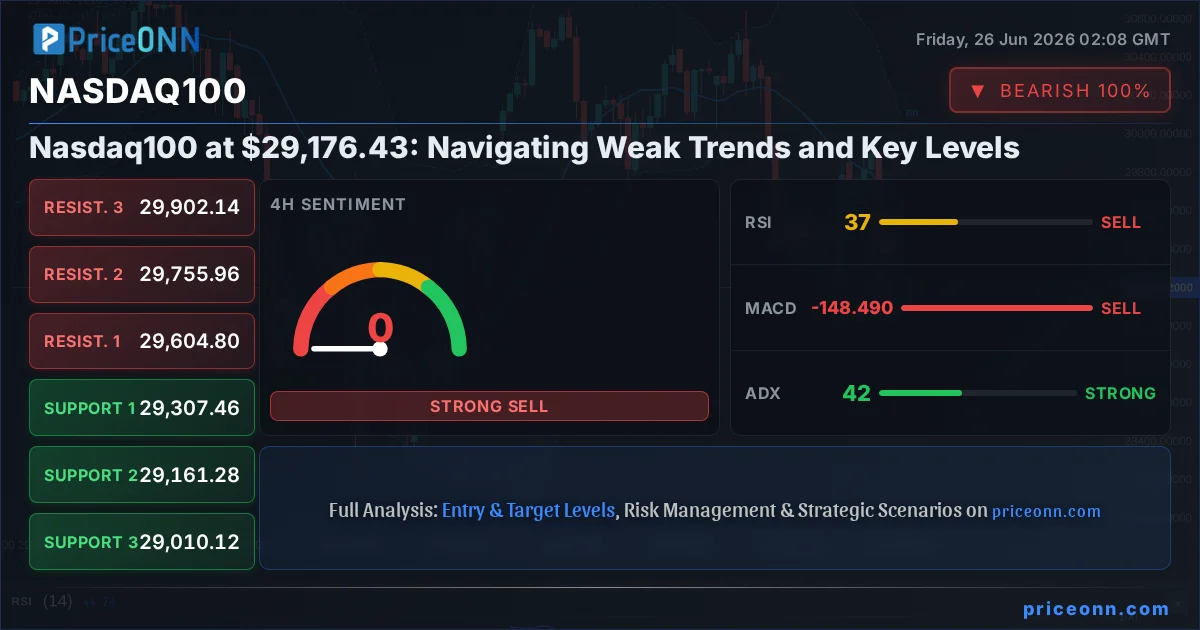
- The Nasdaq100 is currently trading at $29,176.43, testing key support levels.
- RSI at 37.68 on the 1H chart signals a potential shift, while the 1D RSI at 46.77 indicates a neutral-to-bearish bias.
- The Dollar Index (DXY) at 101.56 is showing strength, potentially pressuring risk assets like the Nasdaq100.
- ADX readings suggest a weak trend on the 1H (22.48) but a strong downtrend on the 4H (41.6) and 1D (20.97) charts, highlighting market indecision or a dominant bearish sentiment.
The Battle for $29,176.43: A Technical Crossroads
The Nasdaq100 finds itself at a critical juncture, currently priced at $29,176.43. This level is more than just a number; it represents a confluence of technical factors that have historically dictated market direction. On the daily chart, the trend is decidedly bearish, with the ADX at 20.97 indicating a persistent downward momentum, albeit not at extreme strength. However, the shorter timeframes offer a different narrative. The 1-hour chart shows a neutral trend with an ADX of 22.48, suggesting a lack of strong commitment from either bulls or bears. This divergence between timeframes is precisely where opportunities and risks lie. Traders are weighing the bearish sentiment from the longer-term trend against the potential for a short-term bounce, fueled by oversold conditions on some indicators and the proximity to support.
What I'm watching closely is the interplay between the Nasdaq100's price action and the broader market context. The Dollar Index (DXY) is currently at 101.56, showing a strong uptrend on the 4-hour and daily charts. A strengthening dollar typically acts as a headwind for riskier assets like the Nasdaq100, as it increases the cost of holding non-dollar denominated assets and can signal a flight to safety. This correlation is crucial; if the DXY continues its ascent, it could reinforce the bearish pressure on the Nasdaq100, pushing it towards its lower support levels.
Decoding the Indicators: A Mixed Signal Landscape
Delving into the technical indicators provides a fascinating, albeit complex, picture. On the 1-hour timeframe, the RSI is hovering at 37.68, suggesting some room for upside before hitting overbought territory, and the MACD shows negative momentum, aligning with the bearish bias. However, the Stochastic indicator's K line at 36.12 and D line at 46.75, both below 50 and with K below D, reinforce a bearish signal, indicating potential further downside. The Bollinger Bands are also hugging the lower half, suggesting downward pressure.
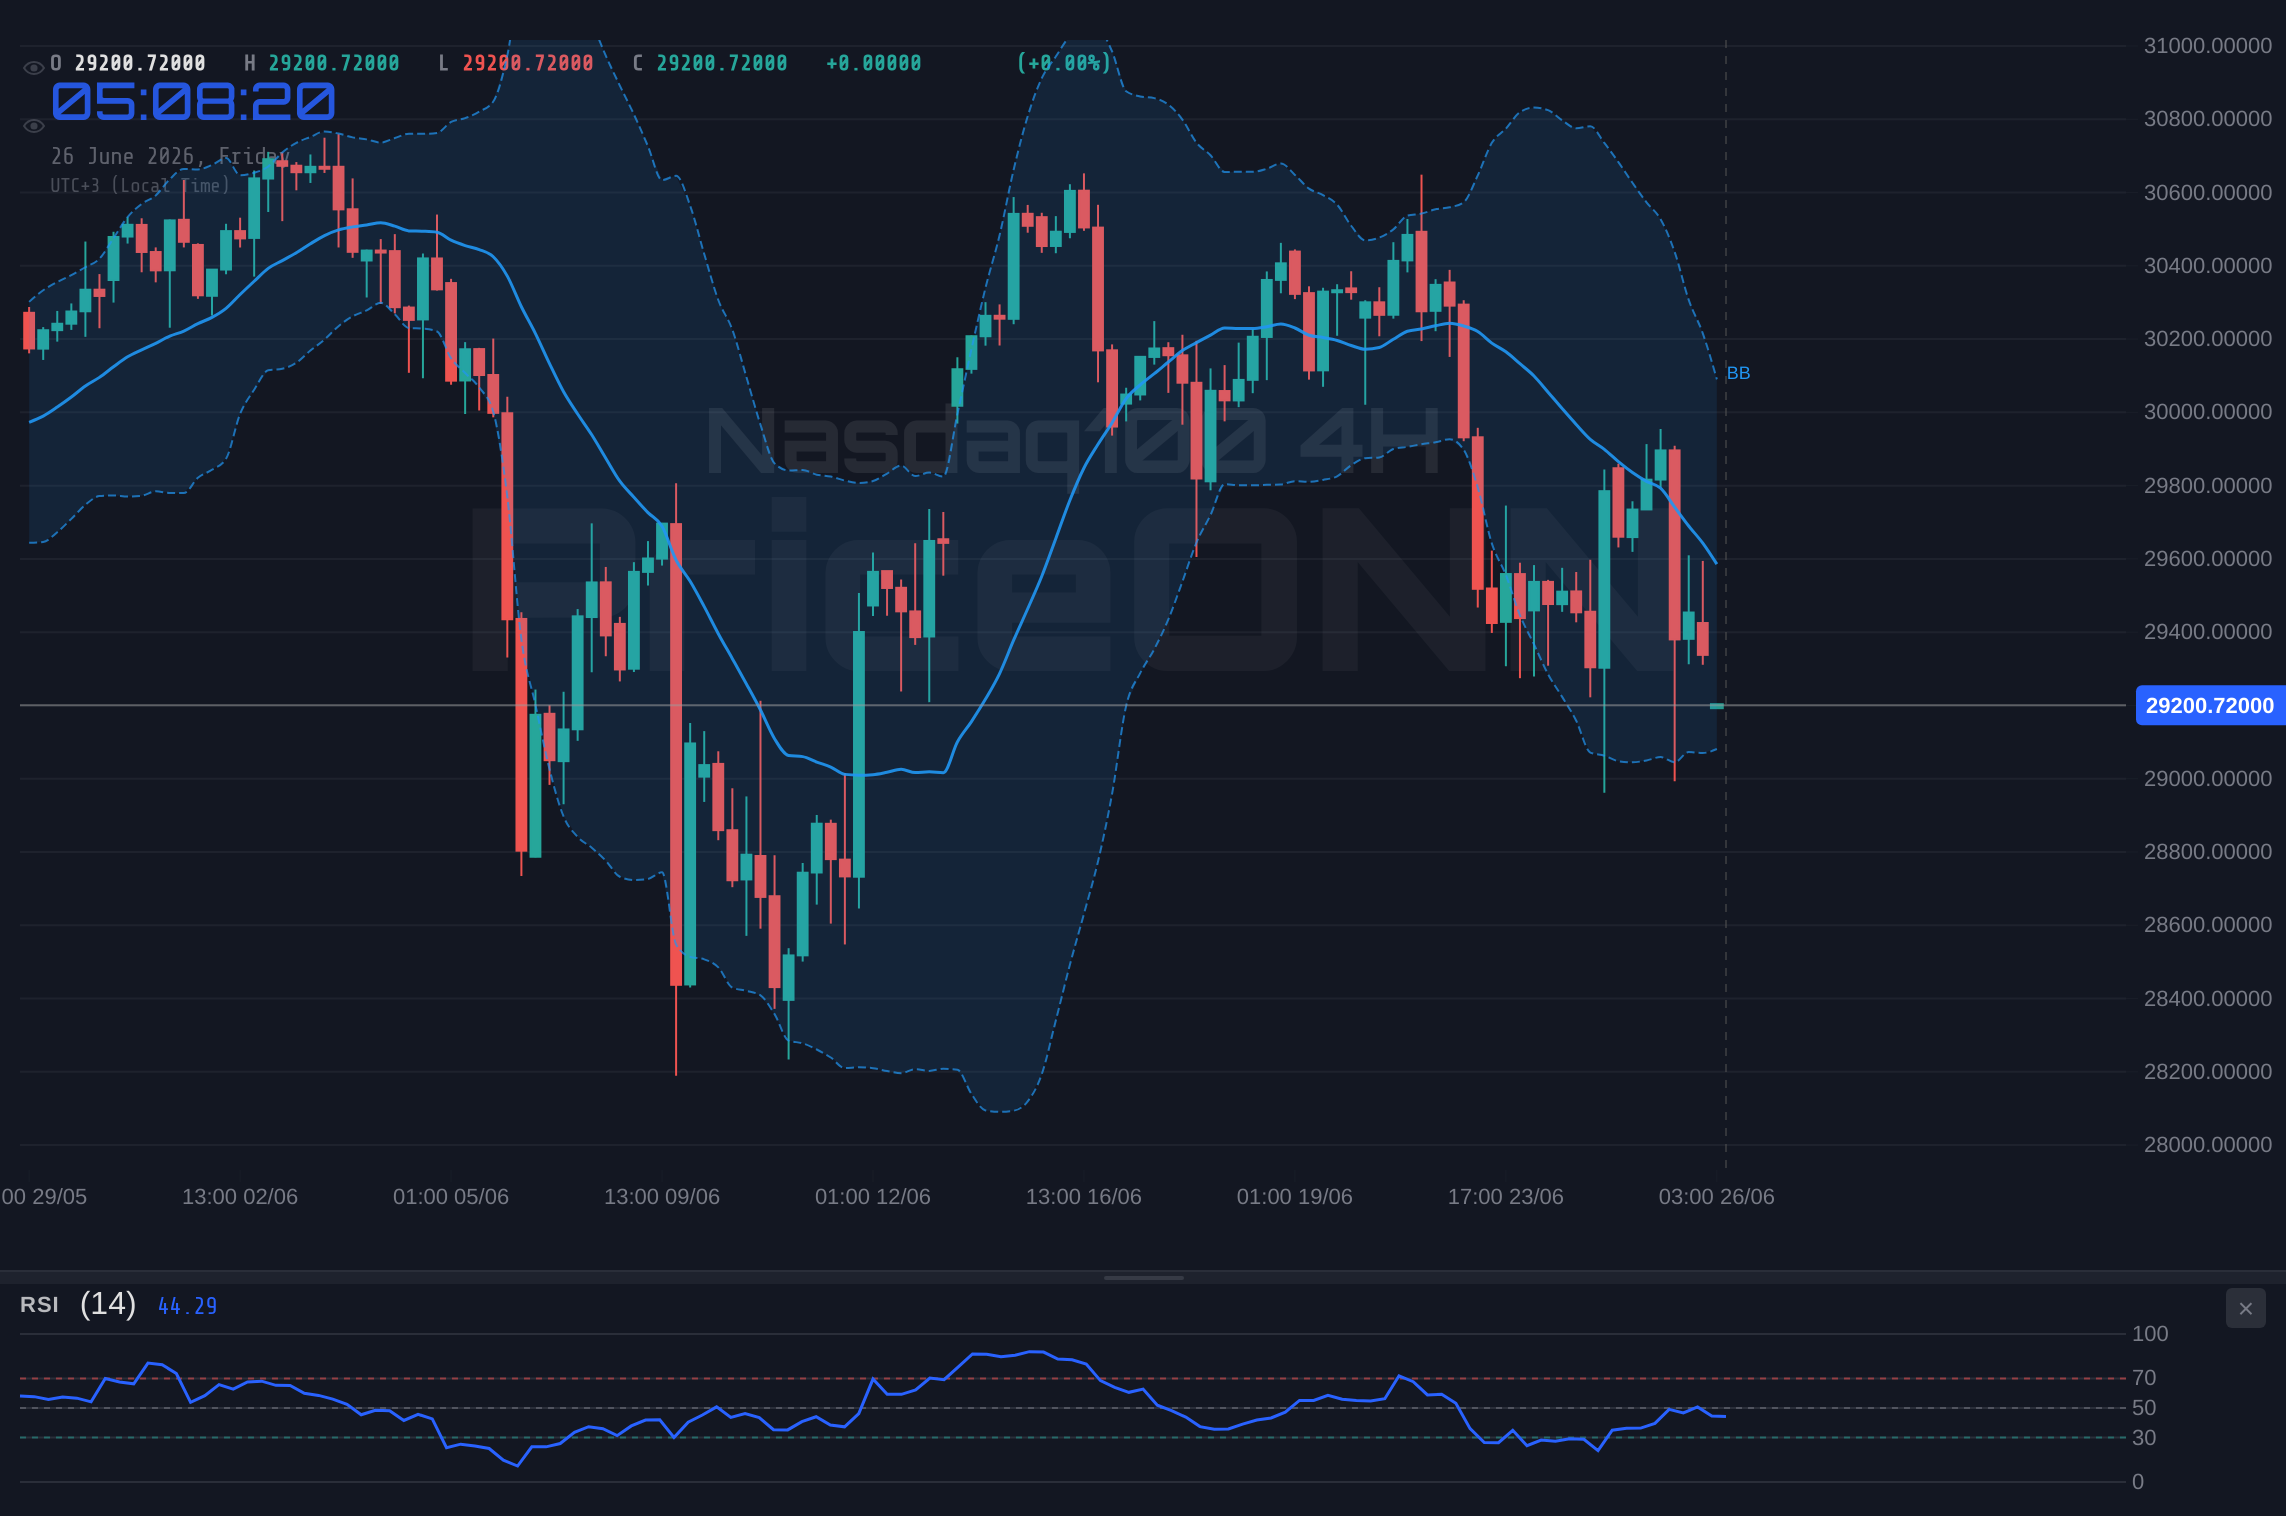
Shift your gaze to the 4-hour chart, and the signals become more contradictory. The RSI sits at 37.04, still in neutral territory but leaning bearish. The MACD remains bearish, but the Stochastic indicator's K line at 37.79 and D line at 72.56, with K significantly below D, screams further downside. Yet, the ADX at 41.6 points to a strong downtrend. This is where the narrative gets tricky: shorter-term indicators might suggest a bounce, but the prevailing trend on this timeframe is undeniably bearish. The 1-day chart continues this theme, with RSI at 46.77, MACD bearish, and Stochastic K at 37.07 and D at 69.82, firmly indicating bearish momentum. The ADX at 20.97 on the daily chart suggests a medium-strength downtrend, confirming the longer-term bearish outlook.
The key takeaway here is that while some shorter-term indicators might hint at oversold conditions or potential bounces, the overall trend and momentum, especially on the higher timeframes, lean bearish. This conflict between short-term signals and long-term trends often leads to choppy, range-bound price action before a decisive move occurs. It’s a market that requires patience and a keen eye for confirmation.
The Bull's Roadmap: Reclaiming $29,000 and Beyond
For the bulls to regain control, a clear break and hold above the current price of $29,176.43 is paramount. The immediate resistance level to watch on the 1-hour chart is $29,281.26. A decisive move above this mark, ideally with increasing volume, would signal the start of a potential short-term recovery. This would need to be followed by a push through the next resistance at $29,433.65. If this bullish momentum can be sustained, the target then shifts to the $29,529.28 resistance zone. A sustained push above $29,586.04 would be a significant victory for the bulls, indicating a potential shift in sentiment and opening the door for a retest of higher levels, perhaps even aiming for the $30,098.98 resistance on the daily chart.
Confirmation of this bullish scenario would come from a combination of factors. Firstly, a sustained break above the 1-hour resistance levels, coupled with a rising RSI (ideally moving back above 50) and MACD showing positive crossover. Secondly, a weakening Dollar Index (DXY) would be a crucial supporting factor. If the DXY starts to retreat from its current 101.56 level, it would alleviate some pressure on risk assets. Lastly, a shift in the broader market sentiment, perhaps signaled by a recovery in WTI crude oil prices (currently at 71.77) or a stabilization in the S&P 500 (at 6572.87), could provide the catalyst needed for a Nasdaq100 rally. The invalidation for this bullish thesis would be a decisive close back below the $29,176.43 current price, especially if it breaks the immediate 1-hour support at $29,128.87.
Where Bears Take Control: The Path to Lower Support
The bearish scenario remains the dominant narrative, given the daily trend and the conflicting signals on higher timeframes. The immediate trigger for the bears would be a failure to hold the current price of $29,176.43. A break below the 1-hour support at $29,128.87 would be the first sign of weakness. If this level gives way, the next target would be the 4-hour support at $29,010.12. A strong move below this level, accompanied by increasing volume and a bearish MACD crossover on the 1-hour chart, would confirm the bearish outlook.
From there, the path opens up towards the significant daily support levels. The first major hurdle would be $28,647.33. If this level fails to hold, we could see a rapid descent towards $28,333.20. The daily chart's support at $27,921.65 (not explicitly listed but implied by the trend) would become the ultimate target in a severe bearish scenario. Confirmation of this downside move would be a sustained bearish trend across all timeframes, a falling RSI (staying below 50), and a strong MACD divergence. A continued rise in the DXY would also bolster this bearish case, while a sell-off in riskier assets like Bitcoin (currently at 59373) and Ethereum (at 1557.96) could indicate a broader risk-off sentiment that would weigh heavily on the Nasdaq100.
The invalidation for this bearish scenario would be a strong reclaim and hold above the $29,176.43 price, followed by a break above the $29,281.26 resistance. If the index manages to consolidate and then break higher from here, the bearish thesis would be nullified, and attention would shift back to the upside targets.
The Waiting Game: Consolidation Around $29,176.43
Given the conflicting signals across different timeframes, a period of consolidation around the current price of $29,176.43 is a distinct possibility. This would occur if neither the bulls nor the bears can gain decisive control. On the 1-hour chart, the ADX at 22.48 suggests a weak trend, which is often a precursor to range-bound action. In such a scenario, the Nasdaq100 might trade between the immediate 1-hour support at $29,128.87 and resistance at $29,281.26. This range could persist as traders await clearer signals from economic data or geopolitical developments.
During consolidation, we might see whipsaws – brief moves that are quickly reversed. The RSI could oscillate around the 50 level, and MACD crossovers might become more frequent but lack follow-through. The key feature of this neutral scenario would be the lack of significant progress towards either the key support or resistance levels mentioned. It's a 'wait-and-see' period where the market digests recent information and builds energy for the next directional move. The longer the consolidation lasts, the more significant the eventual breakout is likely to be. This phase is often characterized by lower trading volumes and a general lack of conviction from market participants.
Bearish Scenario: The Descent Below Support
65% ProbabilityNeutral Scenario: The Consolidation Phase
25% ProbabilityBullish Scenario: A Rebound from Support
10% ProbabilityThe Verdict: Why Bears Might Have the Edge
Based on the current technical data, the bearish scenario appears to hold the most weight, carrying a 65% probability. While shorter timeframes show some oversold conditions and potential for a bounce, the dominant trend on the daily and 4-hour charts, coupled with the strength in the Dollar Index (DXY at 101.56), paints a picture of caution for the Nasdaq100. The ADX on the 4-hour chart at 41.6 strongly indicates a prevailing downtrend, which is difficult to ignore. The RSI on the daily chart at 46.77, while not yet oversold, suggests a lack of bullish conviction. The Stochastic indicator's consistent bearish signals across multiple timeframes further reinforce this view.
The 1-hour chart's neutral trend with an ADX of 22.48 might offer a temporary reprieve, but without a significant shift in macro sentiment or a clear break of immediate resistance, it's more likely to be a pause than a reversal. The key is confirmation. A sustained break below $29,128.87 would be the first domino to fall, opening the door for the targets at $29,010.12 and subsequently $28,647.33. The market sentiment, reflected in the performance of other risk assets like Bitcoin (59373) and Ethereum (1557.96), will also be a critical barometer. If these cryptocurrencies continue to slide, it would further validate the risk-off environment and the bearish outlook for the Nasdaq100.
The neutral scenario, with a 25% probability, remains a possibility if the index becomes range-bound. This would likely occur if upcoming economic data fails to provide a clear directional catalyst or if geopolitical tensions remain subdued. However, the strength of the bearish signals on higher timeframes makes a prolonged consolidation less likely than a continuation of the downtrend.
The bullish scenario, with only a 10% probability, would require a significant catalyst. This could be a surprisingly dovish turn from the Federal Reserve, a sudden easing of geopolitical tensions, or a strong positive surprise in US economic data that sparks a broad risk-on rally. Until such a catalyst emerges, the path of least resistance for the Nasdaq100 appears to be downwards, especially if it fails to hold the critical $29,176.43 level.
What I'm Watching This Week: Key Triggers for Nasdaq100
The upcoming week is crucial for determining the Nasdaq100's next direction. Several key triggers will be on my watchlist:
1. Daily Close Below $29,128.87: This is the immediate 1-hour support. A confirmed close below this level on the daily chart would significantly increase the probability of the bearish scenario playing out, opening the door for further downside towards $29,010.12 and beyond. This would be a strong signal for short-term traders to consider bearish positions.
2. Dollar Index (DXY) Movement: The DXY is currently at 101.56 and showing strong upward momentum on higher timeframes. A continued rally in the DXY, potentially breaking above 101.80, would likely exert further downward pressure on the Nasdaq100. Conversely, a reversal and break below 101.40 could signal a shift towards risk-on and support the Nasdaq100.
3. S&P 500 and Nasdaq Correlation: The Nasdaq100 often moves in tandem with the S&P 500 (6572.87) and Nasdaq (29176.43 itself). Observing whether these indices can hold their ground or break below key support levels will provide valuable insight into overall market sentiment. A broad equity market sell-off would almost certainly drag the Nasdaq100 lower.
The market is currently at a critical juncture. While short-term indicators might offer glimmers of hope for bulls, the overarching bearish trend and macro headwinds suggest caution is warranted. Patience and discipline will be key as we await clearer signals. The price action around $29,176.43 will be the ultimate arbiter of direction in the coming days.
Frequently Asked Questions: Nasdaq100 Analysis
What happens if Nasdaq100 breaks below $29,128.87 support?
A confirmed close below $29,128.87 would invalidate the short-term neutral outlook and strongly signal a bearish continuation. The immediate target would then shift to the 4-hour support at $29,010.12, with further downside potential towards $28,647.33.
Should I consider buying Nasdaq100 at current levels of $29,176.43 given the RSI at 37.68?
Buying at current levels carries significant risk due to the dominant bearish trend on higher timeframes and the strong DXY. While the 1H RSI at 37.68 might suggest oversold conditions, confirmation from a break above immediate resistance at $29,281.26 and a weakening DXY would be needed for a higher-probability bullish trade.
Is the RSI at 46.77 a sell signal for Nasdaq100 on the daily chart right now?
An RSI of 46.77 on the daily chart is not a direct sell signal but indicates a lack of bullish momentum and leans towards a bearish bias. It suggests that while not yet oversold, the market is favoring sellers, aligning with the overall downtrend and bearish MACD signals.
How will the DXY strength at 101.56 affect Nasdaq100 this week?
The strong upward trend in the Dollar Index (DXY) at 101.56 generally exerts downward pressure on risk assets like the Nasdaq100. If the DXY continues to rally, it could exacerbate the bearish sentiment and push the Nasdaq100 towards its support levels, especially if key economic data supports a stronger dollar.
Technical Outlook Summary
| Indicator | Value | Signal | Interpretation |
|---|---|---|---|
| RSI (14) | 46.77 | Bearish | Daily RSI below 50, indicating bearish momentum. |
| MACD Histogram | -245.67 | Bearish | Negative histogram on daily chart points to weakening upside momentum. |
| Stochastic | 37.07 / 69.82 | Bearish | K line below D line, reinforcing bearish signals. |
| ADX | 20.97 | Neutral | Medium strength trend on daily chart, suggesting a confirmed downtrend is forming but not yet extreme. |
| Bollinger Bands | Middle Band | Below | Price is trading below the middle band, indicating bearish pressure. |
Key Levels
Support Levels
Resistance Levels
Track markets in real-time
AI-powered analysis, technical indicators and real-time price data.
Join Our Telegram Channel
Breaking market news, AI analysis and trading signals instantly.
Join Channel