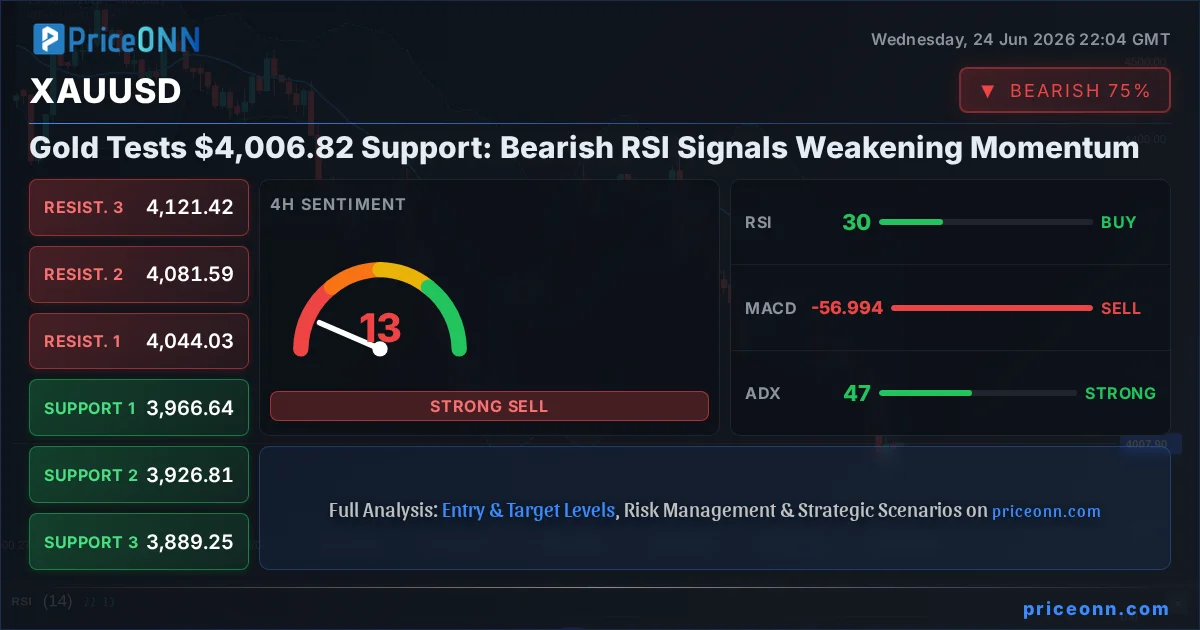
The financial markets are currently witnessing a significant downturn in gold prices, with XAUUSD trading at $4,006.82. This sharp decline, marking a 2.51% drop today, is occurring against a backdrop of a strengthening US Dollar Index (DXY) and a palpable shift towards risk aversion across global markets. The technical indicators, particularly the Relative Strength Index (RSI), are flashing warning signs, suggesting that the bearish momentum could persist in the short to medium term. This analysis delves into the interconnectedness of these market forces, exploring how geopolitical tensions, central bank policies, and broader economic sentiment are converging to pressure the precious metal.
- XAUUSD is currently trading at $4,006.82, down 2.51% today, with a 1H RSI reading of 39.53 indicating bearish pressure.
- Critical support for XAUUSD is identified at $3,977.34 on the 1-hour chart, while resistance looms at $4,011.64.
- The US Dollar Index (DXY) is strengthening, currently at 101.62, which typically correlates with downward pressure on gold.
- A broader risk-off sentiment is evident, with major indices like SP500 showing pullbacks, further supporting safe-haven assets like the dollar over gold.
The current market environment presents a complex picture for gold traders. The dramatic fall from recent highs, pushing XAUUSD below the crucial $4,000 psychological level, is not an isolated event but rather a symptom of broader macroeconomic and geopolitical shifts. The DXY, currently at 101.62 and showing a strong upward trend with 49.5 ADX on the 1H chart, is a significant headwind for gold. Historically, a stronger dollar makes gold more expensive for holders of other currencies, thus dampening demand. This inverse correlation is a fundamental driver to watch, especially as the dollar index itself shows robust upward momentum, indicating a potential continuation of this trend. Investors are increasingly seeking the perceived safety of the US dollar amidst global uncertainties, which directly impacts gold's appeal as a safe-haven asset.
Macroeconomic Currents Shaping Gold's Trajectory
The prevailing narrative in financial markets is one of heightened caution and a flight to safety. This risk-off sentiment is significantly influencing gold's price action. Major equity indices such as the SP500, currently trading at 6572.87, have experienced pullbacks, with the 1D chart showing a 100% bearish trend. Similarly, the Nasdaq100, despite a recent uptick to 29842.65, shows underlying weakness on longer timeframes. When equity markets falter, investors often reallocate capital from riskier assets to perceived safe havens. While gold is typically considered a primary safe haven, the current dynamic sees the US dollar outperforming this role, partly due to higher interest rate expectations and its status as the world's reserve currency. The interplay between risk appetite, dollar strength, and gold's safe-haven status is crucial for understanding the current price action. The recent news highlighting the euro hitting yearly lows as oil prices drop and ECB rate cut bets fuel further underscores this global deleveraging trend, indirectly benefiting the dollar and pressuring gold.
Central bank policies also play a pivotal role in this intricate market. While specific central bank announcements are not detailed in the provided data, the general trend of monetary policy tightening by major central banks, particularly the Federal Reserve, has been a significant factor supporting the dollar. Higher interest rates in the US increase the attractiveness of dollar-denominated assets, including US Treasuries, and consequently, the dollar itself. This makes holding non-yielding assets like gold less attractive. The market is constantly pricing in future policy moves, and any hint of a more hawkish stance from the Fed, or a more dovish tone from other major central banks like the ECB, can trigger significant currency and commodity price movements. The current strength of the DXY suggests that market participants are anticipating a continued hawkish bias or at least a sustained higher-for-longer interest rate environment, which is a bearish cocktail for gold.
Technical Breakdown: What the Charts Are Saying
Delving into the technical indicators for XAUUSD reveals a predominantly bearish short-to-medium term outlook, despite some conflicting signals on shorter timeframes. On the 1-hour chart, the RSI stands at 39.53, firmly in neutral territory but leaning towards weakness, and the MACD is showing negative momentum with the MACD line below its signal line. The ADX at 49.5 on this timeframe indicates a strong trend, and currently, that trend is downwards. Bollinger Bands are also trading below the middle band, reinforcing the bearish sentiment. However, the Stochastic oscillator on the 1H chart shows K=34.27 and D=28.22, suggesting a potential upward signal as %K crosses above %D – a sign of potential short-term buying pressure emerging from oversold conditions. The overall signal for the 1H chart is a 'SELL' (1 Buy, 7 Sell, 0 Neutral), highlighting the prevailing bearish sentiment.
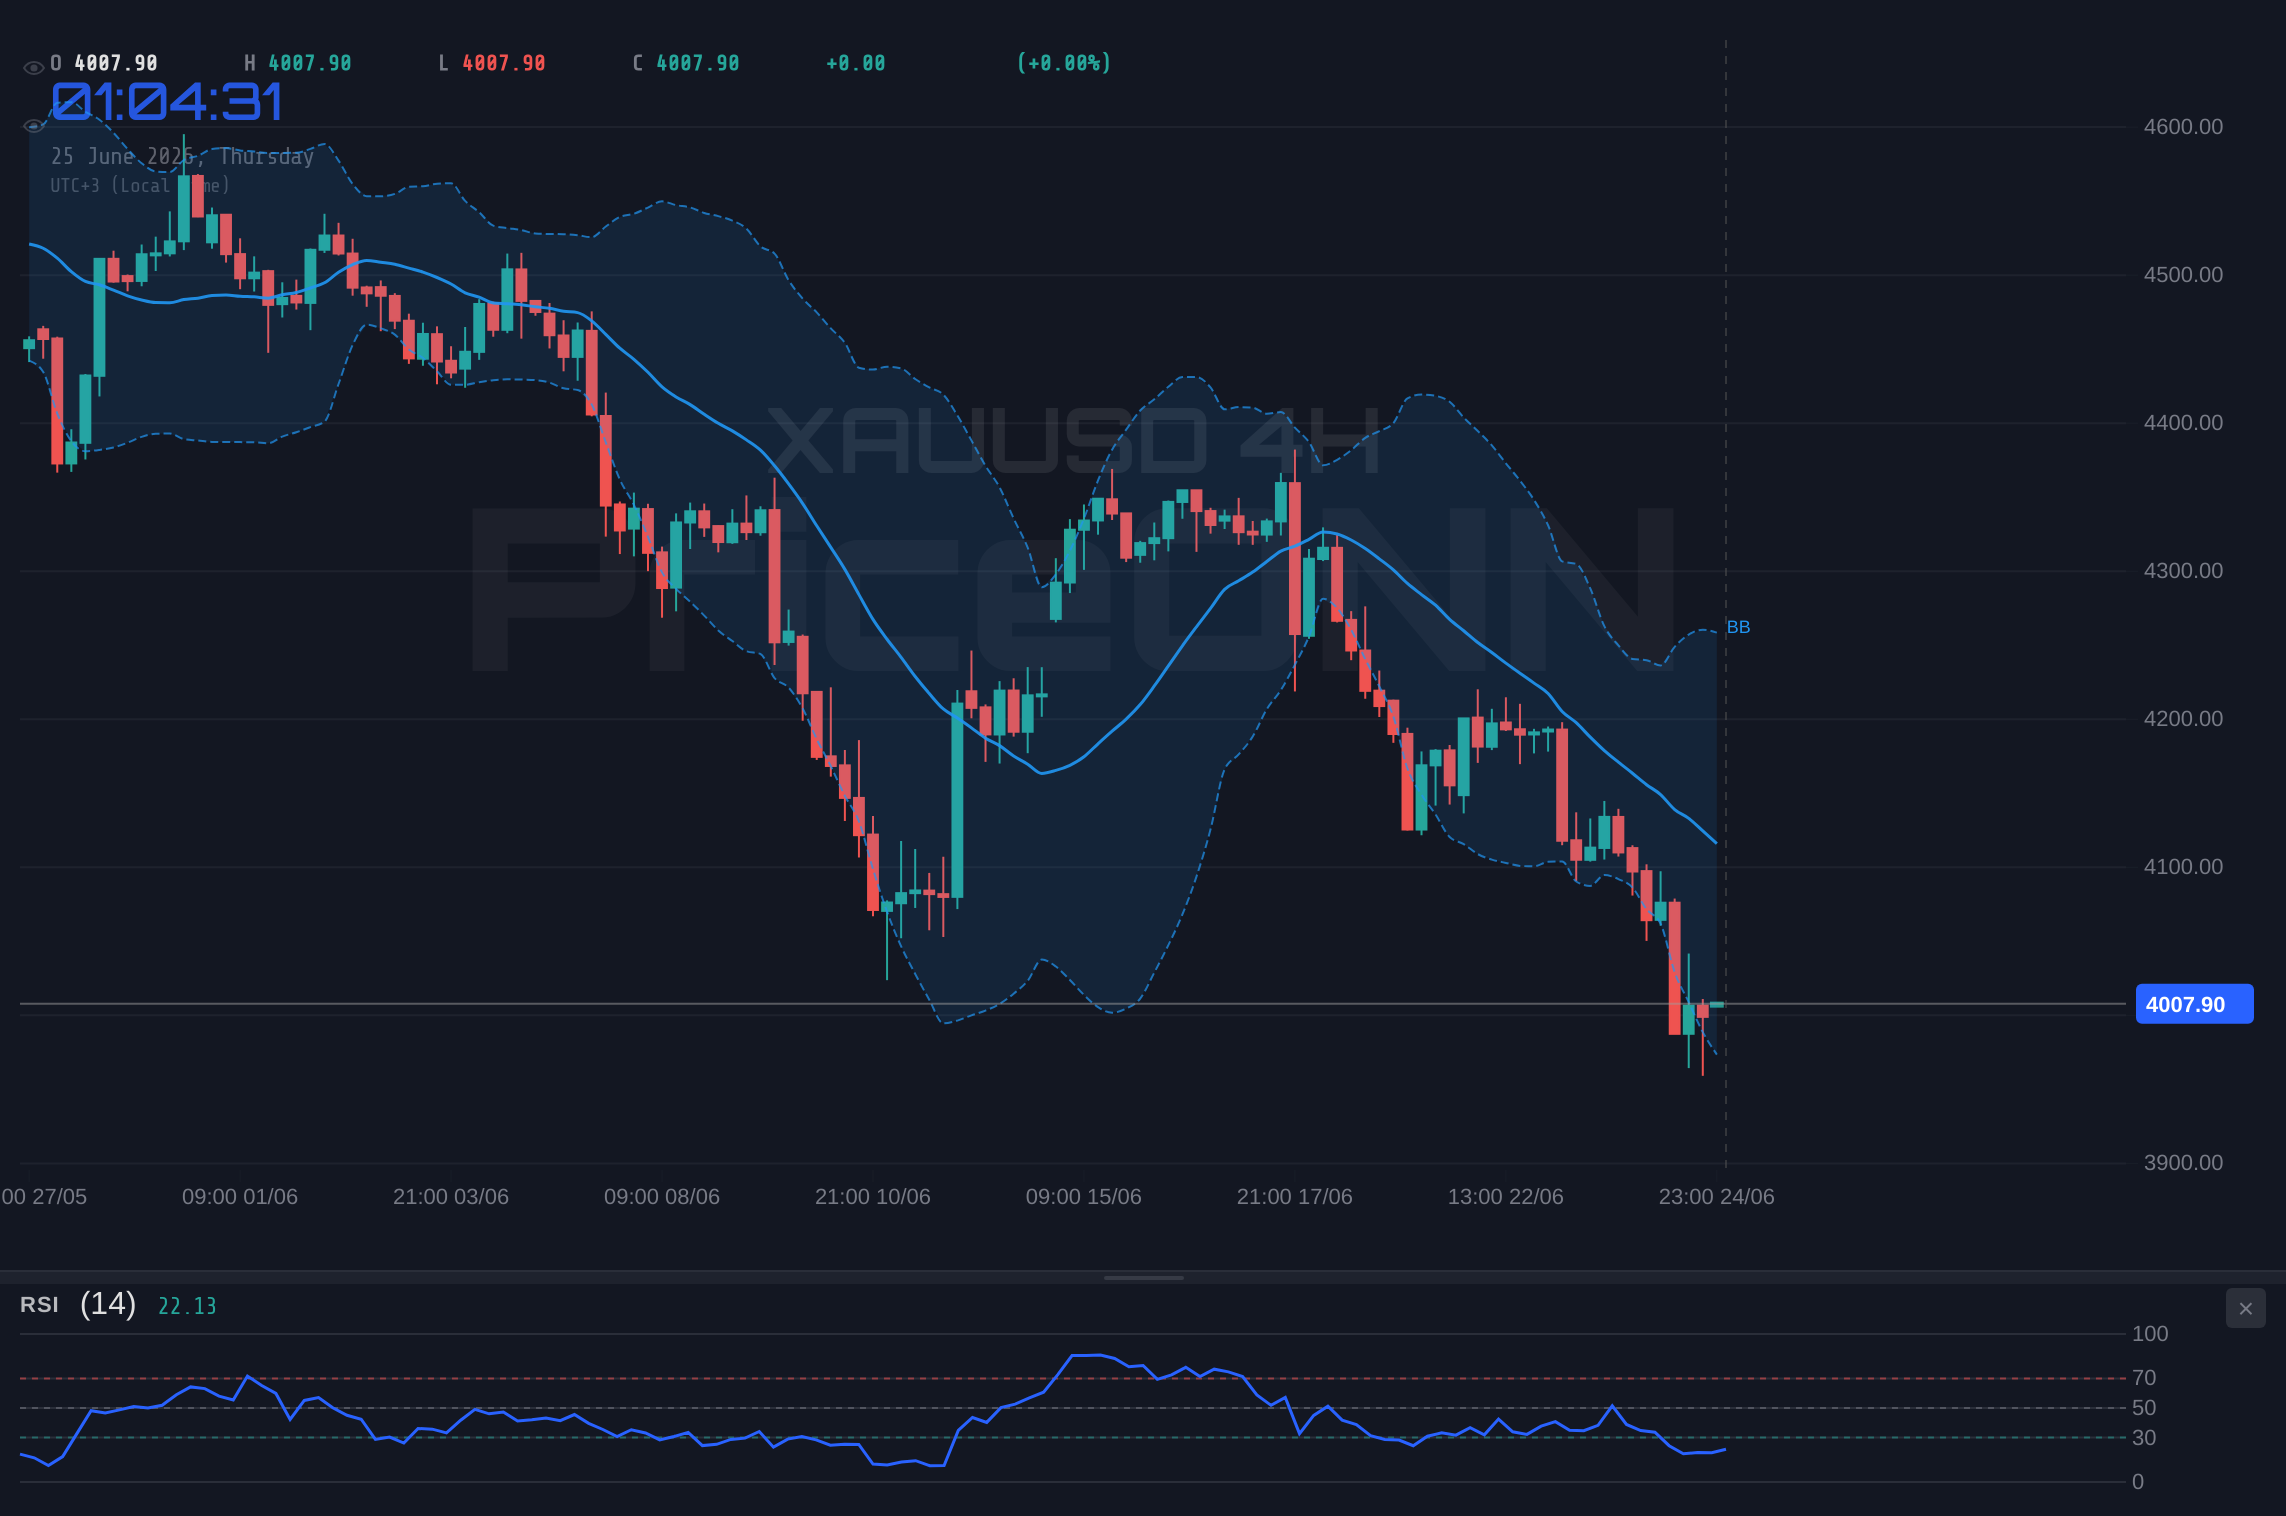
The 4-hour timeframe offers a more conclusive bearish picture, with a trend strength of 98% in favor of the downside. The RSI at 29.57 is deep in oversold territory, traditionally a signal for potential reversals, but within a strong downtrend, this can persist for some time. The MACD remains negative, and Bollinger Bands are situated below the middle band, consistent with a bearish trend. The Stochastic oscillator on the 4H chart (K=16.34, D=14.26) also indicates oversold conditions, with %K above %D, hinting at a possible short-term bounce. However, the ADX at 46.83 confirms a strong downtrend. The 4H general signal is a strong 'SELL' (2 Buy, 6 Sell, 0 Neutral), underscoring the dominant bearish force. The key support levels to watch on this timeframe are 3966.64, followed by 3926.81 and 3889.25, while resistance is seen at 4044.03, 4081.59, and 4121.42.
The daily chart paints a similar, albeit slightly less aggressive, bearish picture. The trend is still down with 95% strength. The RSI at 30.73 is nearing oversold territory, suggesting that the market might be approaching a point where significant selling pressure could wane, but it is not yet a clear buy signal. The MACD continues to show negative momentum, and Bollinger Bands are below the middle band. The Stochastic on the daily chart (K=27.35, D=44.51) provides a bearish signal, with %K below %D. The ADX at 39.68 still indicates a strong trend. The general signal for the daily chart is 'SELL' (0 Buy, 8 Sell, 0 Neutral). The most critical support level on the daily chart is 4067.88, followed by 4025.72 and 3960.64. Resistance is observed at 4175.12, 4240.2, and 4282.36. The convergence of bearish signals across multiple timeframes, especially the strong ADX readings, points towards a sustained downtrend unless significant market catalysts emerge.
Intermarket Correlations: DXY, Equities, and Oil
The current price action in gold cannot be viewed in isolation. Its movement is deeply intertwined with other major markets, creating a complex web of correlations that traders must navigate. The DXY's ascent, as noted, is a primary adversary to gold. With the DXY at 101.62 and showing a strong uptrend, its influence is amplified. This dollar strength is often fueled by global risk aversion, which is clearly visible in the equity markets. The SP500's current price of 6572.87 and its bearish 1D trend, coupled with Nasdaq100's data, suggests that investors are pulling back from riskier assets. This risk-off sentiment typically boosts demand for safe-haven assets, but currently, the dollar is capturing most of this demand, leaving gold vulnerable. Any sustained weakness in equities, therefore, is likely to continue weighing on gold prices, especially if the dollar remains firm.
Oil prices also play a crucial role, acting as both an inflation indicator and a geopolitical barometer. Brent crude, currently at 73.36, has seen a significant drop of 4.13% today. This decline in oil prices can be interpreted in several ways: easing geopolitical tensions (as hinted by news on US-Iran relations), or weakening global demand. If oil prices continue to fall, it could signal a potential slowdown in economic activity, which generally benefits the dollar and puts pressure on commodities like gold, unless it's perceived as a precursor to stagflationary pressures. However, the current narrative seems to be dominated by dollar strength and risk aversion, overshadowing any immediate inflation hedge appeal gold might typically offer in a falling oil price scenario. The recent euro weakness, partly attributed to falling oil prices and dovish ECB signals, further highlights the dollar's current dominance in the forex and commodity space.
Trade Scenarios and Risk Management
Bearish Scenario: Downside Continuation
65% ProbabilityNeutral Scenario: Consolidation and Choppiness
25% ProbabilityBullish Scenario: Short-Term Bounce Play
10% ProbabilityGiven the overwhelming bearish signals across multiple timeframes, the primary scenario anticipates further downside for gold. The 1-hour chart shows a general 'SELL' signal with strong ADX momentum. A break below the immediate 1H support at $3,977.34 would likely accelerate the move towards the daily support at $4,067.88, and potentially lower to $4,025.72. The confluence of a strong dollar, risk-off sentiment in equities, and bearish technicals paints a challenging picture for gold bulls in the short term. The 4-hour chart's RSI is deeply oversold at 29.57, and while this could signal a temporary bounce, the ADX at 46.83 indicates that any such bounce might be short-lived within the larger downtrend. Therefore, risk management is paramount. Traders should be looking for opportunities to enter short positions on pullbacks or to wait for clear confirmation of a reversal before considering long trades.
Navigating the Current Market Landscape
The current market conditions demand a high degree of caution and strategic positioning. The strong bearish trend in XAUUSD, supported by a strengthening dollar and risk aversion, suggests that downward pressure is likely to persist. The immediate focus remains on the key support levels identified across different timeframes. On the 1-hour chart, $3,977.34 is the first line of defense, followed by $3,966.64 on the 4-hour chart. A decisive break below these levels could trigger a cascade of selling, potentially pushing prices towards the $3,900s. Conversely, any upward movement would need to overcome significant resistance, starting with $4,011.64 on the 1H chart and $4,044.03 on the 4H chart. The daily RSI at 30.73 is approaching oversold territory, which might offer some respite, but the overall trend strength indicated by the ADX (39.68 on daily) suggests that the bears are firmly in control for now.
Furthermore, the broader economic context, including potential future central bank actions and geopolitical developments, will be critical in shaping gold's trajectory. While the provided data does not include specific upcoming economic events, traders should remain vigilant. Any unexpected shifts in monetary policy expectations, particularly from the Federal Reserve, or escalations in geopolitical hotspots, could rapidly alter the market sentiment and gold's price path. For instance, if inflation data were to resurface with unexpected strength, it could reignite safe-haven demand for gold, but currently, the dollar's dominance in this role is a significant factor. The sharp decline in oil prices also adds another layer of complexity, potentially signaling weaker global demand or easing geopolitical tensions, both of which can be bearish for gold in the current environment.
The divergence in signals between shorter-term oscillators like the Stochastic (showing potential upward swings on 1H and 4H) and longer-term trend indicators like ADX and RSI (showing strong bearish trends) highlights the need for a nuanced approach. Scalpers might look for short-term bounce opportunities off oversold levels, but swing and position traders should remain aligned with the dominant downtrend, waiting for clear confirmation before considering any long positions. The current environment is characterized by strong trending momentum on the daily charts, a clear indication that the market is committed to a direction. Until this trend shows signs of exhaustion or reversal, caution is the watchword.
Frequently Asked Questions: XAUUSD Analysis
What happens if XAUUSD breaks below $3,977.34 support?
A break below the 1-hour support at $3,977.34 would likely accelerate the bearish momentum, potentially targeting the next key support level at $3,960.19 on the daily chart. This would reinforce the prevailing downtrend and suggest further downside is probable.
Is the RSI at 39.53 a sell signal for XAUUSD right now?
An RSI of 39.53 on the 1-hour chart is in neutral territory but indicates a leaning towards bearishness, not outright oversold conditions. While not a direct sell signal on its own, it aligns with the prevailing bearish trend and suggests that upside potential is limited.
How is the strong DXY at 101.62 affecting XAUUSD?
The strengthening DXY at 101.62 typically exerts downward pressure on XAUUSD because gold becomes more expensive for buyers using other currencies. This inverse correlation is a significant factor contributing to gold's current decline, especially with the DXY showing strong upward momentum.
What is the outlook for XAUUSD if risk aversion continues?
If risk aversion persists, the US dollar is likely to remain strong as a preferred safe-haven asset, which would continue to pressure XAUUSD. While gold is also a safe haven, the current market dynamic favors the dollar, suggesting further declines for gold unless geopolitical events specifically drive demand for the precious metal.
Track markets in real-time
AI-powered analysis, technical indicators and real-time price data.
Join Our Telegram Channel
Breaking market news, AI analysis and trading signals instantly.
Join Channel