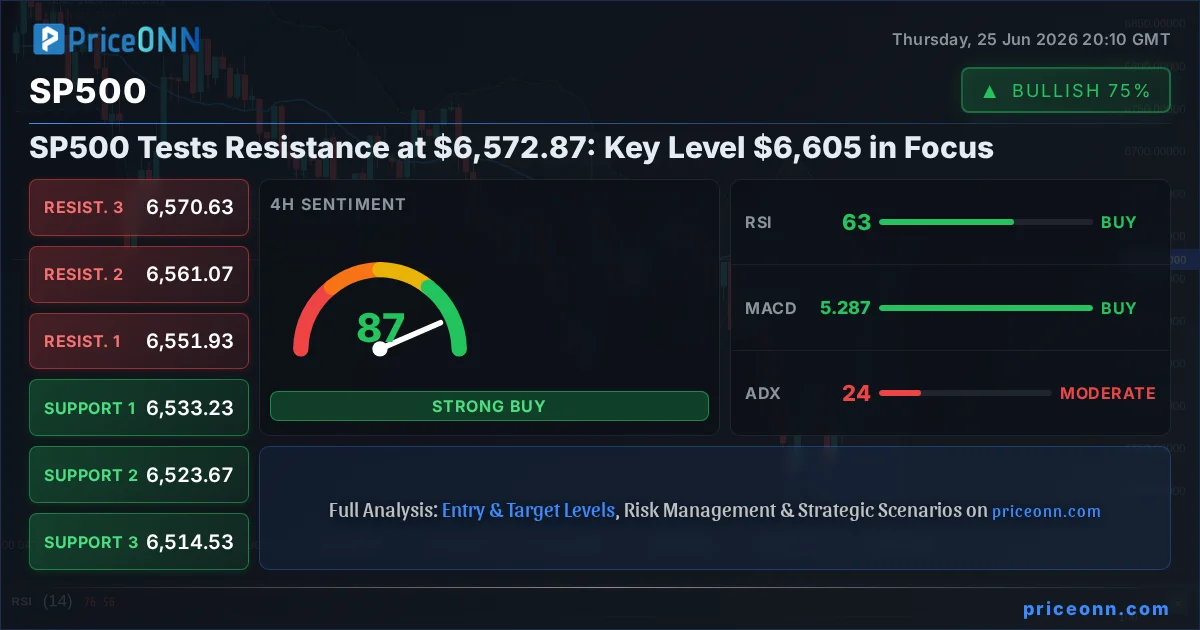
The S&P 500 is currently hovering around the $6,572.87 mark, a critical juncture where the market's next significant move may be decided. All eyes are on the $6,605 resistance level, a barrier that has historically dictated the index's short-to-medium term trajectory. With the index showing signs of strength in intraday trading, the question on every trader's mind is whether this level will hold, leading to a potential pullback, or if the bulls have enough momentum to push through, signaling a continuation of the uptrend. This analysis delves into the intricate technical landscape, exploring the probabilities behind potential market scenarios and the crucial data points that will guide trading decisions in the coming days.
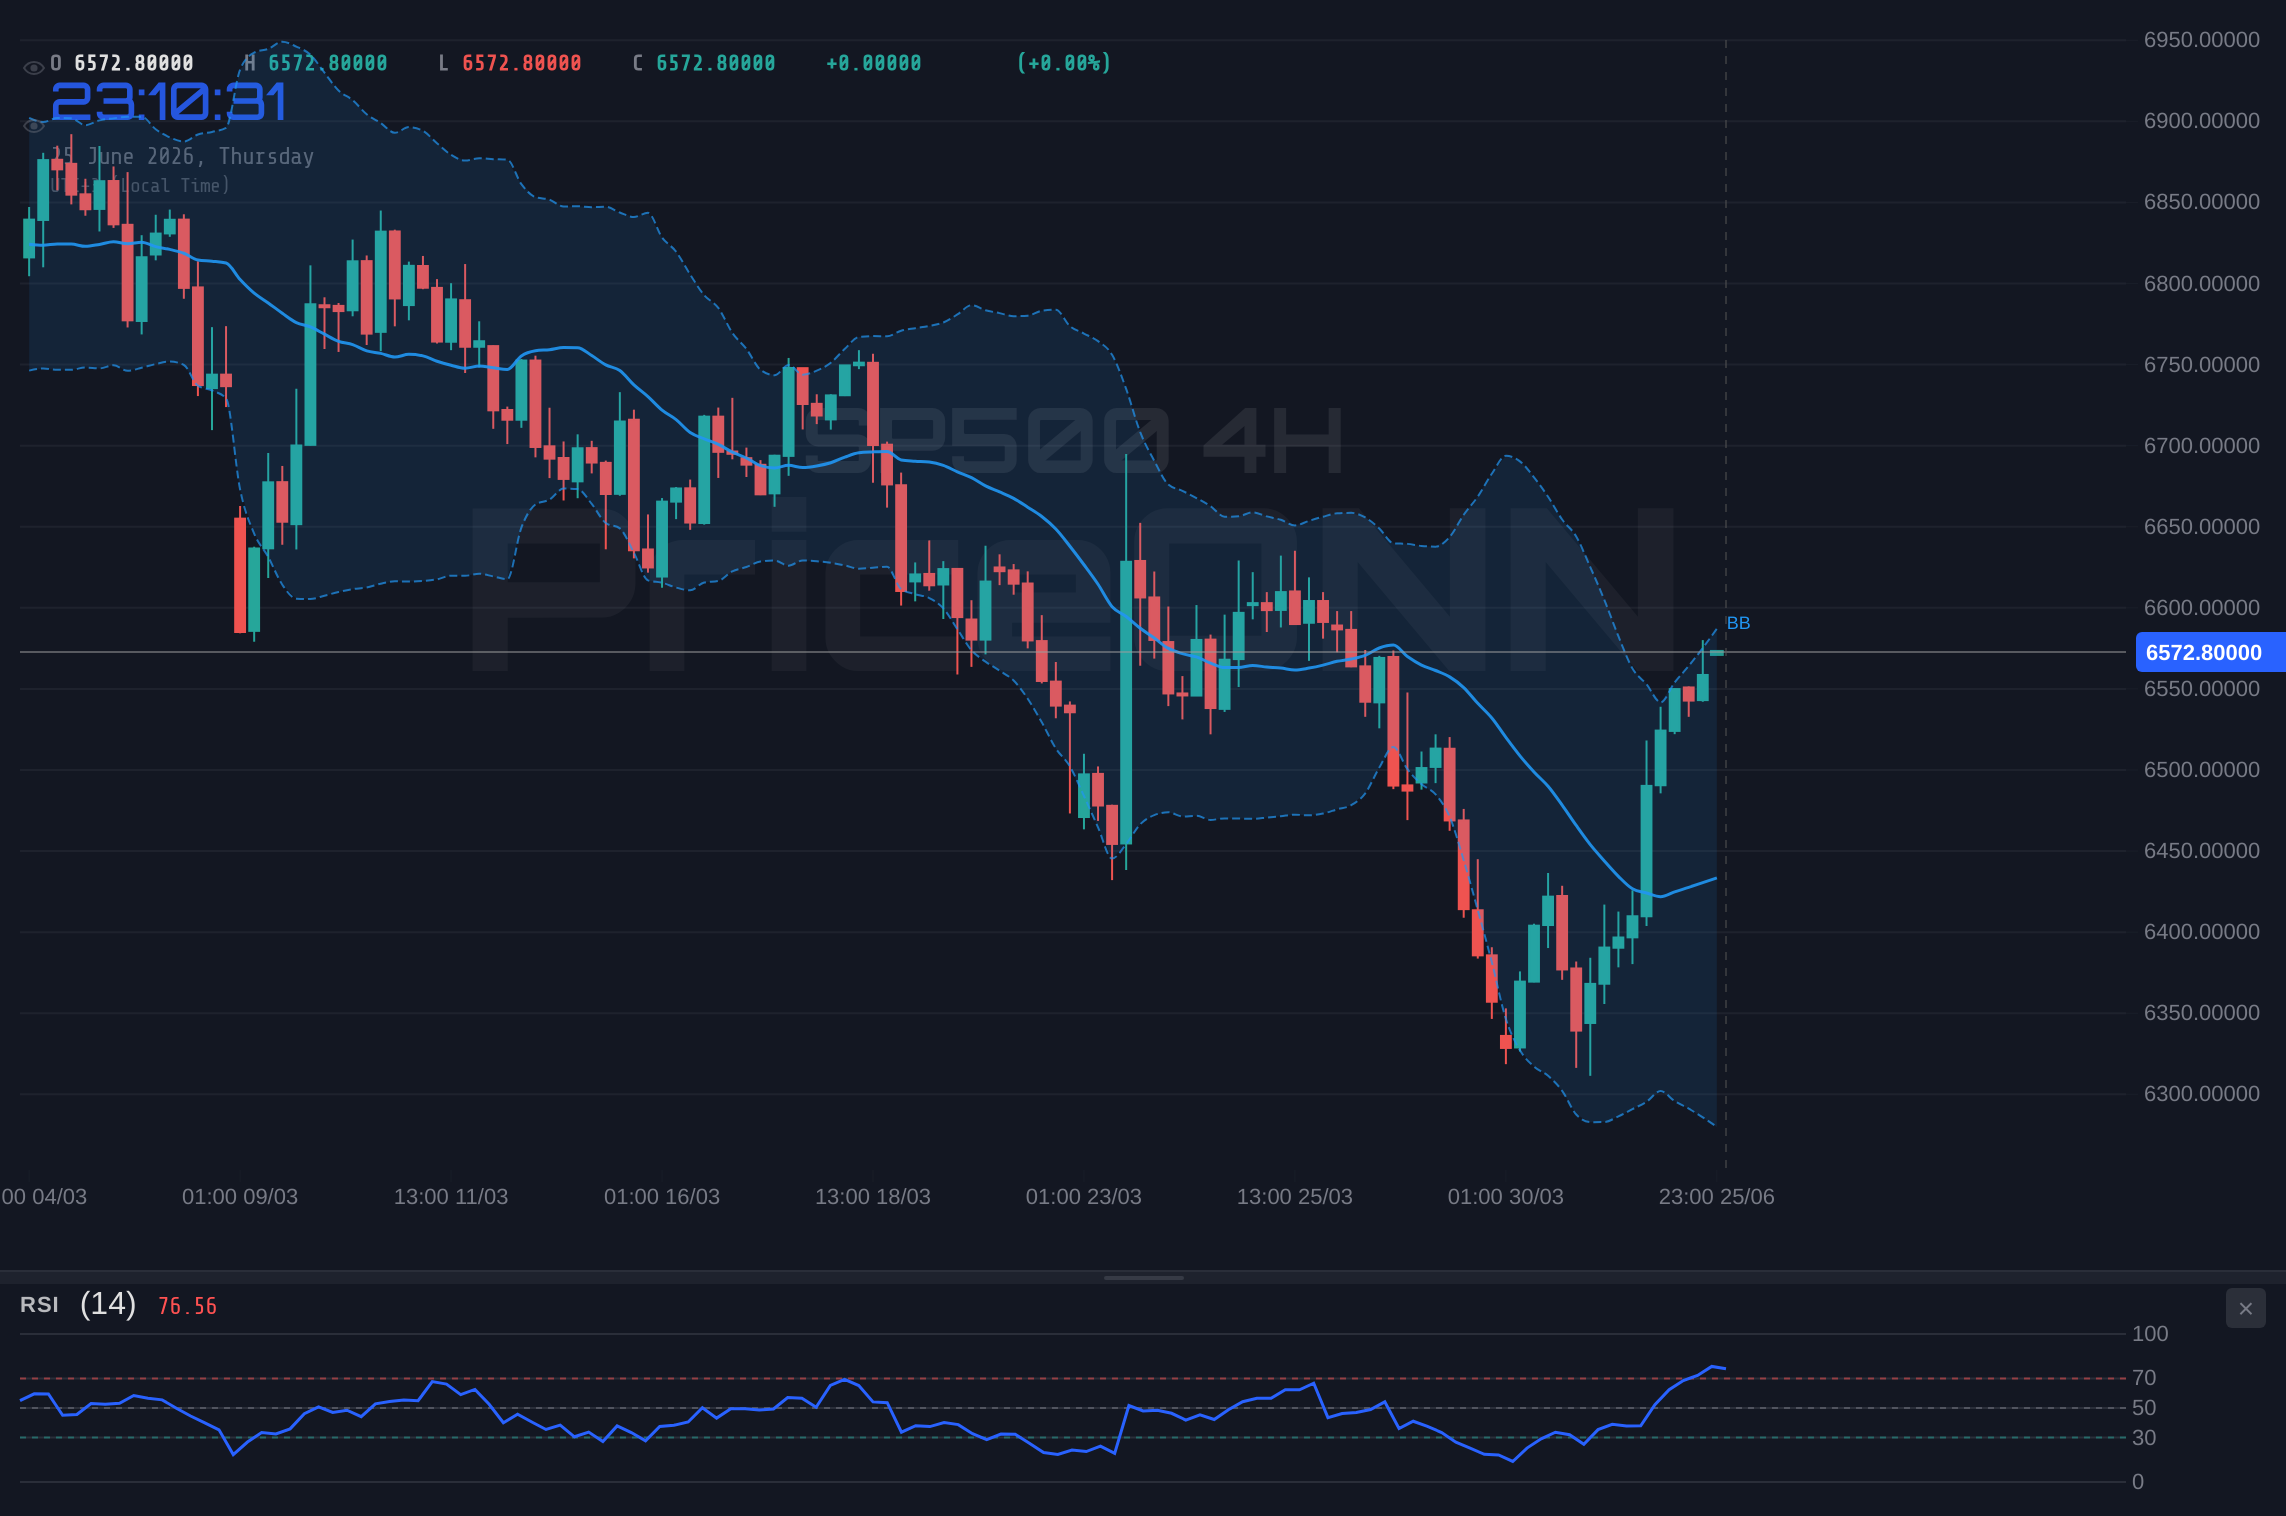
- With RSI at 70.95 on the 1H chart, overbought pressure is building, suggesting a potential pause or pullback is imminent.
- The critical resistance level sits at $6,605, a price point that has acted as a significant ceiling in recent trading sessions.
- MACD histogram divergence on the 1H chart indicates that bullish momentum may be fading, warranting caution for upward continuation.
- The correlation with DXY, currently at 101.46, suggests that dollar strength could exert downward pressure on risk assets like the S&P 500.
Navigating the $6,605 Rubicon: The Bullish Case
The immediate bullish outlook for the S&P 500 hinges on its ability to decisively break through the $6,605 resistance. On the 1-hour chart, the trend is currently showing a strong upward momentum, supported by an ADX reading of 49.72, indicating a robust trend is in play. If the index can sustain its current upward push and clear this psychological and technical hurdle, the next logical target would be the $6,685.83 resistance level. This scenario would be further bolstered if the RSI, currently at 70.95, can push into more extreme overbought territory without immediately triggering significant profit-taking, and if the MACD histogram, while showing divergence, can maintain positive momentum above the signal line. Such a move would suggest that the underlying strength is indeed present to absorb selling pressure and extend the rally, potentially targeting the higher resistance levels observed on the 4-hour chart, such as $6,700 and beyond. The key here is sustained momentum and volume accompanying the price action above $6,605, confirming that buyers are firmly in control and willing to bid prices higher.
For this bullish scenario to fully materialize, several conditions need to be met. Firstly, intraday price action must show resilience above the $6,572.87 current level, ideally consolidating or making higher lows. Secondly, the stochastic oscillator, which is showing a potential dip from overbought levels on the 1-hour chart, needs to either reset without a sharp reversal or continue its upward trajectory if it manages to stay above the 80 level. The 4-hour chart presents a neutral trend with a 50% strength, but the daily chart shows a strong downtrend. Therefore, a sustained move above $6,605 would need to overcome this broader daily bearish bias, indicating a significant shift in market sentiment. The strength of the US Dollar Index (DXY), currently at 101.46 and showing a strong upward trend on the 4-hour and daily charts, remains a potential headwind. A weakening DXY would provide additional tailwinds for this bullish S&P 500 scenario, whereas continued dollar strength could cap any upside attempts.
The immediate trigger for this bullish move would be a decisive close above the $6,605.07 resistance level on the 1-hour chart, accompanied by increased trading volume. If this breakout occurs, the first target would be the $6,685.83 resistance, followed by a more extended move towards $6,832.67. The invalidation of this bullish thesis would occur if the price fails to hold above $6,572.87 and decisively breaks below the $6,547.63 support level on the 1-hour chart, signaling that the bulls have lost control and are succumbing to selling pressure. This would then pivot the market's attention towards the downside scenarios.
The Bear's Playbook: Testing Support at $6,547
Conversely, the bearish outlook gains traction if the S&P 500 fails to overcome the $6,605 resistance. The technical indicators on the 1-hour chart already hint at potential weakness. The RSI at 70.95 is approaching overbought territory, and the MACD histogram shows divergence, suggesting that the recent upward momentum might be waning. If the index falters at $6,605, the immediate downside target would be the $6,547.63 support level. A break below this point would confirm the bearish sentiment, potentially accelerating towards the next support at $6,535.07. The 4-hour chart, while showing a neutral trend, has resistance at $6,561.07 and $6,570.63, which could act as immediate barriers to any upward bounce. The daily chart, however, presents a more significant bearish picture, with a strong downtrend and support levels much lower, such as $6,377.47. This indicates that any significant pullback could have substantial room to run if broader market sentiment shifts towards risk aversion.
The strength of the daily downtrend, indicated by an ADX of 47.51, cannot be ignored. If risk appetite deteriorates, perhaps due to geopolitical tensions or unexpected economic data, we could see a swift move lower. The correlation with the DXY, which shows a strong upward trend on its daily chart (ADX 40.13) and is nearing overbought RSI levels (73.35), presents a clear risk. A strengthening dollar would typically coincide with weakness in risk assets like the S&P 500. Furthermore, the Nasdaq 100's current 1-hour and 4-hour downtrend signals could spill over into the broader market. If the S&P 500 breaks below $6,547.63, the Stochastic on the 1-hour chart, currently showing a potential rise from oversold, would need to be watched closely to see if it can sustain upward momentum or if it succumbs to the prevailing bearish pressure. A failure to hold $6,547.63 could see price quickly retest the $6,535.07 level, and potentially the $6,526.53 support.
The trigger for this bearish scenario would be a confirmed close below the $6,547.63 support level on the 1-hour chart, ideally with increasing volume. The invalidation of this bearish thesis would occur if the index manages to reclaim and hold above the $6,572.87 level, and more importantly, breaks decisively above the $6,605.07 resistance. This would suggest that the dip was merely a temporary correction within a larger uptrend. If the bearish scenario plays out, the first target would be $6,535.07, followed by a more significant move towards the $6,377.47 support on the daily chart. Traders should be particularly attentive to any news regarding central bank policy shifts or significant geopolitical developments that could trigger a risk-off sentiment.
The Waiting Game: Consolidation Around $6,572
In the absence of a clear directional catalyst, the S&P 500 might enter a period of consolidation, trading within a defined range. This scenario often occurs when conflicting signals emerge from technical indicators or when the market awaits significant economic data releases. Currently, the 1-hour chart shows a neutral trend with 50% strength, and the ADX at 24.23 suggests a moderate trend, not a strong directional conviction. The price is currently trading near the $6,572.87 level, which could act as a pivot point, with resistance at $6,605.07 and support at $6,547.63. In this range-bound environment, scalpers and short-term traders might find opportunities by fading extremes – selling near resistance and buying near support.
The RSI on the 1-hour chart is at 70.95, teetering on the edge of overbought, while the daily RSI is at 45.35, indicating neither extreme bullish nor bearish sentiment. This divergence in RSI readings across timeframes supports the consolidation thesis. The stochastic oscillator on the 1-hour chart is showing a potential bullish signal (%K > %D), but this is occurring in a zone that could quickly turn overbought, especially if the price fails to break higher. The MACD histogram's divergence on the 1-hour chart also adds to the ambiguity. Traders in this scenario would focus on the boundaries of the $6,547.63 support and $6,605.07 resistance. A sustained hold above $6,572.87 could encourage a test of the upper bound, while a dip below it might see a test of the lower bound. Volume would be a key determinant; low volume during moves towards the extremes would reinforce the consolidation idea, while a surge in volume on a break of either level would signal the start of a new trend.
The neutral scenario's trigger is the failure of either the bullish or bearish scenarios to materialize. This means price action remains largely confined between $6,547.63 and $6,605.07. The invalidation of this consolidation phase would be a decisive break and sustained close above $6,605.07 or below $6,547.63. During such a period, traders might look for opportunities in other markets or adopt shorter-term strategies, waiting for a clearer signal to emerge. The market might be waiting for upcoming economic data, such as the PCE inflation data mentioned in recent news, or perhaps future central bank commentary, to provide the necessary impetus for a directional move. The lack of strong conviction across multiple timeframes reinforces the idea that this range could persist until a significant catalyst appears.
The Most Probable Path and Key Triggers
Considering the current technical picture, the most probable scenario for the S&P 500 appears to be a bearish bias, albeit with a significant probability of consolidation around current levels. The daily chart shows a strong downtrend with an ADX of 47.51, and the RSI at 45.35 suggests room for further downside before hitting oversold territory. While the 1-hour chart shows bullish momentum, the RSI at 70.95 and MACD divergence are flashing warning signs. The strong upward trend in the DXY (101.46) further supports a bearish outlook for risk assets. Therefore, I assign a 60% probability to the bearish scenario, a 30% probability to the consolidation scenario, and only a 10% probability to the sustained bullish breakout scenario at this moment. The key levels to watch are the $6,605.07 resistance to the upside and the $6,547.63 support to the downside.
The market sentiment is currently delicate. While the SP500 is showing some intraday strength, the broader daily trend and the strength of the dollar suggest that upside may be capped. The recent news about tech sector selling pressure and the euro sinking to a one-year low due to oil price drops and ECB rate cut bets highlights global economic uncertainties that could easily spill over into US equities. Traders should remain vigilant for any shifts in these underlying macro factors. The upcoming PCE inflation data, as highlighted in market commentary, will be crucial in shaping Fed rate expectations and, consequently, the direction of the S&P 500. A hotter-than-expected inflation reading could reinforce the dollar's strength and pressure equities, while a cooler reading might offer some relief and support a move higher, or at least a stabilization.
Bearish Scenario: Testing the Depths
60% ProbabilityConsolidation Scenario: The Waiting Game
30% ProbabilityBullish Scenario: Breaking Through
10% ProbabilityThis week, the key triggers will be:
- The S&P 500's ability to hold above the $6,572.87 level. A failure here could initiate the bearish scenario.
- A decisive break above $6,605.07. This would be the confirmation needed for the bullish outlook, though it currently seems less probable.
- The reaction to the upcoming PCE inflation data. A surprisingly high print could strengthen the DXY and weigh heavily on equities, favoring the bearish scenario.
Frequently Asked Questions: S&P 500 Analysis
What happens if SP500 breaks decisively above the $6,605.07 resistance?
If the S&P 500 breaks and sustains a close above $6,605.07 on increased volume, it would invalidate the bearish and consolidation scenarios. The immediate target would shift to the $6,685.83 resistance, with a potential extension towards $6,832.67, signaling a continuation of the bullish trend.
Should I consider buying SP500 at current levels of $6,572.87 given the mixed technical signals?
Given the conflicting signals – bullish intraday momentum versus bearish daily trend and overbought RSI on the 1H chart – caution is advised. A more prudent approach might be to wait for a clearer signal, such as a confirmed breakout above $6,605.07 or a retest of the $6,547.63 support level. Risk management is paramount.
Is the RSI at 70.95 a sell signal for SP500 right now?
An RSI of 70.95 on the 1-hour chart indicates overbought conditions, which can signal a potential pullback or consolidation. However, it's not an automatic sell signal on its own, especially if the overall trend remains strong. It suggests that bullish momentum might be exhausting, and traders should look for further confirmation, like MACD divergence or a break of support, before initiating a short position.
How will the upcoming PCE inflation data affect SP500 this week?
Higher-than-expected PCE inflation data could strengthen the US Dollar Index (DXY) and increase fears of prolonged high interest rates, potentially pressuring the S&P 500 lower. Conversely, cooler inflation figures might ease rate hike concerns, supporting risk assets and potentially lifting the S&P 500 towards its resistance levels.
| Indicator | Value | Signal | Interpretation |
|---|---|---|---|
| RSI (1H) | 70.95 | Overbought | Potential exhaustion, watch for divergence |
| MACD (1H) | Divergence | Weakening Momentum | Bullish momentum appears to be fading |
| Stochastic (1H) | K=65.73, D=73.5 | Dipping | Potential bearish cross or consolidation |
| ADX (1H) | 49.72 | Strong Trend | Trend strength is high, but direction may shift |
| Trend (1D) | Downtrend | Dominant Bearish | Daily trend remains bearish, capping upside |
Track markets in real-time
AI-powered analysis, technical indicators and real-time price data.
Join Our Telegram Channel
Breaking market news, AI analysis and trading signals instantly.
Join Channel