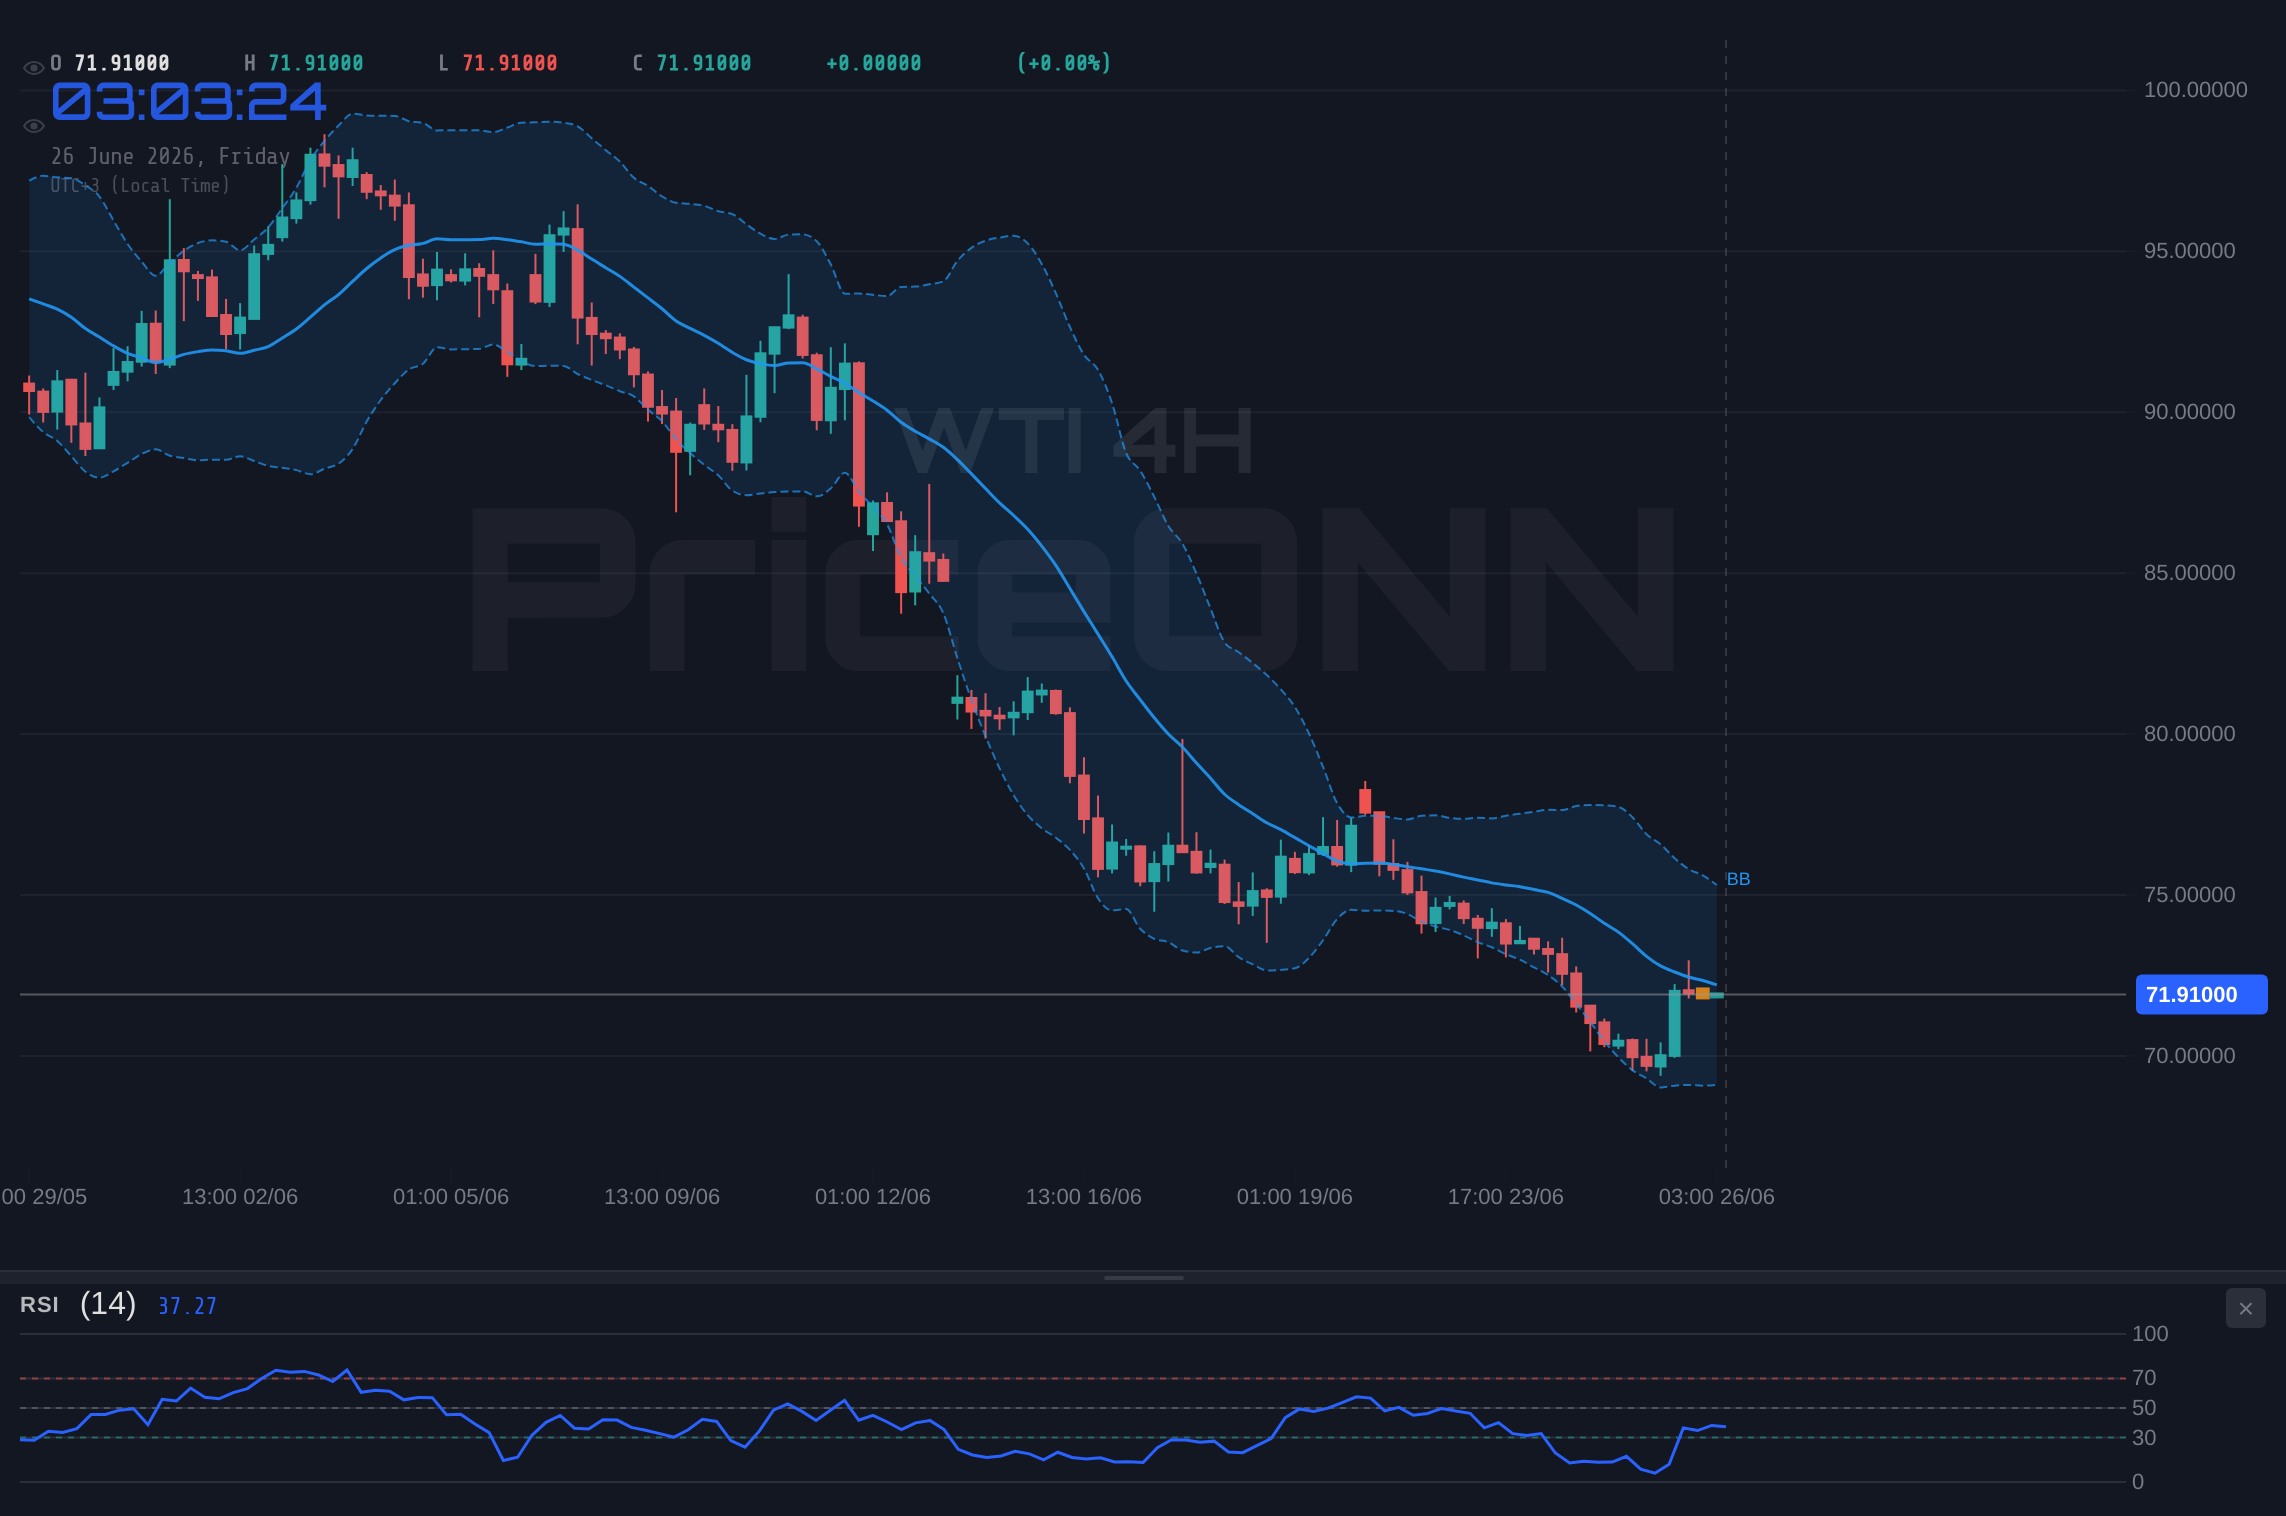
WTI Crude Oil is currently hovering around the critical $72.00 mark, a level that has become a focal point for traders and analysts alike. The recent upward push has brought the commodity to test resistance near $72.65, but the technical indicators present a mixed and cautionary picture. While the 1-hour chart shows some signs of bullish momentum, the broader outlook across the 4-hour and daily timeframes reveals persistent downward trends, with the Relative Strength Index (RSI) flashing oversold signals. This divergence between short-term price action and longer-term trend strength creates a complex trading environment, demanding a nuanced approach. Understanding the interplay between these technical signals, the underlying market sentiment, and potential geopolitical catalysts is paramount for navigating WTI's immediate future.
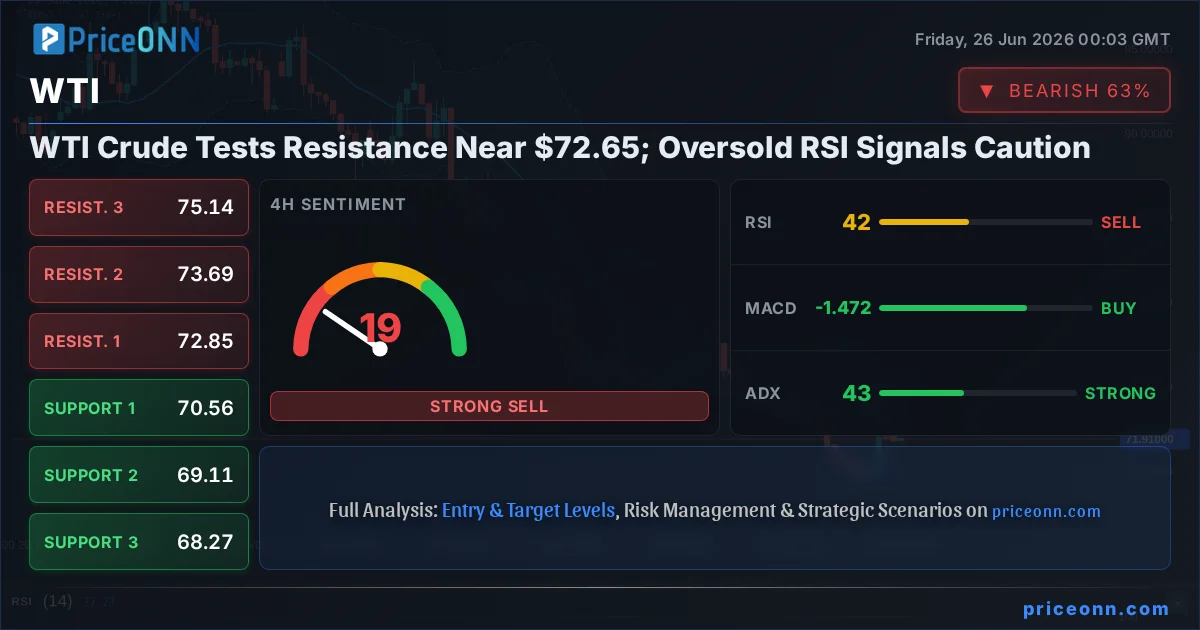
- WTI Crude faces significant resistance near the $72.65 level, currently trading at $72.00.
- The 4-hour and 1-day RSI readings are deep in oversold territory (42.03 and 29.93 respectively), suggesting potential for a short-term bounce but within a dominant downtrend.
- ADX readings across timeframes indicate strong trends: 30.88 (1H), 43.2 (4H), and 30.11 (1D), signaling that when a trend is established, it carries considerable force.
- The current price action shows a battle between short-term momentum and established downtrends, making $72.00 a crucial pivot point.
- Geopolitical tensions and upcoming economic data releases will be key in determining whether WTI can sustain a move higher or if the downtrend will reassert itself.
The Bull's Roadmap: Navigating Above $72.00
For WTI bulls to regain control, a decisive break above the immediate resistance at $72.65 is paramount. The 1-hour chart, which shows a trend strength of 50% and MACD with positive momentum, offers a glimmer of hope. However, this short-term optimism is heavily outweighed by the persistent downtrend signals on longer timeframes. For a sustained bullish move, WTI needs to not only clear the $72.65 resistance but also convincingly break through the subsequent resistance levels at $72.85 and $73.69. This would require a significant shift in market sentiment, potentially driven by unexpected supply disruptions or a major geopolitical escalation that boosts demand expectations. The Stochastic indicator on the 4-hour chart showing %K > %D might offer a hint of a potential bounce, but it needs to be supported by broader market strength and fundamental shifts. A move above $72.85, and especially holding above this level with increasing volume, would be the first sign that the bears are losing their grip. The ultimate test would be challenging the $75.63 resistance, but that seems a distant prospect given the current technical and fundamental backdrop.
Bullish Scenario: A Reversal Attempt
15% ProbabilityWhere Bears Take Control: The $71.56 Line in the Sand
The bearish outlook for WTI remains dominant, supported by strong downtrend signals across multiple timeframes. The 4-hour chart shows a 100% downtrend strength with an ADX of 43.2, and the 1-day chart mirrors this with a 100% downtrend strength and an ADX of 30.11. The RSI on the 1-day chart is deeply oversold at 29.93, indicating significant selling pressure that could precede a bounce, but the overall trend remains firmly down. If WTI fails to hold the $72.00 level, the immediate support at $71.81 and $71.66 will be tested. A decisive break below $71.56, which is a key support level on the 1-hour chart, would likely trigger further selling pressure, targeting the $70.56 support level on the 4-hour chart. This scenario is further bolstered by the negative momentum indicated by the MACD on both the 4H and 1D charts, and the consistently lower lows observed in recent price action. The geopolitical landscape, while volatile, has not yet presented a sustained fundamental catalyst to reverse this downward trajectory, and the strengthening US Dollar (DXY currently at 101.56, with a strong 4H and 1D uptrend) further pressures oil prices.
Bearish Scenario: Downtrend Resumes
65% ProbabilityThe Waiting Game: Range-Bound Consolidation Near $72.00
Between the strong bearish trend and the oversold conditions that might prompt a short-term bounce, WTI could enter a phase of consolidation. This neutral scenario often occurs when market participants await clearer direction from macroeconomic data or geopolitical events. The current price action, fluctuating around $72.00 with resistance at $72.65 and support at $71.81 on the 1-hour chart, exemplifies this indecision. In such a range-bound environment, volatility might decrease temporarily, but the underlying trend forces remain. Traders might see choppy price action within the $71.56 to $72.65 range, with neither bulls nor bears able to establish a firm foothold. The ADX values on the 4-hour (43.2) and 1-day (30.11) charts, while indicating strong trends, can also reflect a period of consolidation if price action fails to make significant progress. This phase could be characterized by lower trading volumes as participants hold back. Confirmation of this scenario would involve price repeatedly testing and failing to break either the immediate support or resistance levels, creating a sideways channel. It's a period where patience is key, waiting for a definitive breakout signal rather than trying to force trades within a tight range.
Neutral Scenario: Consolidation Phase
20% ProbabilityThe Most Likely Path Forward: Bears in the Driving Seat
Considering the technical data, the bearish scenario appears to be the most probable outcome in the short to medium term. The overwhelming strength of the downtrend on the 4-hour and daily charts, evidenced by ADX values of 43.2 and 30.11 respectively, cannot be ignored. While the oversold RSI on the daily chart (29.93) suggests a potential for a bounce, historically, oversold conditions within a strong downtrend can persist, leading to further downside before any significant reversal. The MACD on both the 4H and 1D charts also continues to show negative momentum, reinforcing the bearish bias. The immediate resistance at $72.65 and support at $71.56 are the key levels to watch. A failure to break above $72.65, followed by a decisive move below $71.56, would validate the bearish thesis and likely lead to a retest of the $70.56 and potentially $69.11 support levels. The current geopolitical climate, while providing occasional spikes, has not fundamentally altered the supply/demand balance enough to reverse the trend. Furthermore, the strengthening US Dollar Index (DXY), currently showing strong uptrends on 4H and 1D charts, acts as a headwind for commodities priced in dollars, including WTI. Therefore, the probability leans heavily towards the continuation of the downtrend, with the possibility of a short-term consolidation before further declines.
What I'm Watching: Key Triggers for WTI
The immediate future of WTI hinges on a few critical technical and fundamental factors. Firstly, the price action around the $72.00 psychological level and the immediate resistance at $72.65 is paramount. A failure to break higher here, coupled with a slip below the $71.56 support, will be a strong signal for the bears. Secondly, I'll be closely monitoring the RSI on the daily chart. While currently oversold at 29.93, a sustained break below 30 would further confirm the bearish momentum. Conversely, a sharp move above 50 would signal a potential shift, but this needs confirmation from price action and MACD. Lastly, any significant developments in the Middle East or major shifts in central bank policy expectations (particularly from the Federal Reserve, given the DXY's strength) could quickly alter the landscape. Traders should remain vigilant for these signals, managing risk tightly as the market navigates these conflicting technical indicators and uncertain fundamental drivers.
Connecting the Dots: Macro Drivers and WTI's Path
The price of WTI Crude Oil is intrinsically linked to the broader macroeconomic environment, and current conditions suggest headwinds for the commodity. The strengthening US Dollar Index (DXY), currently at 101.56 and exhibiting strong uptrends on the 4-hour and daily charts, typically exerts downward pressure on dollar-denominated commodities like oil. This inverse correlation means that as the dollar gains strength, WTI becomes more expensive for holders of other currencies, potentially dampening demand. Furthermore, the performance of major equity indices like the S&P 500 and Nasdaq, which are currently showing mixed signals with the S&P 500 in a strong uptrend (6572.87) while Nasdaq is in a downtrend (29410.2), adds another layer of complexity. A risk-off sentiment, as suggested by Nasdaq's recent decline, could lead investors away from riskier assets like oil and towards safer havens, further pressuring WTI prices. Analyst recommendations, such as Peabody Energy (BTU) being a top metals pick, while not directly WTI, indicate a broader sentiment shift within the energy and metals sector that might favor certain commodities over others. The recent news regarding the euro sinking to a one-year low due to cooling oil prices and ECB rate cut bets highlights the interconnectedness of energy prices, currency movements, and monetary policy expectations. This suggests that global economic health and inflation expectations, heavily influenced by energy costs, remain a key factor shaping WTI's trajectory.
The Fed's Shadow and Inflationary Concerns
The Federal Reserve's monetary policy stance continues to be a significant driver for commodity markets. While the Fed has signaled a data-dependent approach, the persistent strength in the US Dollar suggests that market participants are pricing in a higher probability of continued hawkishness or a slower pace of rate cuts than previously anticipated. This is particularly relevant given that oil prices have historically been a significant contributor to inflation. If oil prices remain elevated or surge, it could complicate the Fed's efforts to bring inflation back to its target, potentially leading to a more prolonged period of higher interest rates. Conversely, a sustained drop in oil prices, as suggested by the current downtrend in WTI, could ease inflationary pressures and provide the Fed with more flexibility to consider rate cuts sooner. The market is constantly weighing these possibilities, and any indication from Fed officials or upcoming inflation data (like PCE, which is a key focus) will be crucial in shaping WTI's price action. The current oversold conditions in WTI, combined with a strong dollar and potentially hawkish Fed outlook, paint a picture of continued downside risk for crude oil in the near term.
The Waiting Game: Consolidation or Capitulation?
The current technical setup for WTI presents a precarious balance. On one hand, the oversold RSI on the daily chart (29.93) suggests that the selling pressure might be reaching a point where a technical bounce is likely. This could lead to a period of consolidation, where WTI trades within a defined range, perhaps between the $71.56 support and the $72.65 resistance levels identified on the 1-hour chart. This neutral scenario would likely persist until a clear catalyst emerges, either from geopolitical events or significant economic data releases. However, the sheer strength of the downtrend indicated by the ADX on the 4-hour (43.2) and daily (30.11) charts cannot be understated. If the market sentiment remains risk-averse, or if the US Dollar continues its ascent, the oversold conditions might simply pave the way for further capitulation. This means that instead of a bounce, WTI could break through the key support levels, accelerating its decline towards the $70.56 and $69.11 targets. The key to distinguishing between consolidation and capitulation will be the volume accompanying price movements and the ability of WTI to hold or break key support levels in the coming days. The market is essentially holding its breath, waiting for a definitive signal.
| Indicator | Value | Signal | Interpretation |
|---|---|---|---|
| RSI (14) | 29.93 | Oversold | Potential bounce, but strong downtrend persists. |
| MACD | -0.83 | Negative Momentum | Selling pressure is dominant on daily chart. |
| Stochastic | K=8.3, D=8.37 | Oversold | Deeply oversold, potential for reversal but needs confirmation. |
| ADX | 30.11 | Strong Trend | Confirms a powerful downtrend on the daily chart. |
| Bollinger | Middle Band | Below | Price is trading below the middle band, indicating bearish sentiment. |
The Verdict: Leaning Bearish Amidst Technical Crosscurrents
The technical landscape for WTI Crude Oil presents a clear dichotomy. On one hand, the oversold readings on key oscillators like the RSI and Stochastic on the daily chart (RSI 29.93, Stochastic K=8.3, D=8.37) suggest that the commodity is technically ripe for a bounce. This could lead to a short-term upward correction, potentially testing resistance levels around $72.65. However, the overwhelming evidence from the trend strength indicators, particularly the ADX on the 4-hour (43.2) and daily (30.11) charts, points towards a dominant and powerful downtrend. The MACD on the daily chart also continues to signal negative momentum. Therefore, while a short-term technical bounce is possible, the probability of a sustained bullish reversal appears low without significant fundamental shifts or a dramatic change in geopolitical risk. The most probable scenario remains a continuation of the downtrend, with the key support level at $71.56 being a critical point to watch. A break below this level would likely accelerate selling pressure towards $70.56 and $69.11. The correlation with the strengthening US Dollar and potential headwinds from global economic slowdown fears further reinforce this bearish outlook. Traders should exercise caution, looking for opportunities to short on rallies or waiting for a clear breakout below key support levels.
What Traders Should Watch This Week
The coming week for WTI Crude Oil will be defined by its ability to either consolidate its recent gains or succumb to the prevailing downtrend. Key technical levels to monitor are the $72.00 psychological mark, the immediate resistance at $72.65, and the critical support at $71.56. A sustained move above $72.65, particularly with strong volume, could signal a short-term bullish correction, targeting $73.69. Conversely, a break below $71.56 would likely confirm the resumption of the downtrend, opening the door for moves towards $70.56 and $69.11. Fundamentally, traders will be watching for any significant geopolitical developments in the Middle East that could disrupt supply, as well as key economic data releases, particularly inflation figures and central bank commentary, which could influence the US Dollar and overall market risk appetite. The correlation with the DXY remains a significant factor; any weakening in the dollar could provide a tailwind for WTI, while further strength would likely add to the downward pressure.
Frequently Asked Questions: WTI Analysis
What happens if WTI breaks below the $71.56 support level?
If WTI closes decisively below $71.56, the established downtrend is likely to resume, potentially targeting support levels at $70.56 and $69.11. This would invalidate short-term bullish hopes and reinforce the bearish sentiment seen on the 4-hour and daily charts.
Should I buy WTI at current levels around $72.00 given the oversold RSI?
Buying at current levels is risky given the strong downtrend indicated by ADX (43.2 on 4H). While the RSI is oversold (29.93 on 1D), a bounce needs confirmation. A more prudent approach might be to wait for a clear break above $72.85 resistance or a confirmed bullish reversal pattern, targeting at least $73.69.
Is the RSI at 29.93 a sell signal for WTI right now?
An RSI of 29.93 on the daily chart is considered oversold, which typically suggests a potential for a bounce rather than a direct sell signal. However, within a strong downtrend (ADX 30.11), oversold conditions can persist. It signals that the market is heavily bearish, but a bounce is technically due, albeit likely short-lived unless fundamentals shift.
How will the strengthening US Dollar affect WTI prices this week?
The US Dollar Index (DXY) is showing strong uptrends on multiple timeframes. A stronger dollar typically makes oil more expensive for foreign buyers, potentially dampening demand and putting downward pressure on WTI prices. Expect this correlation to remain a key factor, suggesting further downside for WTI if the DXY continues to climb.
The path forward for WTI Crude Oil remains fraught with technical crosscurrents. While oversold indicators hint at a potential short-term bounce, the dominant downtrend, reinforced by strong ADX readings and negative MACD momentum on longer timeframes, suggests that any upward moves may be temporary. The critical levels to watch are the immediate resistance near $72.65 and the support at $71.56. A decisive break below $71.56 would likely confirm the resumption of the downtrend, targeting lower levels. Traders should remain vigilant, managing risk prudently and waiting for clear signals before committing to positions. The interplay between technicals, geopolitical events, and macroeconomic factors, particularly the US Dollar's strength, will dictate WTI's trajectory in the coming days. Patience and discipline will be key to navigating this complex market.
Track markets in real-time
AI-powered analysis, technical indicators and real-time price data.
Join Our Telegram Channel
Breaking market news, AI analysis and trading signals instantly.
Join Channel