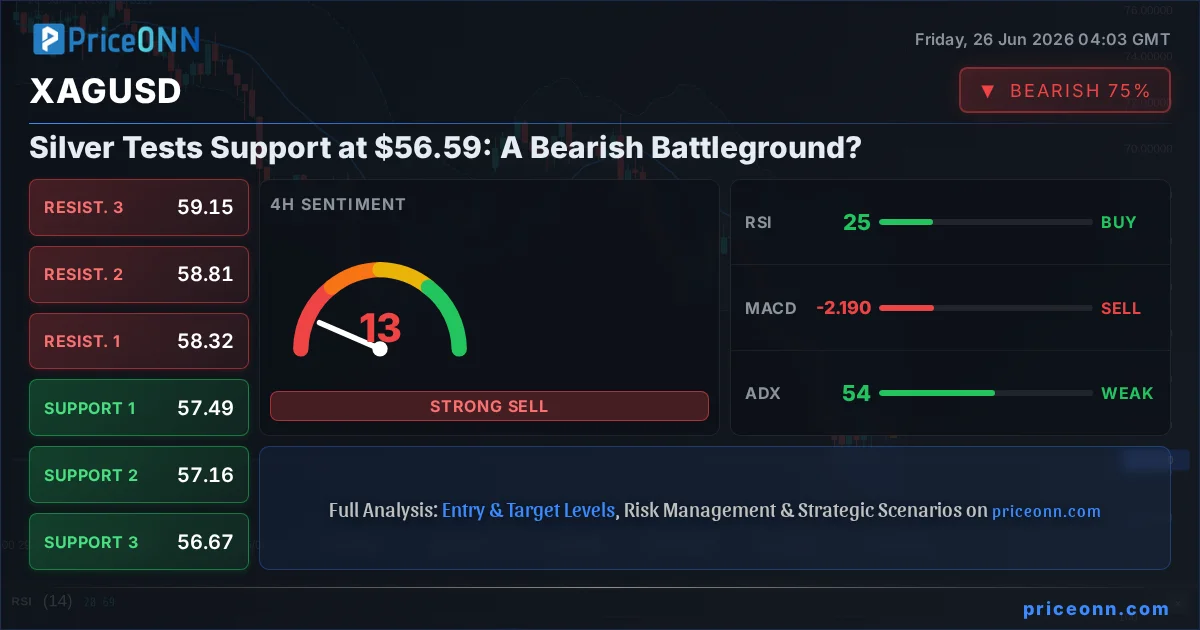
Is the recent pullback in silver a temporary pause or the beginning of a more significant downturn? The precious metal, currently trading at $56.59, is locked in a fierce tug-of-war between bears pushing for lower prices and bulls attempting to defend key support levels. This tension is palpable across multiple timeframes, with technical indicators offering a complex, often contradictory, picture. Understanding the interplay between these signals and the broader market context is crucial for navigating the current volatility. This analysis dives deep into the charts, indicators, and market sentiment to dissect the ongoing battle for control in the XAGUSD market.
- With RSI at 39.87 on the 1H chart, silver shows neutral momentum but a downward bias, signaling caution for aggressive buyers.
- The critical support level for XAGUSD currently sits at $55.33, a price point that has historically acted as a floor during periods of selling pressure.
- The ADX reading of 53.97 on the 4H chart indicates a very strong downtrend, suggesting that downward momentum is a dominant force.
- The correlation with a strengthening Dollar Index (DXY), currently at 101.47, is a significant headwind for silver, putting downward pressure on prices.
The Bears' Grip: Why Downside Momentum Persists
The narrative for silver bears remains compelling, supported by a confluence of technical and cyclical factors. On the daily timeframe, XAGUSD is firmly entrenched in a downtrend, with a formidable 98% trend strength indicated by the ADX at 36.69. This isn't just a minor correction; it's a sustained move lower that has seen prices consistently make lower lows and lower highs. The sheer force of this trend is underscored by the ADX value, which suggests that any attempts at a sustained rally face significant headwinds. The MACD on the daily chart also paints a bearish picture, sitting below its signal line with negative momentum, indicating that selling pressure is still dominant. Furthermore, the Stochastic Oscillator is deep in oversold territory (K=10.64, D=23.15), which, while often signaling a potential bounce, can also persist in strong downtrends, suggesting further downside could still materialize before any meaningful recovery.
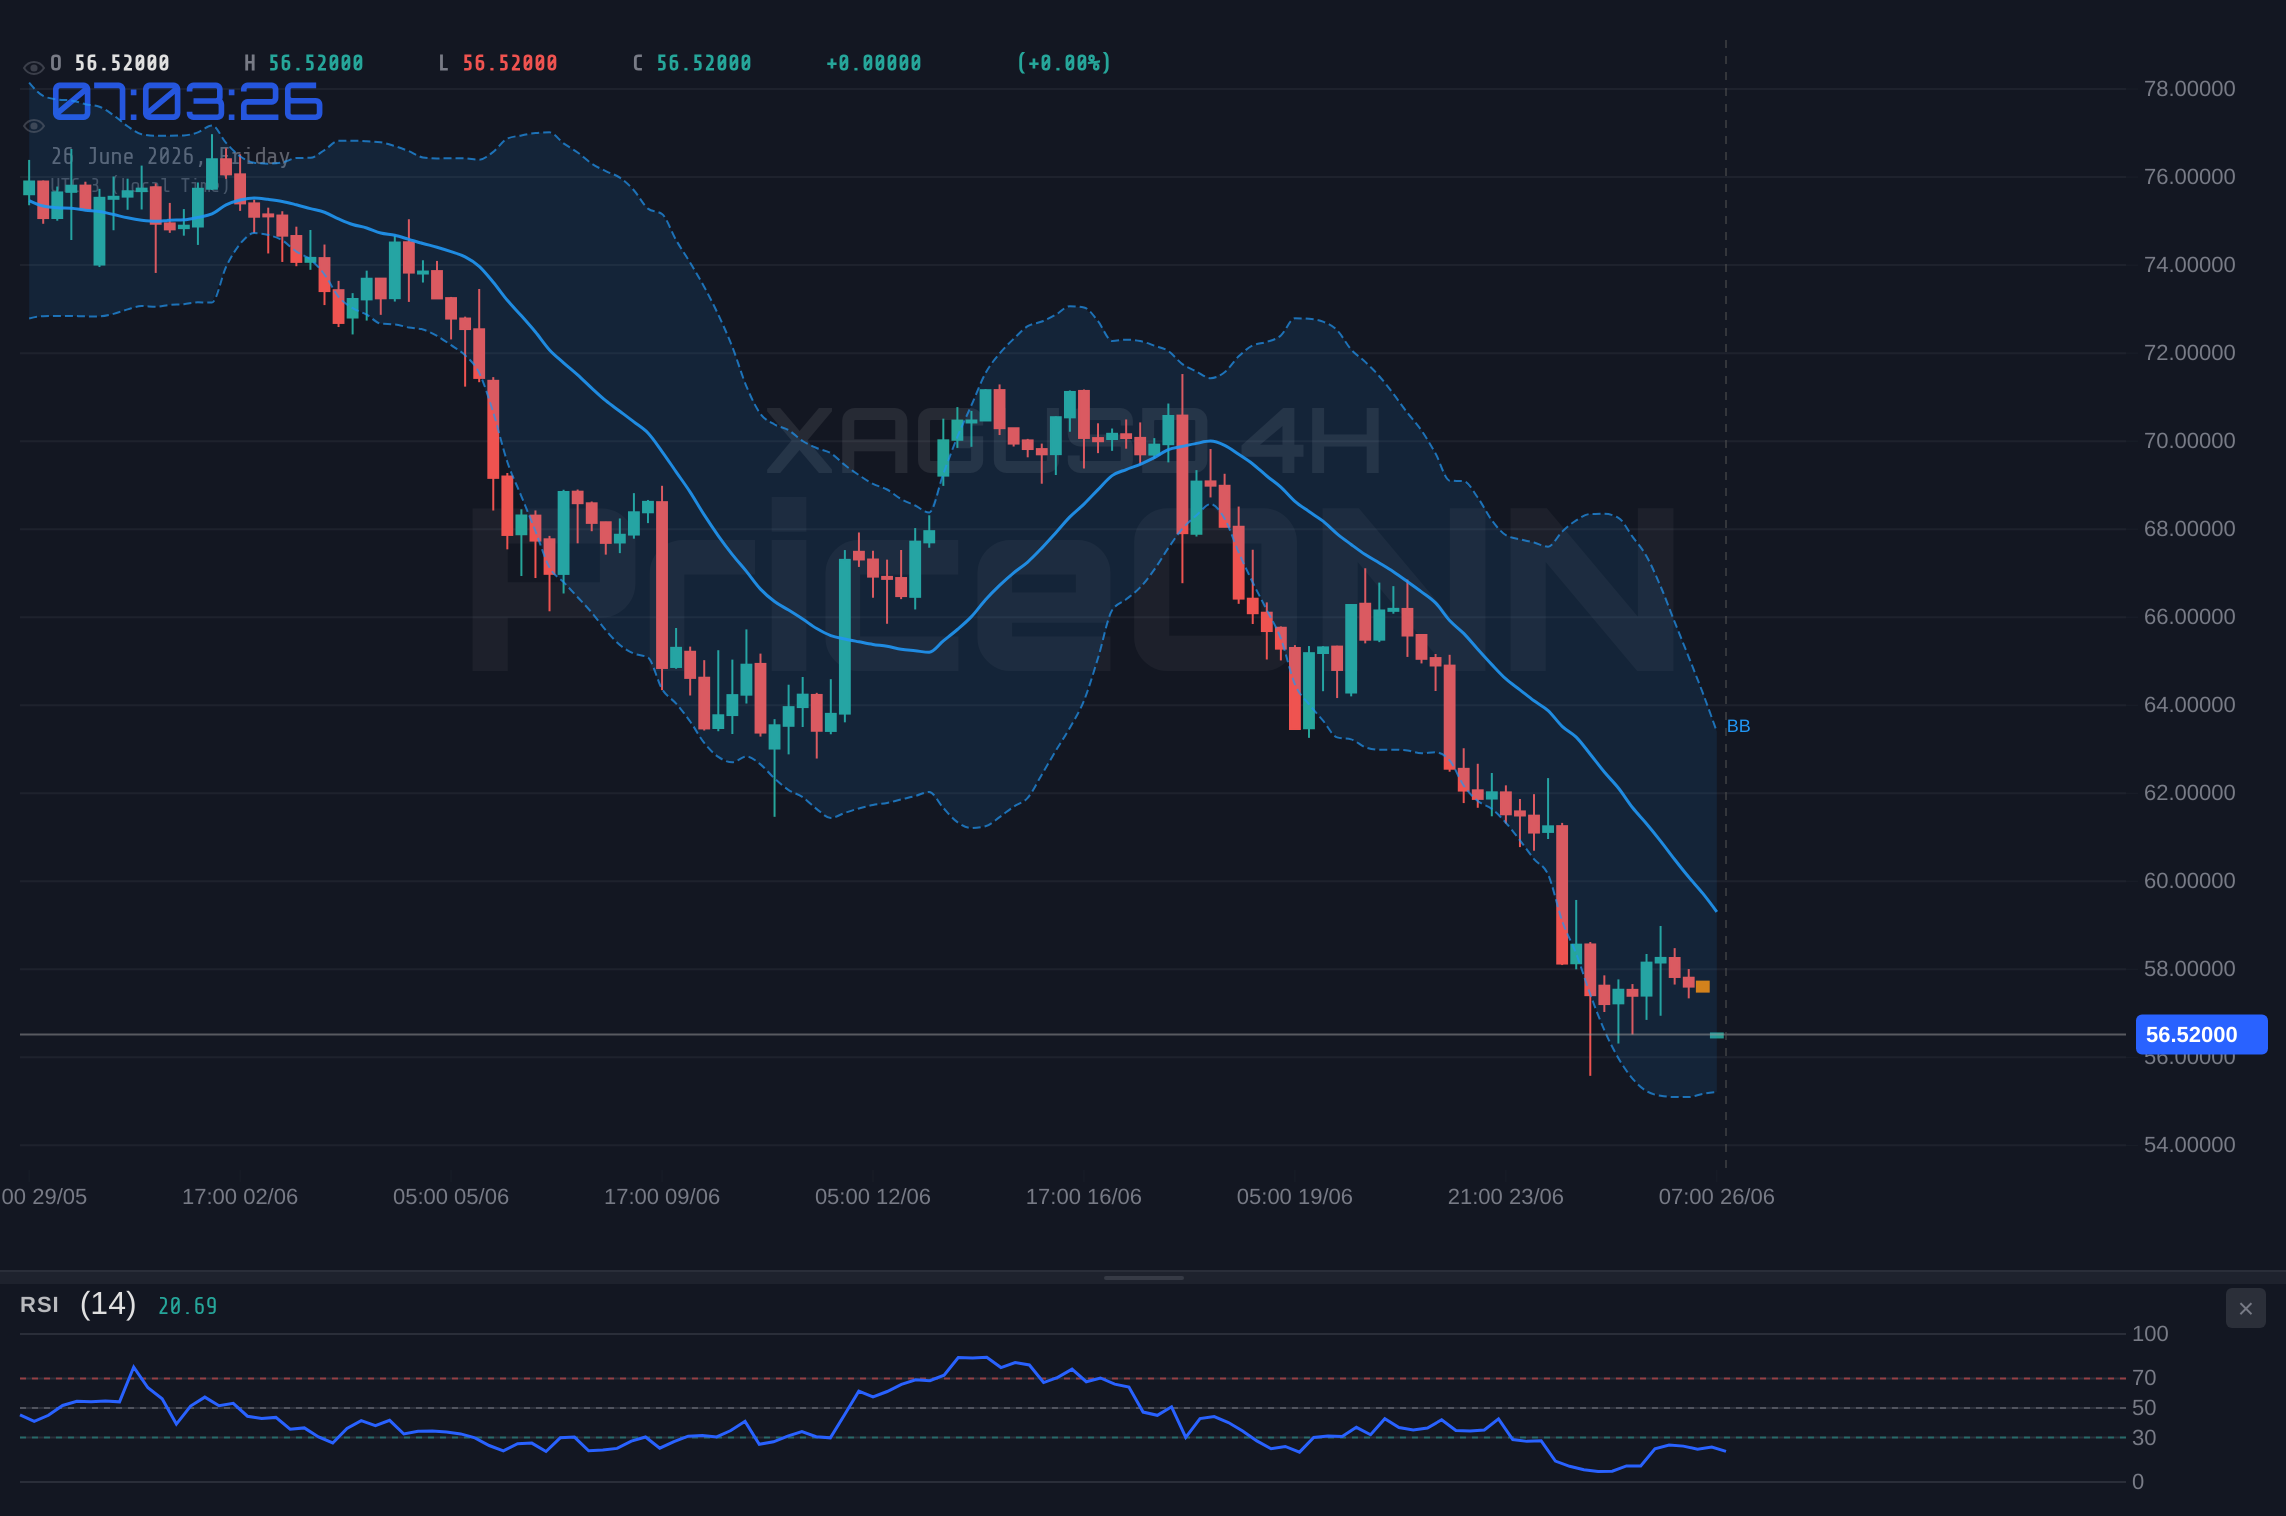
Looking at the intraday charts, the bearish sentiment is equally evident. The 1-hour chart shows a downtrend with 100% strength and an ADX of 29.16, reinforcing the prevailing downward momentum. The RSI at 39.87, while not deeply oversold, indicates a lack of bullish conviction and leans towards further weakness. The MACD on this timeframe is also negative, confirming the bearish bias. Even on the 4-hour chart, where the trend strength is slightly less pronounced at 97%, the ADX at 53.97 screams 'strong downtrend'. This suggests that the short-term fluctuations are unlikely to derail the larger bearish narrative without significant catalysts. The Bollinger Bands on all timeframes are also positioned below the middle band, indicating downward pressure and potential for further price depreciation. The consistent 'SELL' signals across most shorter-term timeframes (1H and 4H) further bolster the bears' case, suggesting that immediate opportunities lie on the short side.
The broader market correlation analysis adds another layer to the bearish outlook. The Dollar Index (DXY), currently trading at 101.47, has been showing signs of strength, particularly on the daily timeframe where its trend is strongly bullish (100% strength, ADX 41.74). A rising dollar typically acts as a headwind for dollar-denominated commodities like silver, as it makes them more expensive for holders of other currencies. This inverse relationship is a critical factor. When the dollar strengthens, demand for safe-haven assets like gold and silver can wane, especially if global risk appetite is not significantly deteriorating. The current market environment, with the DXY showing upward momentum, directly challenges any immediate bullish thesis for XAGUSD. The narrative is clear: as the dollar firms, silver faces increased selling pressure.
The Bulls' Stand: Seeking Opportunity in Weakness
Despite the prevailing bearish sentiment, the bulls are not entirely without hope. The silver market is currently testing significant support levels, and historical price action suggests these zones could provide a floor. On the daily chart, the first key support level is identified at $56.43, followed by $55.04 and $53.76. The 4-hour chart also highlights important support zones at $57.49, $57.16, and $56.67. It's crucial to note that the current price of $56.59 is hovering precariously close to the $56.67 support on the 4H timeframe, making this area a critical battleground. If these levels hold, it could signal a potential reversal or at least a temporary bottoming process, offering opportunities for traders looking to catch a bounce.
The technical indicators, while largely bearish, offer glimmers of hope for the bulls. On the 4-hour chart, the Stochastic Oscillator is showing a potential buy signal with %K (52.94) crossing above %D (33.42), indicating that the oversold conditions might be starting to reverse. While this signal needs confirmation, it suggests that short-term momentum could shift upwards. Similarly, on the daily chart, although the Stochastic is deeply oversold, the RSI at 27.48 is also signaling extreme selling pressure. Historically, when RSI dips this low, it often precedes a significant price recovery, even if it takes time to materialize. The fact that the price is currently near these deeply oversold levels suggests that the selling exhaustion might be approaching, creating a potential dip-buying opportunity for those with a longer-term perspective.
The macroeconomic backdrop, while currently favoring the dollar, could shift. Any sign of cooling inflation, a dovish pivot from central banks, or a sudden increase in geopolitical tensions could drive investors back to precious metals as safe-haven assets. While the current DXY strength is a headwind, persistent inflation concerns or unexpected economic slowdowns could undermine the dollar's appeal. Furthermore, news regarding specific supply chain disruptions or major geopolitical flare-ups could independently boost silver prices, overriding typical dollar correlations. The market is dynamic, and a shift in global sentiment or economic data could quickly alter the landscape, providing the catalyst bulls are waiting for. The recent news about the US dollar breaking key Fibonacci barriers and setting the stage for a 'bigger battle' suggests that the dollar's dominance might face challenges, potentially benefiting silver.
The Verdict: A Bearish Bias with Cautionary Notes
Analyzing the current technical landscape for XAGUSD, the scales tip decidedly in favor of the bears, but with significant caveats that demand caution. The daily chart paints a picture of a well-established downtrend, reinforced by strong ADX readings (42.22) and negative MACD momentum. The persistent downward pressure across multiple timeframes, coupled with the strengthening Dollar Index (DXY at 101.47), creates a challenging environment for any immediate bullish recovery. The current price of $56.59 is teetering on the edge of critical support levels identified at $56.67 (4H) and $56.43 (1D). A break below these levels would likely accelerate the downtrend, targeting further downside.
However, the deeply oversold conditions indicated by the Stochastic Oscillator on the daily chart (K=10.64, D=23.15) cannot be ignored. This suggests that the selling pressure might be reaching an extreme, potentially setting the stage for a short-term bounce or consolidation. The 4-hour chart's Stochastic signal (K=52.94, D=33.42) also hints at a potential upward move, though its reliability is diminished by the overarching strong downtrend. Therefore, while the primary outlook remains bearish, traders should remain vigilant for signs of capitulation or a shift in momentum. Confirmation of a sustained move above the 1-hour resistance at $56.91 would be the first step for any bullish argument, with a decisive close above the 4-hour resistance at $58.32 being a more significant signal of a potential trend change.
The current market sentiment, as reflected in the overwhelming 'SELL' signals across shorter timeframes, suggests that immediate opportunities lie in shorting silver on rallies towards resistance levels, particularly if they fail to break decisively. The strong ADX values across all timeframes confirm that the trend is currently in control. However, the extreme oversold readings on longer timeframes warrant a degree of caution. A failure to break support could lead to a sharp reversal, catching short-sellers off guard. Therefore, risk management is paramount. Traders should consider tighter stop-losses and look for clear confirmation before entering positions, especially as silver tests these crucial support zones. The battle at $56.59 is far from over, but the current technical picture favors the bears, albeit with a watchful eye on potential oversold bounces.
Bearish Scenario: Downside Momentum Dominates
65% ProbabilityNeutral Scenario: Consolidation Around $56.59
25% ProbabilityBullish Scenario: Rebound from Oversold Levels
10% ProbabilityFrequently Asked Questions: XAGUSD Analysis
What happens if XAGUSD breaks below the $56.43 daily support level?
A decisive break below $56.43 on the daily chart would likely confirm the continuation of the downtrend. This could trigger stop-loss orders, accelerating the move towards the next significant support at $55.04, as indicated by the daily timeframe analysis.
Is the current RSI reading of 39.87 on the 1H chart a sell signal for XAGUSD?
An RSI of 39.87 on the 1H chart is in the neutral zone but leans towards bearish momentum, aligning with the overall downtrend. While not an immediate sell signal, it suggests that upward momentum is weak and further downside is more probable than a sharp reversal.
How will the strengthening DXY at 101.47 affect XAGUSD's price action this week?
The strengthening Dollar Index (DXY) at 101.47 typically exerts downward pressure on silver prices due to their inverse relationship. This correlation suggests that as long as the dollar remains firm, XAGUSD may struggle to find bullish footing and could face continued selling pressure.
Should I consider buying XAGUSD at current levels around $56.59 given the oversold Stochastic on the daily chart?
Buying at current levels around $56.59 based solely on the oversold Stochastic is a high-risk strategy, given the strong daily downtrend (ADX 42.22). While a bounce is possible, confirmation of a trend reversal or a clear test and hold of daily support at $56.43 would be prudent before considering such a trade.
Track markets in real-time
AI-powered analysis, technical indicators and real-time price data.
Join Our Telegram Channel
Breaking market news, AI analysis and trading signals instantly.
Join Channel