Gold, or XAUUSD, is currently perched at a pivotal $4,026.68, a level that has become a focal point for traders navigating a complex technical landscape. The precious metal has been experiencing a period of consolidation, but the underlying signals are beginning to paint a more cautious picture, particularly when examining the Relative Strength Index (RSI) across various timeframes. While the 1-hour chart hints at potential upward momentum, the longer-term 4-hour and daily charts present a decidedly bearish outlook, with strong trend strength indicators and a prevailing downward bias. This divergence between short-term signals and longer-term trends creates a critical inflection point, demanding close attention from investors and traders alike as they assess the immediate future of this key asset.
- The RSI at 67.36 on the 1-hour chart signals overbought pressure, while the daily RSI at 32.69 indicates oversold conditions, creating a divergence.
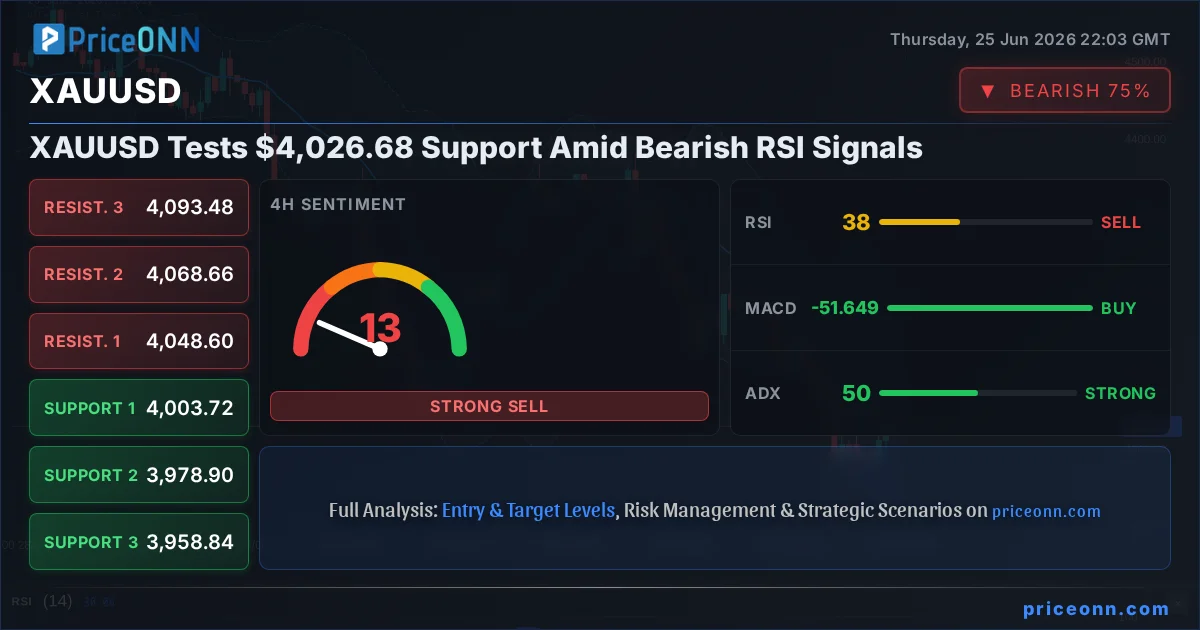
- Critical support for XAUUSD sits at $4,025.72, tested multiple times in the 1-hour timeframe, with further levels at $4,016.84 and $4,007.70.
- The ADX on the 4-hour chart is at 50.67, signaling a very strong downtrend, contradicting the short-term bullish signals from MACD and Stochastic.
- Correlation analysis shows the Dollar Index (DXY) at 101.51, with a strong 4-hour uptrend, potentially exerting downward pressure on gold.
The intricate dance between short-term optimism and long-term bearish signals on the XAUUSD chart is becoming increasingly pronounced. On the 1-hour timeframe, the setup appears somewhat constructive. The RSI, while elevated at 53.73, suggests a neutral-to-slightly bullish inclination, indicating that momentum isn't yet exhausted on the upside. Complementing this, the MACD is showing positive momentum, trading above its signal line, and the Bollinger Bands are hugging the middle band, hinting at a potential continuation of the recent upward nudge. The Stochastic oscillator, with K at 82.95 and D at 78.75, also leans towards the bullish side, suggesting that buyers are still in the driver's seat in this very short-term view. The ADX at 29.7 indicates a moderately strong trend is in play, and the overall signal aggregation leans towards a 'BUY' in this immediate, intraday perspective. However, this optimistic view is fragile and confined to the very near term.
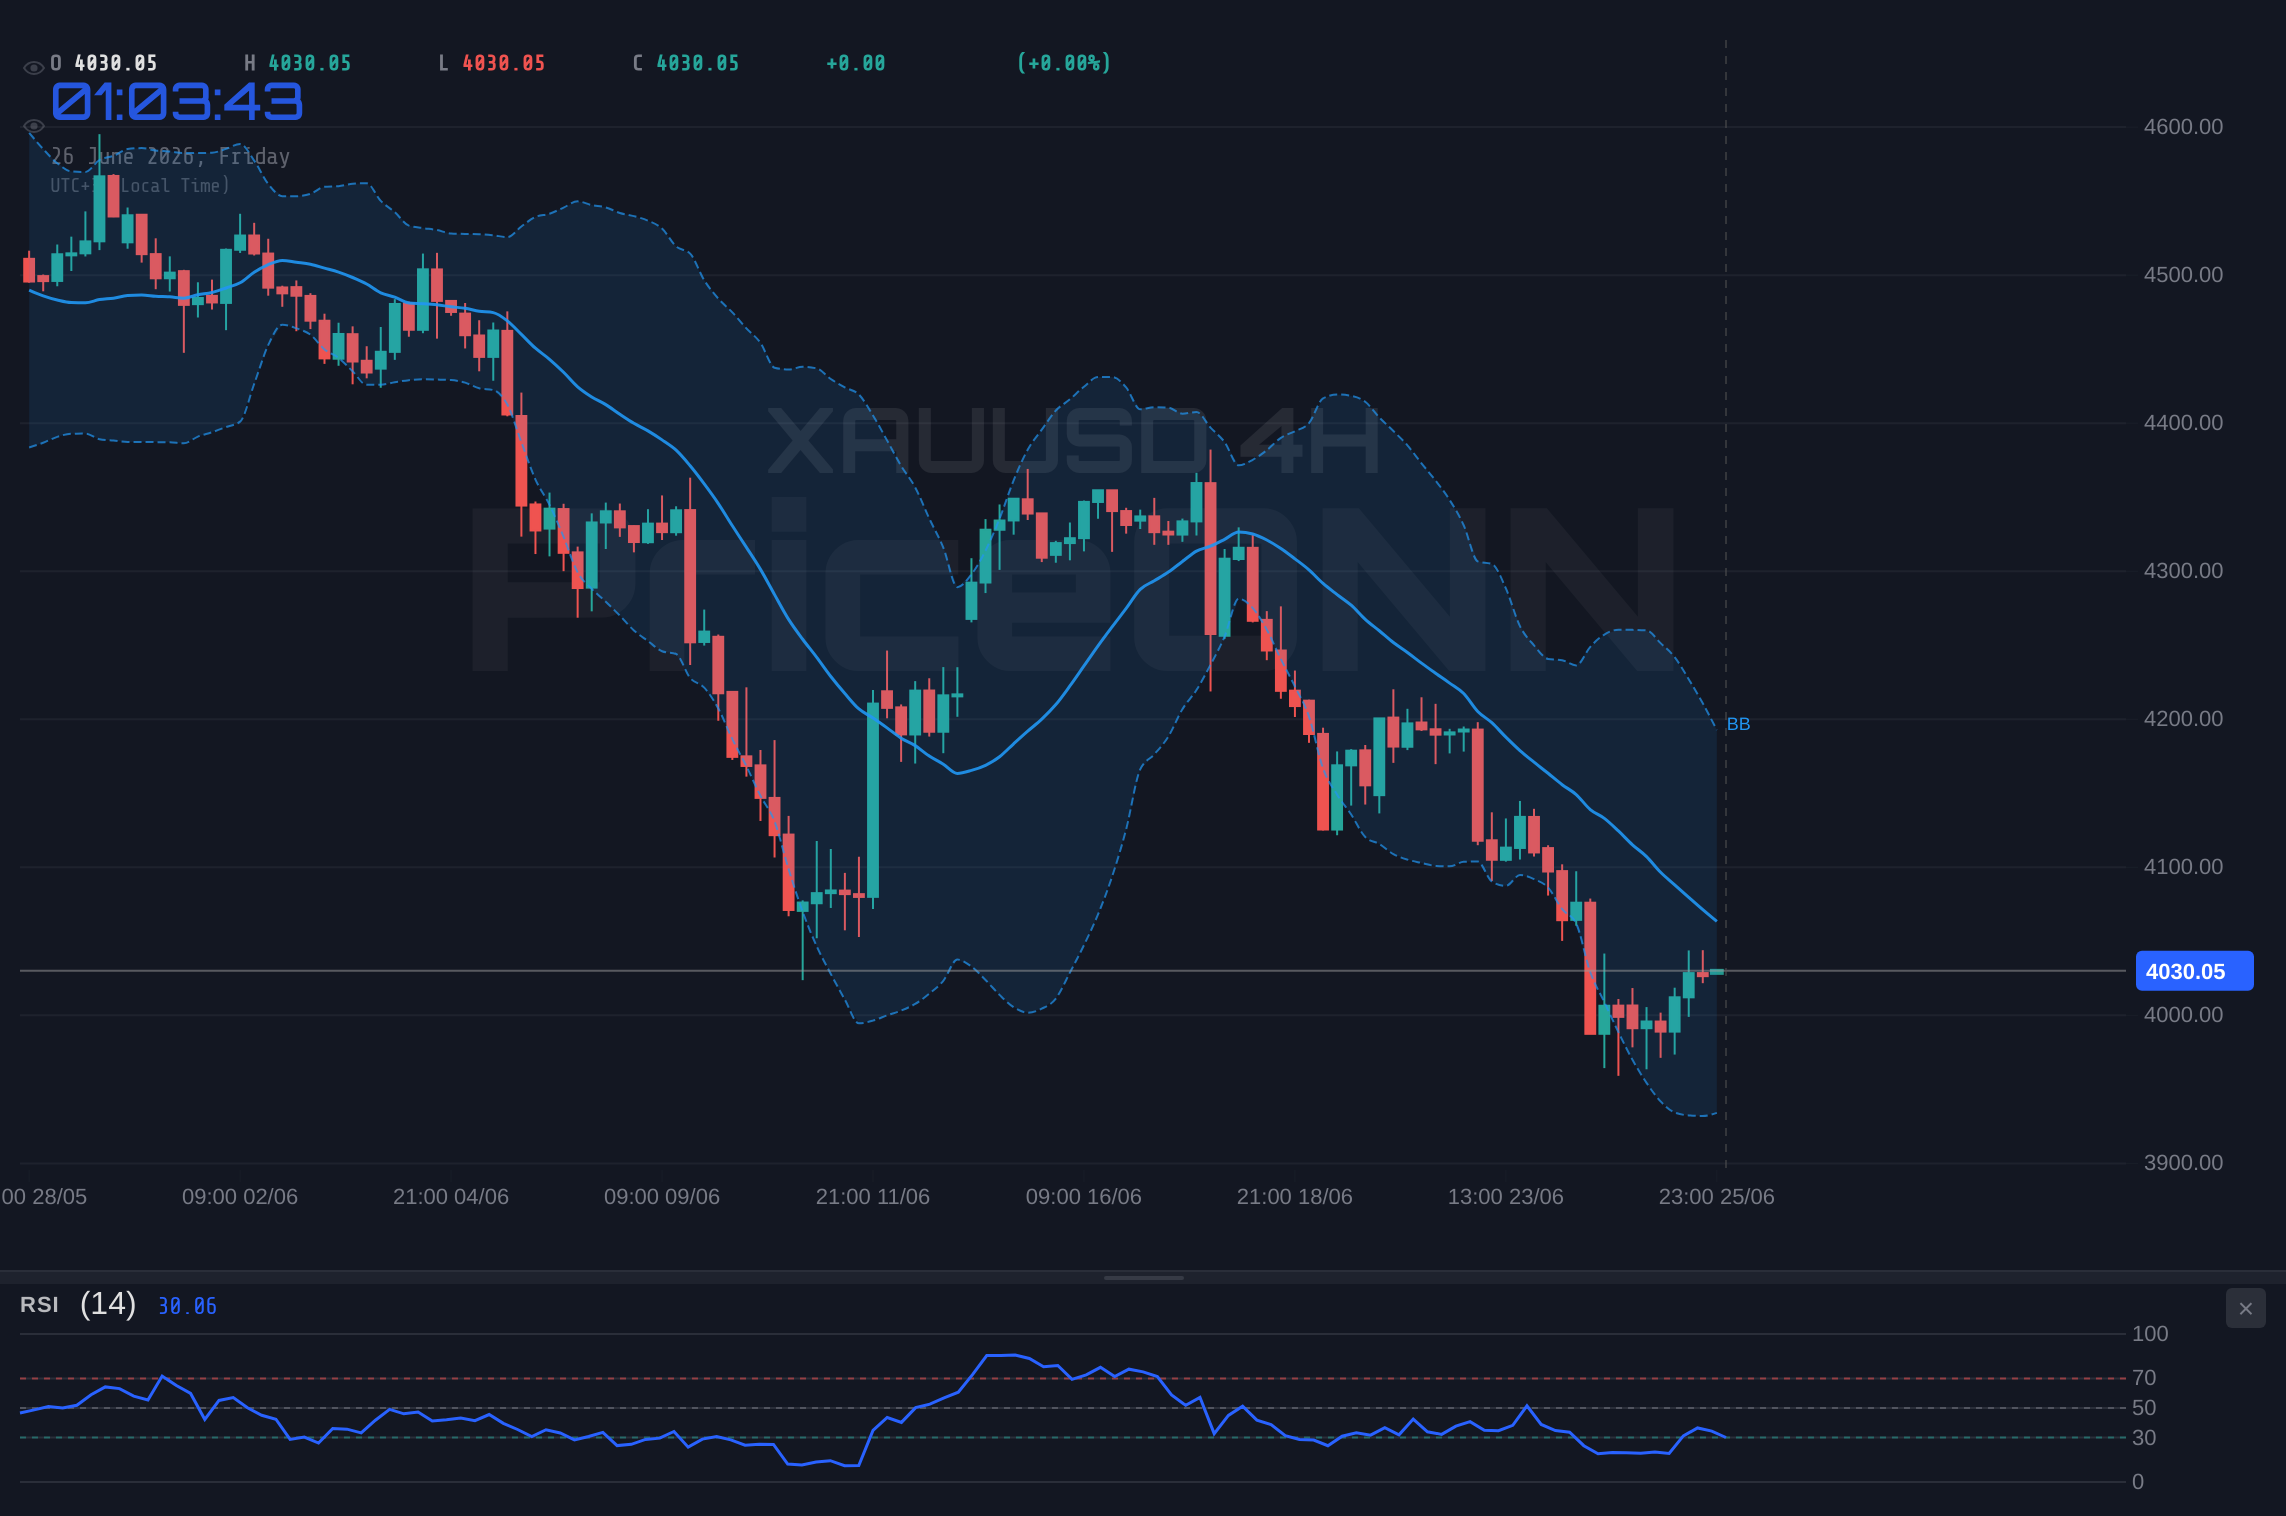
Now, let's pivot to the 4-hour chart, where the narrative takes a decidedly more somber turn for gold bulls. The trend here is classified as 'Downtrend' with an overwhelming strength of 95%. This is not a mere suggestion; it's a strong indication that the larger market forces are pushing prices lower. The RSI at 37.45, while not yet in deep oversold territory, is clearly trending downwards, reinforcing the bearish sentiment. The MACD is firmly in negative territory, with the MACD line below its signal line, confirming bearish momentum. Bollinger Bands are comfortably below the middle band, indicating price weakness. Even the Stochastic oscillator, which showed a bullish signal on the 1-hour chart, here presents a bearish signal with K at 35.06 and D at 22.48, indicating a potential for further downside. The ADX reading of 50.67 is particularly alarming; it signifies a 'Very Strong Downtrend.' This robust trend strength, combined with a predominantly 'SELL' signal aggregation (1 Sell, 7 Neutral/Sell signals), paints a starkly different picture from the 1-hour timeframe, suggesting that the short-term bullish flickers are likely to be swallowed by the dominant downtrend.
Scaling out to the daily chart, the bearish thesis for XAUUSD solidifies further, painting a picture of significant downside risk. The trend is unequivocally 'Downtrend' with an almost absolute strength of 96%. This long-term perspective is crucial; it implies that the prevailing market sentiment is firmly against gold's appreciation. The RSI at 32.69 is deep in the neutral zone, trending downwards, and signaling that there is substantial room for prices to fall before entering oversold territory. The MACD continues its negative trajectory, with the histogram below the signal line, confirming persistent selling pressure. Bollinger Bands are also well below the middle band, a classic sign of a strong downtrend. The Stochastic oscillator here provides a clear bearish signal, with K at 16.48 and D at 37.61, indicating that the downward momentum is accelerating. The ADX at 41 confirms a 'Strong Downtrend.' With a 'SELL' signal aggregation across the board (0 Buy, 8 Sell, 0 Neutral), the daily chart emphatically underscores the dominance of sellers in the current gold market environment, suggesting that any short-term rallies are likely to be viewed as selling opportunities by astute market participants.
The current price action at $4,026.68 is therefore occurring at a critical juncture. On the 1-hour chart, we see immediate support at $4,025.72, followed by $4,016.84 and $4,007.70. These levels are where any short-term bullish momentum might find its initial footing or, conversely, where a breakdown could accelerate. However, the overwhelming bearish sentiment from the higher timeframes suggests that a breach of these immediate supports is a significant risk. The immediate resistance on the 1-hour chart lies at $4,043.74, then $4,052.88, and $4,061.76. Breaking through these levels would be necessary for a sustained short-term rally, but the daily trend strength makes this an uphill battle. The fact that the daily chart shows resistance at $4,089.53, $4,180.08, and $4,245.28, while the current price is below the first of these, highlights the substantial overhead supply that could cap any upward moves.
Correlating these movements with the broader market context is essential for a complete picture. The Dollar Index (DXY) is currently trading at 101.51. While the 1-hour timeframe shows a neutral trend, the 4-hour and daily charts both present a strong uptrend with significant power (100% strength). This strengthening dollar, especially on higher timeframes, typically exerts downward pressure on gold prices, as the two often move inversely. The DXY's daily RSI is at 74.42, signaling overbought conditions, which *could* suggest a potential pullback in the dollar itself, offering temporary respite for gold. However, the ADX at 40.13 on the daily DXY chart confirms a strong trend, meaning any dollar pullback might be shallow. The S&P 500 is trading at 6572.87, showing a strong uptrend on the 1-hour and 4-hour charts, but a bearish trend on the daily. This mixed equity picture adds another layer of complexity; a risk-off sentiment, which might be implied by the daily S&P 500 downtrend, would normally support gold as a safe-haven asset. Yet, the strong dollar is currently overpowering this safe-haven bid, a testament to the complex interplay of market forces.
The conflicting signals across different timeframes present a clear dilemma for traders. The 1-hour chart, with its 'AL' (Buy) signal aggregation, might tempt short-term traders to look for quick upside opportunities, perhaps targeting resistance levels around $4,043.74. However, the dominant bearish trends on the 4-hour and daily charts, with their strong 'SAT' (Sell) signals, suggest that any such upward moves are likely to be short-lived and could represent opportunities for sellers to enter at better prices. The ADX values are particularly telling: 29.7 (1H - moderate trend), 50.67 (4H - very strong downtrend), and 41 (1D - strong downtrend). The surge in ADX strength from the 1-hour to the 4-hour chart clearly indicates where the dominant market sentiment lies. This is a classic scenario where short-term noise is being drowned out by a powerful, longer-term trend.
Considering the trade recommendation of 'FULL_TRADE_PLAN' with a score of 4/8, the emphasis is on a strong trend, but with uncertain entry timing due to extreme Stochastic readings. This suggests a cautious approach is warranted, favoring scenarios that align with the dominant trend but acknowledging the potential for short-term fluctuations. The high ADX on the 4-hour and daily charts for XAUUSD (50.67 and 41 respectively) strongly supports a bearish outlook. The RSI divergence – high on 1H (53.73) and low on 1D (32.69) – indicates that while the immediate momentum might be waning, the longer-term picture is still negative.
Navigating the Gold Market: Scenarios and Probabilities
Given the conflicting signals and the strong bearish undertones from higher timeframes, here are three potential scenarios for XAUUSD, each with an assigned probability reflecting the current technical landscape. These scenarios highlight key price levels and potential outcomes for traders looking to position themselves in this volatile market.
Bearish Scenario: Trend Continuation
70% ProbabilityNeutral Scenario: Range-Bound Consolidation
20% ProbabilityBullish Scenario: Short-Term Reversal Attempt
10% ProbabilityThe Crucial Role of the Daily RSI Divergence
The stark contrast between the daily RSI (32.69) and the 1-hour RSI (53.73) cannot be overstated. This divergence is a classic warning sign. While the short-term momentum may appear neutral to slightly positive, the longer-term picture suggests that underlying selling pressure is building. The daily RSI approaching oversold territory (below 30) often precedes a significant bounce. However, with the ADX on the daily chart at 41 indicating a strong downtrend, this bounce might be shallow or simply a temporary pause before further declines. Traders must remain vigilant, as this divergence could signal a weakening of the current downtrend, but it needs confirmation from price action and other indicators before a sustainable reversal can be called. The current price of $4,026.68 is key; a failure to hold this level could invalidate any nascent bullish argument derived from the short-term indicators.
Market Correlation: DXY and Equity Influence
The Dollar Index (DXY) at 101.51, with its strong uptrend on the 4-hour and daily charts (ADX 60.67 and 40.13 respectively), presents a significant headwind for gold. Historically, a strengthening dollar often leads to a weakening gold price, as gold becomes more expensive for holders of other currencies. While the DXY's daily RSI is in overbought territory (74.42), suggesting a potential for a dollar correction, the robust trend strength indicated by the ADX means any such correction might be brief. The S&P 500's daily chart showing a downtrend adds another layer of complexity. Typically, a risk-off environment indicated by falling equities would boost gold as a safe-haven asset. However, the dominant dollar strength appears to be overriding this safe-haven bid for now. This dynamic suggests that even if equities experience further selling pressure, gold might not benefit as much as expected if the dollar continues its upward trajectory.
The energy markets, represented by Brent crude at $74.97 and WTI at $72.03, are showing significant daily gains (2.29% and 2.35% respectively). This rise in oil prices, driven by geopolitical tensions or supply concerns, can indirectly influence gold. Higher energy prices can fuel inflation expectations, which traditionally makes gold an attractive hedge. However, the current market seems to be prioritizing dollar strength over inflation hedges. The fact that oil is rallying while gold is struggling to maintain its footing despite a bearish daily RSI suggests that the dollar's influence is currently paramount, overshadowing other traditional drivers for precious metals. This interplay highlights the need for a multi-faceted analysis, considering not just gold's internal technicals but also its correlations with major market drivers like the dollar and risk sentiment.
Strategizing for the Gold Market: What the Data Tells Us
The technical picture for XAUUSD is decidedly mixed, leaning bearish on higher timeframes. The 1-hour chart offers a glimmer of hope for short-term traders, but the overwhelming evidence from the 4-hour and daily charts points towards continued downside pressure. The ADX values are particularly instructive: a sharp increase from 29.7 on the 1H to over 50 on the 4H signifies a powerful shift in trend strength. This suggests that any short-term rallies are likely to be met with selling pressure as the dominant downtrend reasserts itself. The RSI divergence is a key signal to watch; a daily RSI of 32.69, while not yet oversold, is approaching levels that have historically offered buying opportunities. However, the strong downtrend indicated by the ADX means that these oversold conditions could persist longer than usual.
For traders considering positions, the $4,025.72 level on the 1-hour chart is the immediate level to watch. A break below this could accelerate the move towards $4,016.84 and $4,007.70. Conversely, for a bullish thesis to gain traction, XAUUSD would need to convincingly break above the 1-hour resistance at $4,043.74, and ideally, show signs of stabilization above $4,050. The daily chart resistance at $4,089.53 looms large, and breaching this level would require a significant shift in market sentiment, likely driven by a weakening dollar or a surge in safe-haven demand fueled by geopolitical events. Given the current data, the probabilities heavily favor the bearish scenario, but the market's tendency for sharp reversals, especially when indicators reach extreme levels, means that vigilance is key.
Frequently Asked Questions: XAUUSD Analysis
What happens if XAUUSD breaks below the $4,025.72 support level?
If XAUUSD breaks decisively below the $4,025.72 support on the 1-hour chart, the bearish trend is likely to accelerate. The next immediate targets would be $4,016.84 and then $4,007.70, as indicated by the technical data. This breakdown would confirm the dominance of the longer-term downtrend observed on the 4-hour and daily charts.
Is the RSI at 67.36 on the 1-hour chart a sell signal for XAUUSD at $4,026.68?
An RSI reading of 67.36 on the 1-hour chart suggests near-term overbought conditions, which can precede a pullback or consolidation. However, it is not a direct sell signal on its own, especially with the daily RSI at a much lower 32.69. Traders should look for confirmation, such as bearish price action or a MACD cross below its signal line, before acting solely on this RSI level.
How does the strong uptrend in the Dollar Index (DXY) at 101.51 affect XAUUSD?
The strong uptrend in the DXY, particularly on the 4-hour and daily charts, typically exerts downward pressure on XAUUSD. A stronger dollar makes gold more expensive for holders of other currencies, potentially reducing demand. While the DXY is nearing overbought levels, its current trend strength suggests it could continue to weigh on gold prices in the short to medium term.
Should I consider buying XAUUSD at current levels of $4,026.68 given the mixed signals?
Given the conflicting signals and the dominant bearish trend on higher timeframes, buying XAUUSD at $4,026.68 carries significant risk. The 70% probability scenario favors further downside. A more prudent approach might be to wait for a confirmed break below support levels for shorting opportunities, or wait for a decisive break above $4,043.74 with strong confirmation before considering long positions.
| Indicator | Value | Signal | Interpretation |
|---|---|---|---|
| RSI (14) | 53.73 (1H) / 37.45 (4H) / 32.69 (1D) | Neutral (1H)Bearish (4H)Bearish (1D) | Divergence present; short-term neutral, longer-term bearish. |
| MACD | Positive (1H) / Negative (4H) / Negative (1D) | Bullish (1H)Bearish (4H)Bearish (1D) | Short-term momentum positive, but higher timeframes confirm selling pressure. |
| Stochastic | K=82.95, D=78.75 (1H) / K=35.06, D=22.48 (4H) / K=16.48, D=37.61 (1D) | Bullish (1H)Bullish (4H)Bearish (1D) | Mixed signals; extreme levels on 1D suggest potential reversal but trend is dominant. |
| ADX | 29.7 (1H) / 50.67 (4H) / 41 (1D) | Moderate Trend (1H)Very Strong Downtrend (4H)Strong Downtrend (1D) | Trend strength increases significantly on higher timeframes, favoring sellers. |
| Bollinger Bands | Mid Band (1H) / Below Mid Band (4H) / Below Mid Band (1D) | Neutral (1H)Bearish (4H)Bearish (1D) | Price action respecting middle band on 1H, but firmly below on higher timeframes. |
The conflicting signals across timeframes present a complex trading environment for XAUUSD. While the 1-hour chart shows some resilience around the $4,025.72 mark, the dominant bearish trend on the 4-hour and daily charts, confirmed by strong ADX readings and negative MACD momentum, suggests that any upside move is likely to face significant resistance. The current price of $4,026.68 sits precariously close to immediate support, and a break below it could signal a swift move towards lower levels. Traders should exercise caution, favoring short positions on pullbacks or waiting for a clear breakout above the $4,043.74 resistance with substantial confirmation before considering long trades.
Track markets in real-time
AI-powered analysis, technical indicators and real-time price data.
Join Our Telegram Channel
Breaking market news, AI analysis and trading signals instantly.
Join Channel