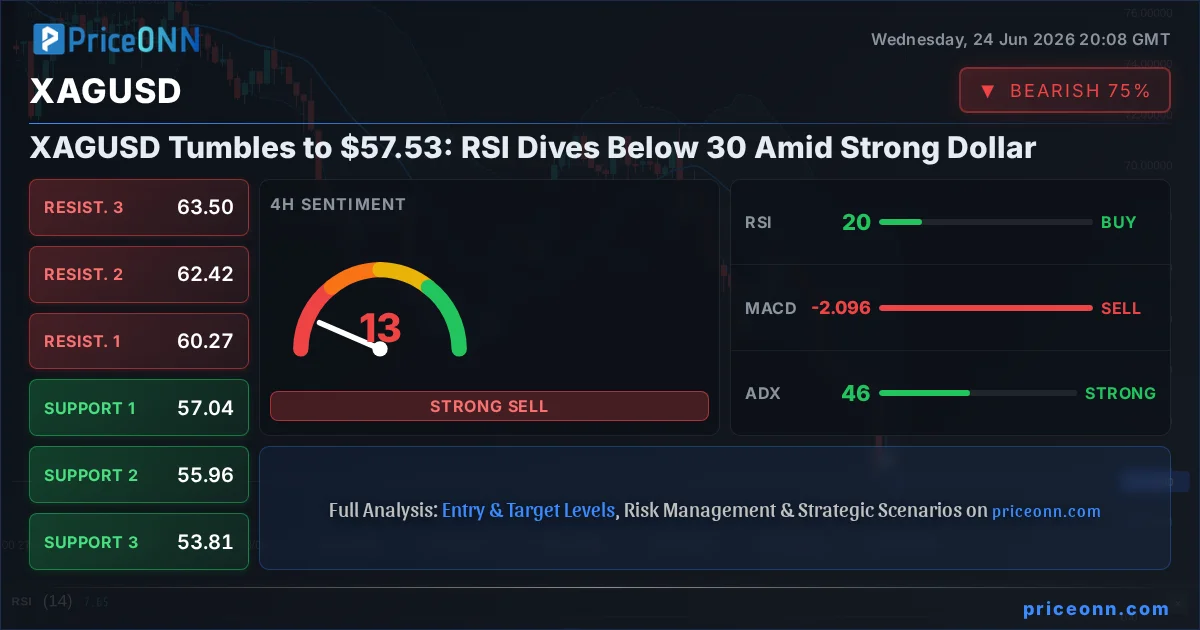
Is Silver poised for a rebound or is the sell-off set to continue? The precious metal, XAGUSD, is currently trading precariously close to the $57.53 mark, having experienced a significant downturn. The RSI on the 4-hour chart has plunged to 28.46, signaling oversold conditions, while the broader market sentiment appears to be favoring a stronger US Dollar. This confluence of factors presents a critical juncture for silver, demanding a deep dive into the underlying drivers and potential future scenarios.
- Silver's 4-hour RSI has fallen to 28.46, indicating extreme oversold conditions.
- The current price of $57.53 is testing key support levels, with $55.78 eyed as the next significant floor.
- A strong US Dollar Index (DXY) at 101.66 is exerting downward pressure on XAGUSD, a common correlation.
- Geopolitical tensions are subdued, reducing the safe-haven appeal that typically supports precious metals.
The sharp decline in XAGUSD, exacerbated by a -6.49% daily change, brings the price down to $57.53. This move is not occurring in a vacuum. The Dollar Index (DXY) has seen a notable uptick, currently standing at 101.66. This inverse relationship between the dollar and silver is a well-established market dynamic; as the dollar strengthens, typically other dollar-denominated assets, like silver, become more expensive for holders of other currencies, thus dampening demand. The DXY's ascent is being fueled by a combination of factors, including a general risk-off sentiment gripping global markets and expectations surrounding future central bank policies, particularly from the Federal Reserve.
Delving into the technical indicators, the picture for XAGUSD is undeniably bearish across multiple timeframes, yet flashing signs of potential capitulation. On the 1-hour chart, the trend is firmly entrenched in a downtrend with 100% strength, and the ADX at 53.9 confirms a very strong bearish trend. The RSI(14) at 37.58, while in neutral territory, shows a downward inclination, and the MACD is firmly below its signal line, painting a picture of seller dominance. Support levels at 55.78 and 54.88 are now within reach if the current momentum persists. However, the stochastic indicator is nearing oversold territory, hinting that the selling pressure might be exhausting itself in the short term.
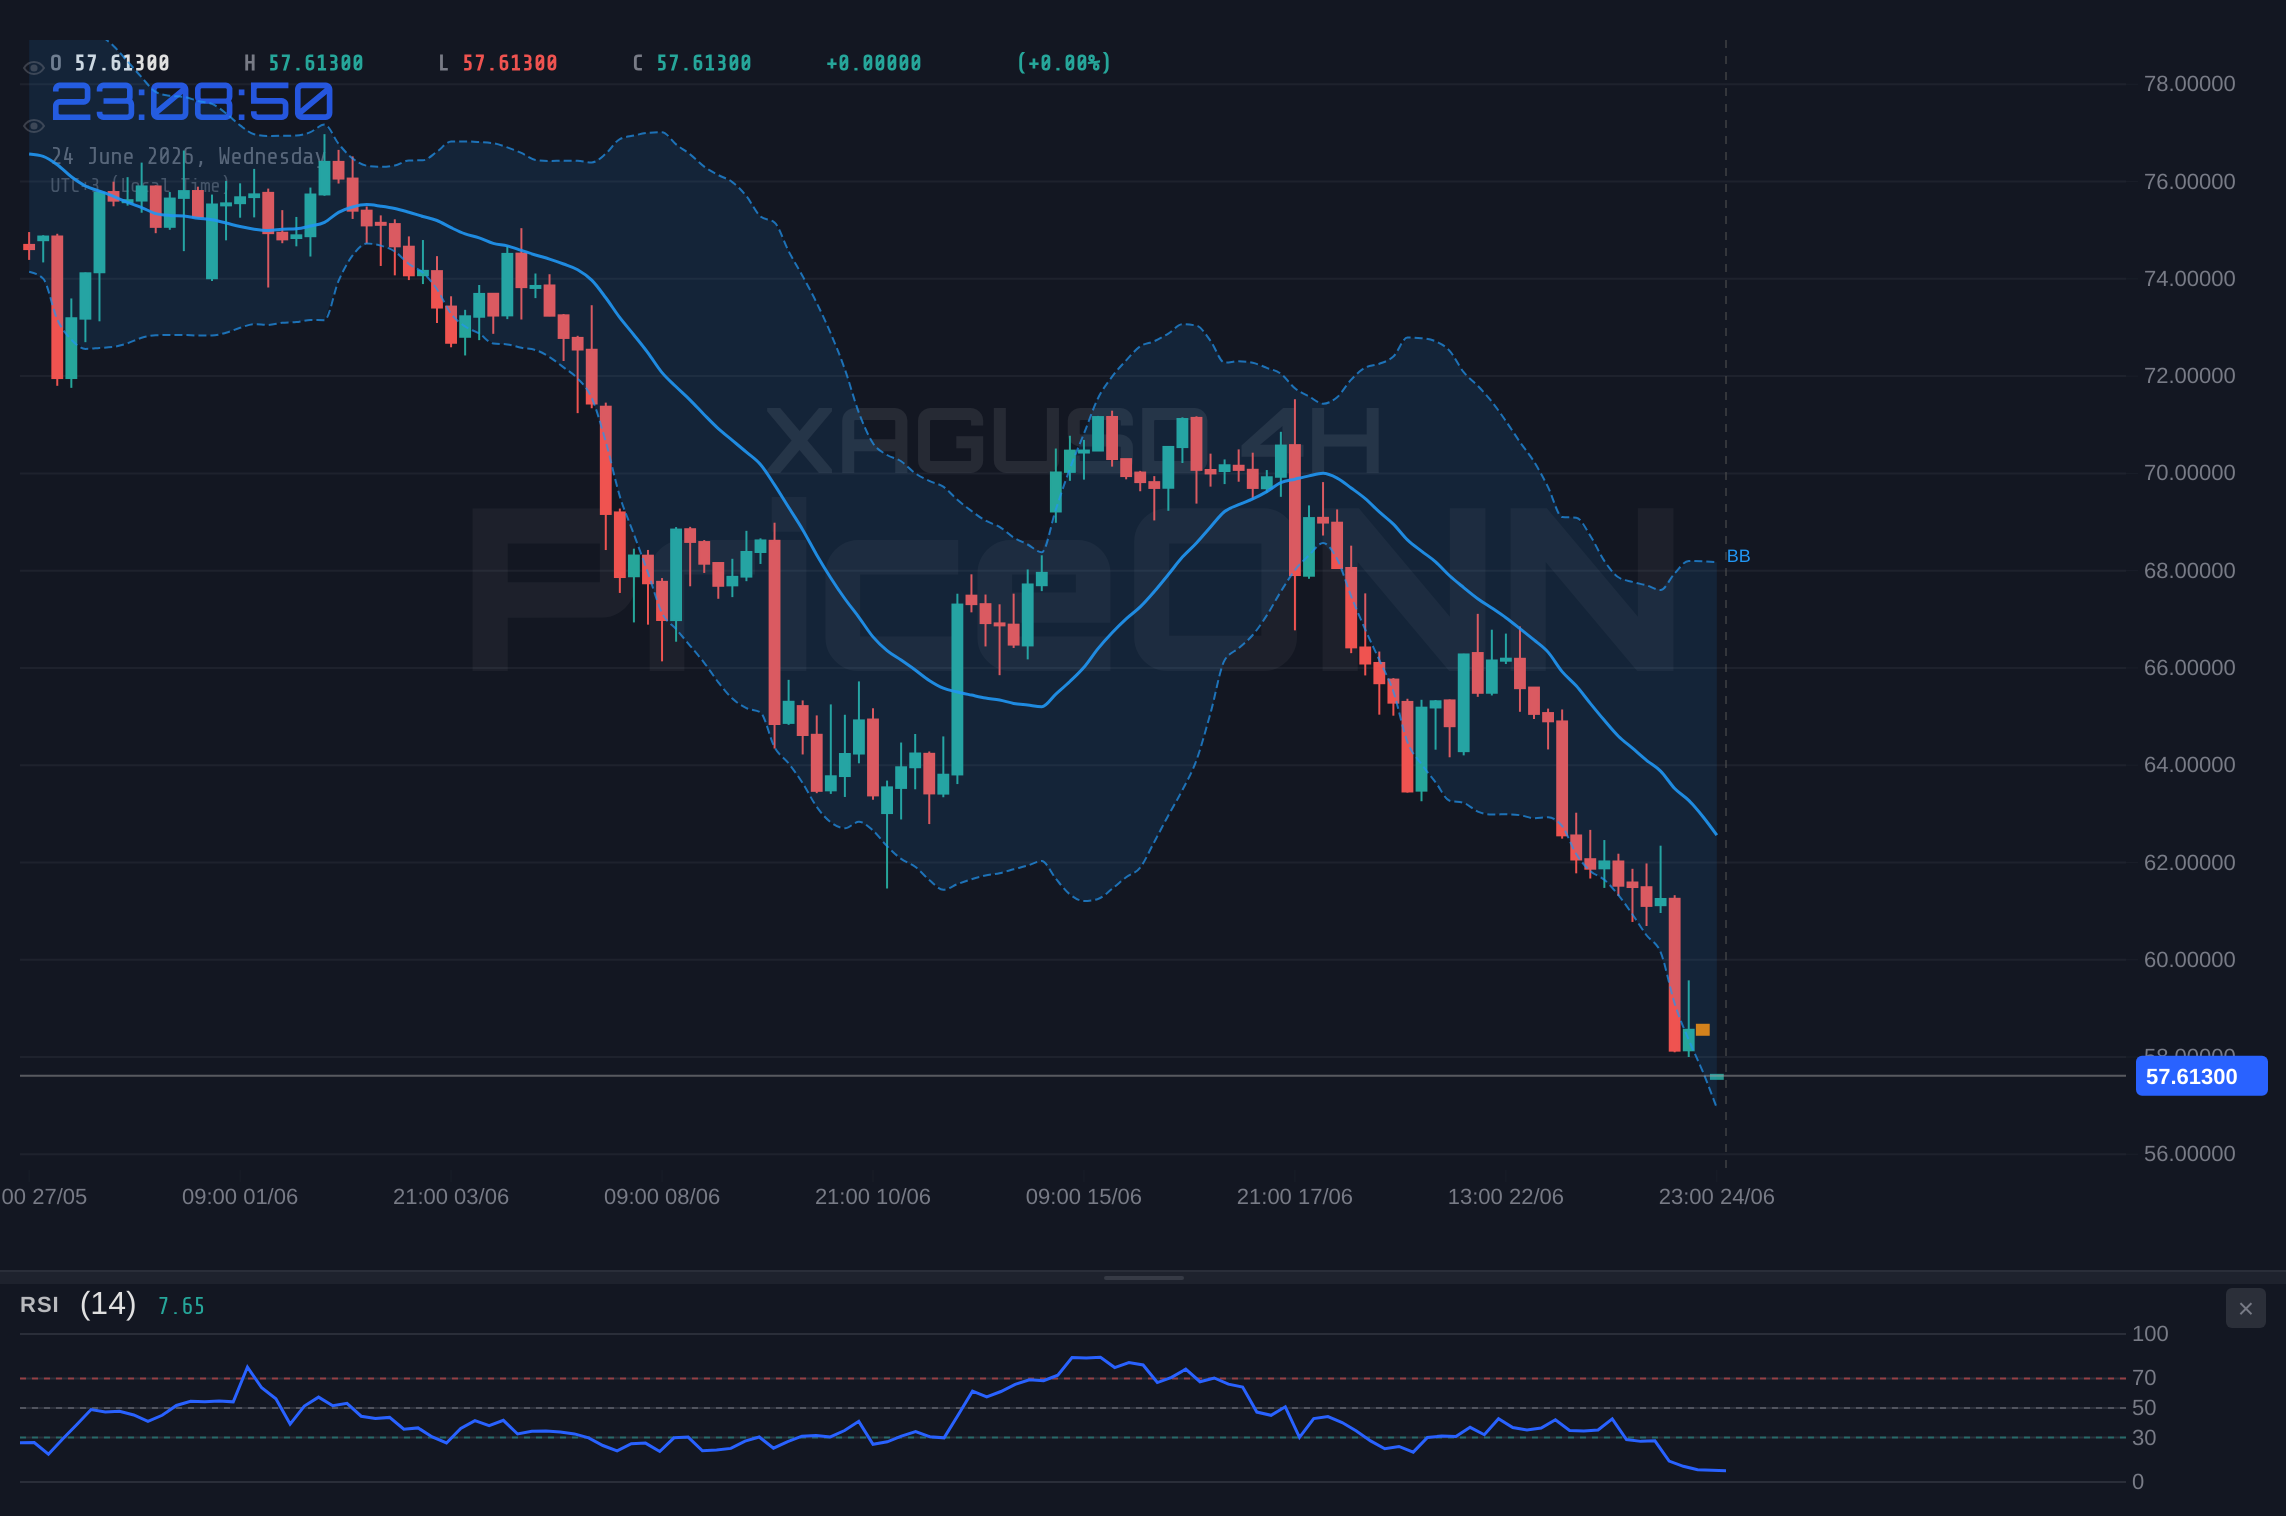
The 4-hour timeframe amplifies the bearish narrative, with the trend strength still at a formidable 100% and ADX reading 46.04, indicating a strong downtrend. Here, the RSI(14) at 28.46 is deeply entrenched in oversold territory, a level that has historically offered buying opportunities for silver. The MACD continues to show negative momentum, and the Bollinger Bands are hugging the lower band, suggesting extreme selling pressure. The stochastic K and D lines are at 12.63 and 15.14 respectively, firmly in oversold conditions. This suggests that while the trend is strongly down, the price may be due for a short-term bounce or consolidation as sellers potentially pause to take profits.
On the daily chart, the bearish trend remains dominant with 95% strength and an ADX of 39.68. The RSI(14) sits at 30.54, bordering on oversold conditions and indicating that the downside momentum might be losing some of its ferocity. The MACD continues to signal weakness, and the stochastic lines (K=26.91, D=44.44) are trending downwards but not yet in deeply oversold territory. The key support level to watch on the daily chart is 40.67.88, followed by 40.25.72. The current price of $57.53 is significantly above these levels, but the steep decline suggests that these areas could be tested if the selling pressure continues unabated. The overall signal across all timeframes is overwhelmingly 'SELL,' but the deeply oversold readings on the 4-hour chart warrant attention for potential short-term reversals.
The Bear's Grip: Why Silver Is Falling
Several fundamental factors are contributing to the sharp decline in XAGUSD. Firstly, the strengthening US Dollar, as evidenced by the DXY's rally to 101.66, is a significant headwind. This strength is partly driven by a shift in market sentiment towards risk aversion. The pullback in major equity indices like the S&P 500 (currently at 6572.87, up 0.74% but showing signs of volatility) and Nasdaq (29463.21, up 0.08%) suggests that investors are becoming more cautious. When global risk appetite wanes, investors often flock to perceived safe-haven assets, but paradoxically, the US Dollar often benefits most from this flight to safety, outperforming other safe havens like gold and silver.
Furthermore, the recent economic data releases have played a crucial role. While specific data points for XAGUSD's immediate drivers were not provided in the live feed, the general market commentary points towards concerns about inflation and central bank policy. The euro's fall to a one-year low, partly attributed to oil price drops and dovish signals from the European Central Bank (ECB), indicates a weakening global economic outlook. If major economies are signaling potential easing or struggling with growth, it can reduce industrial demand for silver, impacting its fundamental value. The ECB's recent policy tightening is seen as 'calibrated' rather than aggressive, suggesting a cautious approach that might not be enough to combat underlying economic weakness, further supporting the dollar.
Geopolitical tensions, which often act as a catalyst for precious metal rallies, appear to be relatively subdued at present. News reports indicate easing tensions between the US and Iran, which has helped cool oil prices. While Brent crude is down 4.01% at $73.45 and WTI down 4.07% at $70.58, this de-escalation in perceived geopolitical risk removes a significant prop for silver's safe-haven appeal. Investors are less inclined to seek refuge in precious metals when immediate global threats appear to be receding, allowing other market forces, such as dollar strength and interest rate expectations, to dominate price action.
The technical picture, as discussed, is overwhelmingly bearish. The sustained downtrend across all analyzed timeframes, confirmed by high ADX values and predominantly 'SELL' signals from technical indicators, paints a grim short-term outlook for XAGUSD. The break below key psychological levels and the inability to find firm footing above $60 have likely triggered stop-loss orders, accelerating the downward momentum. The current price of $57.53 is a critical level, and a decisive close below it on a daily basis could open the door to further significant declines towards the 4H support at $57.04, and potentially lower.
The Bull's Hope: Can Silver Find a Floor?
Despite the prevailing bearish sentiment, there are glimmers of hope for silver bulls. The most compelling argument lies in the deeply oversold conditions indicated by the RSI(14) on the 4-hour chart, which has fallen to 28.46. Historically, when silver reaches such low RSI levels, it often precedes a period of consolidation or a short-term reversal as the market overextends to the downside. The stochastic indicator on the same timeframe is also deep in oversold territory (K=12.63, D=15.14), further reinforcing the idea that the selling pressure might be nearing exhaustion.
A potential trigger for a bullish reversal would be a shift in the broader market sentiment. If the US Dollar Index (DXY) begins to falter from its current levels around 101.66, perhaps due to unexpected shifts in Federal Reserve policy expectations or a sudden resurgence of risk appetite in equity markets, silver could find immediate relief. For instance, if the S&P 500 were to regain its footing and decisively break above its intraday resistance, it could signal a broader market recovery, drawing capital away from the dollar and towards riskier assets or commodities like silver.
Another catalyst could be a change in the narrative surrounding inflation and interest rates. If upcoming economic data, such as CPI or NFP reports, suggest that inflation is proving more persistent than previously thought, or if central banks signal a more hawkish stance than anticipated, it could lead to a repricing of interest rate expectations. While higher rates generally pressure non-yielding assets like silver, a perception that rates might stay higher for longer, coupled with fears of an economic slowdown, can sometimes pivot market focus back to inflation hedges, which include precious metals.
Technically, for a bullish scenario to gain traction, XAGUSD would need to break decisively above the immediate resistance level of $57.38 on the 1-hour chart. A sustained move above this point, followed by a hold above the $58.07 resistance, would be the first sign of a potential trend change. Confirmation would come from breaking through the more significant daily resistance at $60.17. If this level is breached and held, the market could see a short-covering rally targeting higher levels, potentially up to the $64.02 mark on the daily chart. However, this would require a significant shift in market dynamics.
The Waiting Game: Consolidation Scenario
Given the conflicting signals – strong bearish trends versus deeply oversold technicals – a period of consolidation or range-bound trading is also a plausible scenario. This could occur if the market awaits a definitive catalyst, such as key economic data releases or central bank commentary, to break the current stalemate. During such a phase, XAGUSD might trade sideways, oscillating between the immediate support and resistance levels.
The 1-hour chart shows immediate resistance at $57.38 and support at $55.78. If the price remains trapped between these levels, it would indicate a lack of conviction from either buyers or sellers. This consolidation phase could be characterized by lower trading volumes and choppy price action, typical of markets on pause. The ADX, despite being high on longer timeframes, might see a dip on the 1-hour chart during consolidation, reflecting a weakening trend. This scenario would likely persist until a significant economic event or a clear break of a major technical level forces a directional move.
For this neutral scenario to play out, key economic events scheduled for the coming week would need to deliver mixed or inconclusive results. For instance, if US inflation data comes in slightly above expectations, but employment figures are weaker than anticipated, it could create uncertainty regarding the Fed's next move. Similarly, dovish signals from the ECB might weaken the dollar slightly, but not enough to spark a strong rally in silver, leading to a tug-of-war. In such an environment, traders might adopt a range-trading strategy, buying near support and selling near resistance, while awaiting a clearer signal.
Probability Assessment: Which Way Will Silver Lean?
Considering the current technical and fundamental landscape, the bearish scenario appears to hold the highest probability in the short to medium term. The dominant trend across all timeframes is strongly bearish, reinforced by high ADX values and predominantly 'SELL' signals. The strengthening US Dollar and the apparent lack of strong geopolitical catalysts provide a challenging environment for precious metals. Therefore, I assign a 65% probability to the bearish scenario continuing, at least until key support levels are tested and potentially broken.
The consolidation scenario carries a moderate probability of 25%. This hinges on the market's current indecision and the anticipation of upcoming economic data. If key upcoming releases, such as crucial inflation reports or central bank minutes, prove to be market-moving without establishing a clear direction, a period of range-bound trading is likely. This would offer tactical trading opportunities but would delay any significant trend resumption.
The bullish scenario, while offering the potential for a significant rebound due to oversold conditions, currently holds the lowest probability at 10%. This scenario would require a substantial shift in market fundamentals – a sharp reversal in the DXY, a sudden escalation of geopolitical risks, or a surprising pivot in central bank policy. Without such a dramatic change, overcoming the strong bearish technicals and prevailing fundamental headwinds will be a significant challenge for silver buyers.
Bearish Scenario: The Downward Spiral Continues
65% ProbabilityNeutral Scenario: Caught in the Crossfire
25% ProbabilityBullish Scenario: A Reversal Beckons?
10% ProbabilityWhat I'm Watching This Week
The coming week will be crucial for XAGUSD. My primary focus will be on the US Dollar Index (DXY). A sustained move above 101.86 could signal further downside for silver, while a failure to hold above 101.55 might offer a reprieve. Secondly, I'll be closely monitoring upcoming inflation data from major economies. Any surprises that alter the interest rate outlook could significantly impact silver's trajectory. Finally, equity market performance, particularly the S&P 500's ability to hold or break key levels, will provide clues about overall risk appetite, which often correlates inversely with silver's safe-haven demand.
Frequently Asked Questions: XAGUSD Analysis
What happens if XAGUSD breaks below $57.53 decisively?
A decisive break and daily close below $57.53 would likely trigger further selling pressure, confirming the bearish scenario. This could lead to a rapid decline towards the 4-hour support at $57.04, and potentially test the next significant floor at $55.78. Such a move would indicate that the market is fully pricing in continued dollar strength and risk aversion.
Is RSI at 28.46 a buy signal for XAGUSD right now?
While an RSI of 28.46 on the 4-hour chart signals oversold conditions, it is not an immediate buy signal in isolation, especially with strong bearish trends in play. It suggests that the downside momentum may be exhausted, increasing the probability of a short-term bounce or consolidation. However, confirmation from price action and a potential pullback in the DXY would be necessary before considering a long position.
How will the upcoming inflation data affect XAGUSD this week?
Upcoming inflation data releases are critical catalysts that could shift the market's view on interest rates. If inflation comes in hotter than expected, it might support the dollar further, pressuring XAGUSD. Conversely, surprisingly weak inflation could lead to expectations of earlier rate cuts, potentially weakening the dollar and offering a tailwind for silver. Traders will be looking for any deviation from forecasts to gauge the central bank's next move.
Should traders consider buying XAGUSD at current levels near $57.53?
Buying at current levels of $57.53 carries significant risk given the strong bearish trend and the potential for further downside. While oversold indicators suggest a potential bounce, the prevailing fundamental factors, particularly dollar strength, are unfavorable. A more prudent approach might be to wait for confirmation of a bottom, such as a break above immediate resistance like $57.38, or a clear shift in the DXY's trend, before considering any long positions.
Track markets in real-time
AI-powered analysis, technical indicators and real-time price data.
Join Our Telegram Channel
Breaking market news, AI analysis and trading signals instantly.
Join Channel