The current market landscape presents a challenging environment for oil traders, with WTI crude oil dipping to $70.62. This move comes not in isolation but as part of a broader market sentiment shift, underscored by a significant drop in Brent crude to $73.54 and the euro's slide to a one-year low against a strengthening dollar. As a seasoned market analyst with a focus on infrastructure and industrial fundamentals, I see these movements as more than just price fluctuations; they are signals reflecting deep-seated economic and geopolitical forces at play. The interplay between energy prices, currency strength, and global risk appetite is particularly acute right now, demanding a close examination of the underlying drivers. This analysis will delve into the technical indicators, fundamental pressures, and correlated market movements that are shaping the trajectory of WTI, offering a perspective grounded in real-world data and market mechanics.
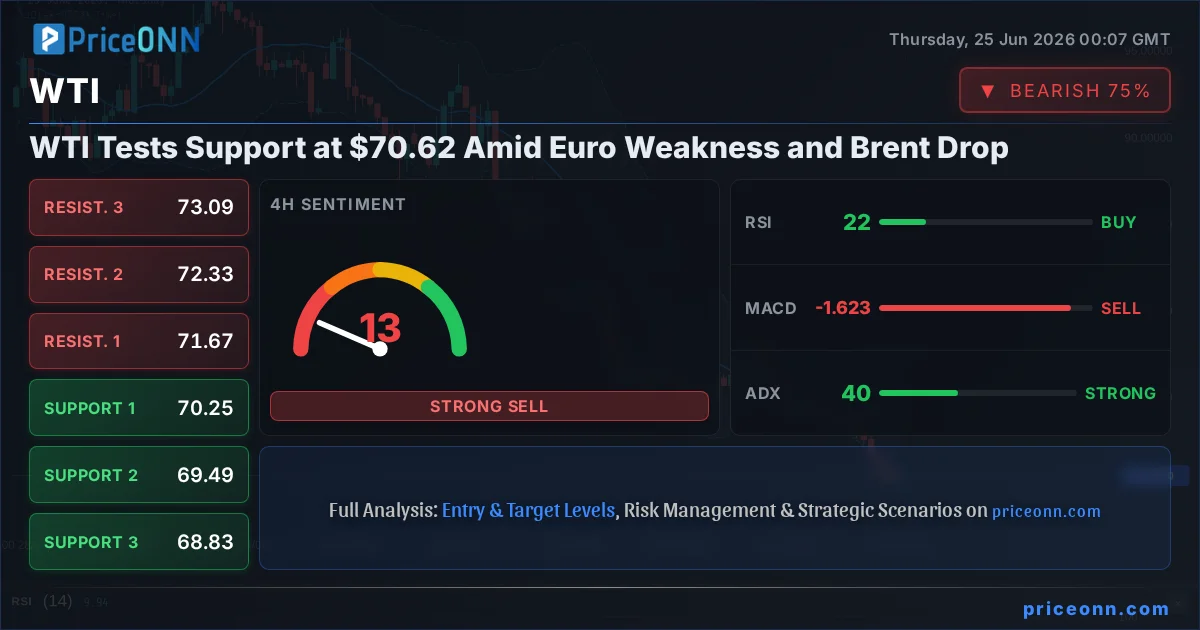
- WTI crude oil is currently trading at $70.62, reflecting a significant daily decline.
- Critical support for WTI is observed around the $70.25 level, with the 1-hour chart showing strong downward momentum.
- The ADX at 41.77 on the 1-hour chart indicates a strong downtrend, suggesting further downside potential.
- Broader market correlations show EURUSD at $1.13537 and Brent crude at $73.54, both under pressure, reinforcing the bearish outlook for WTI.
The immediate price action for WTI crude oil at $70.62 paints a picture of bearish momentum, a narrative echoed across multiple timeframes and related markets. On the 1-hour chart, the trend is unequivocally down, with a strength of 100%. This is corroborated by a cascade of technical indicators. The Relative Strength Index (RSI) at 33.16 hovers in the oversold territory, suggesting that while selling pressure is intense, a short-term bounce might be on the cards if buyers step in. However, the MACD is firmly in negative momentum territory, printing below its signal line, and the Bollinger Bands are showing price trading below the middle band, indicating a bearish bias. The Stochastic Oscillator, with %K at 22.61 and %D at 21.77, is flashing a potential buy signal as %K crosses above %D, but in the context of such strong downward trends, these can often be short-lived counter-trend moves. The ADX, a measure of trend strength, is at a robust 41.77, confirming that the current downtrend is not a mere blip but a firmly established market movement.
Examining the 4-hour timeframe further solidifies this bearish outlook. The trend remains strong at 100% down. The RSI at 22.4 is deep in oversold territory, a level that historically can precede a bounce, but the persistent negative momentum from the MACD and the price sitting below the middle Bollinger Band suggest that the bears are very much in control. The Stochastic, with K at 11.91 and D at 14.46, is also in oversold conditions, reinforcing the idea that the market is heavily weighted to the downside. The ADX here is 39.93, still indicating a strong downtrend. Support levels on this timeframe are identified at $70.25, $69.49, and $68.83. These are the immediate areas where we might see some price reaction, but the prevailing trend suggests they could be tested and potentially broken if the bearish sentiment continues to dominate.
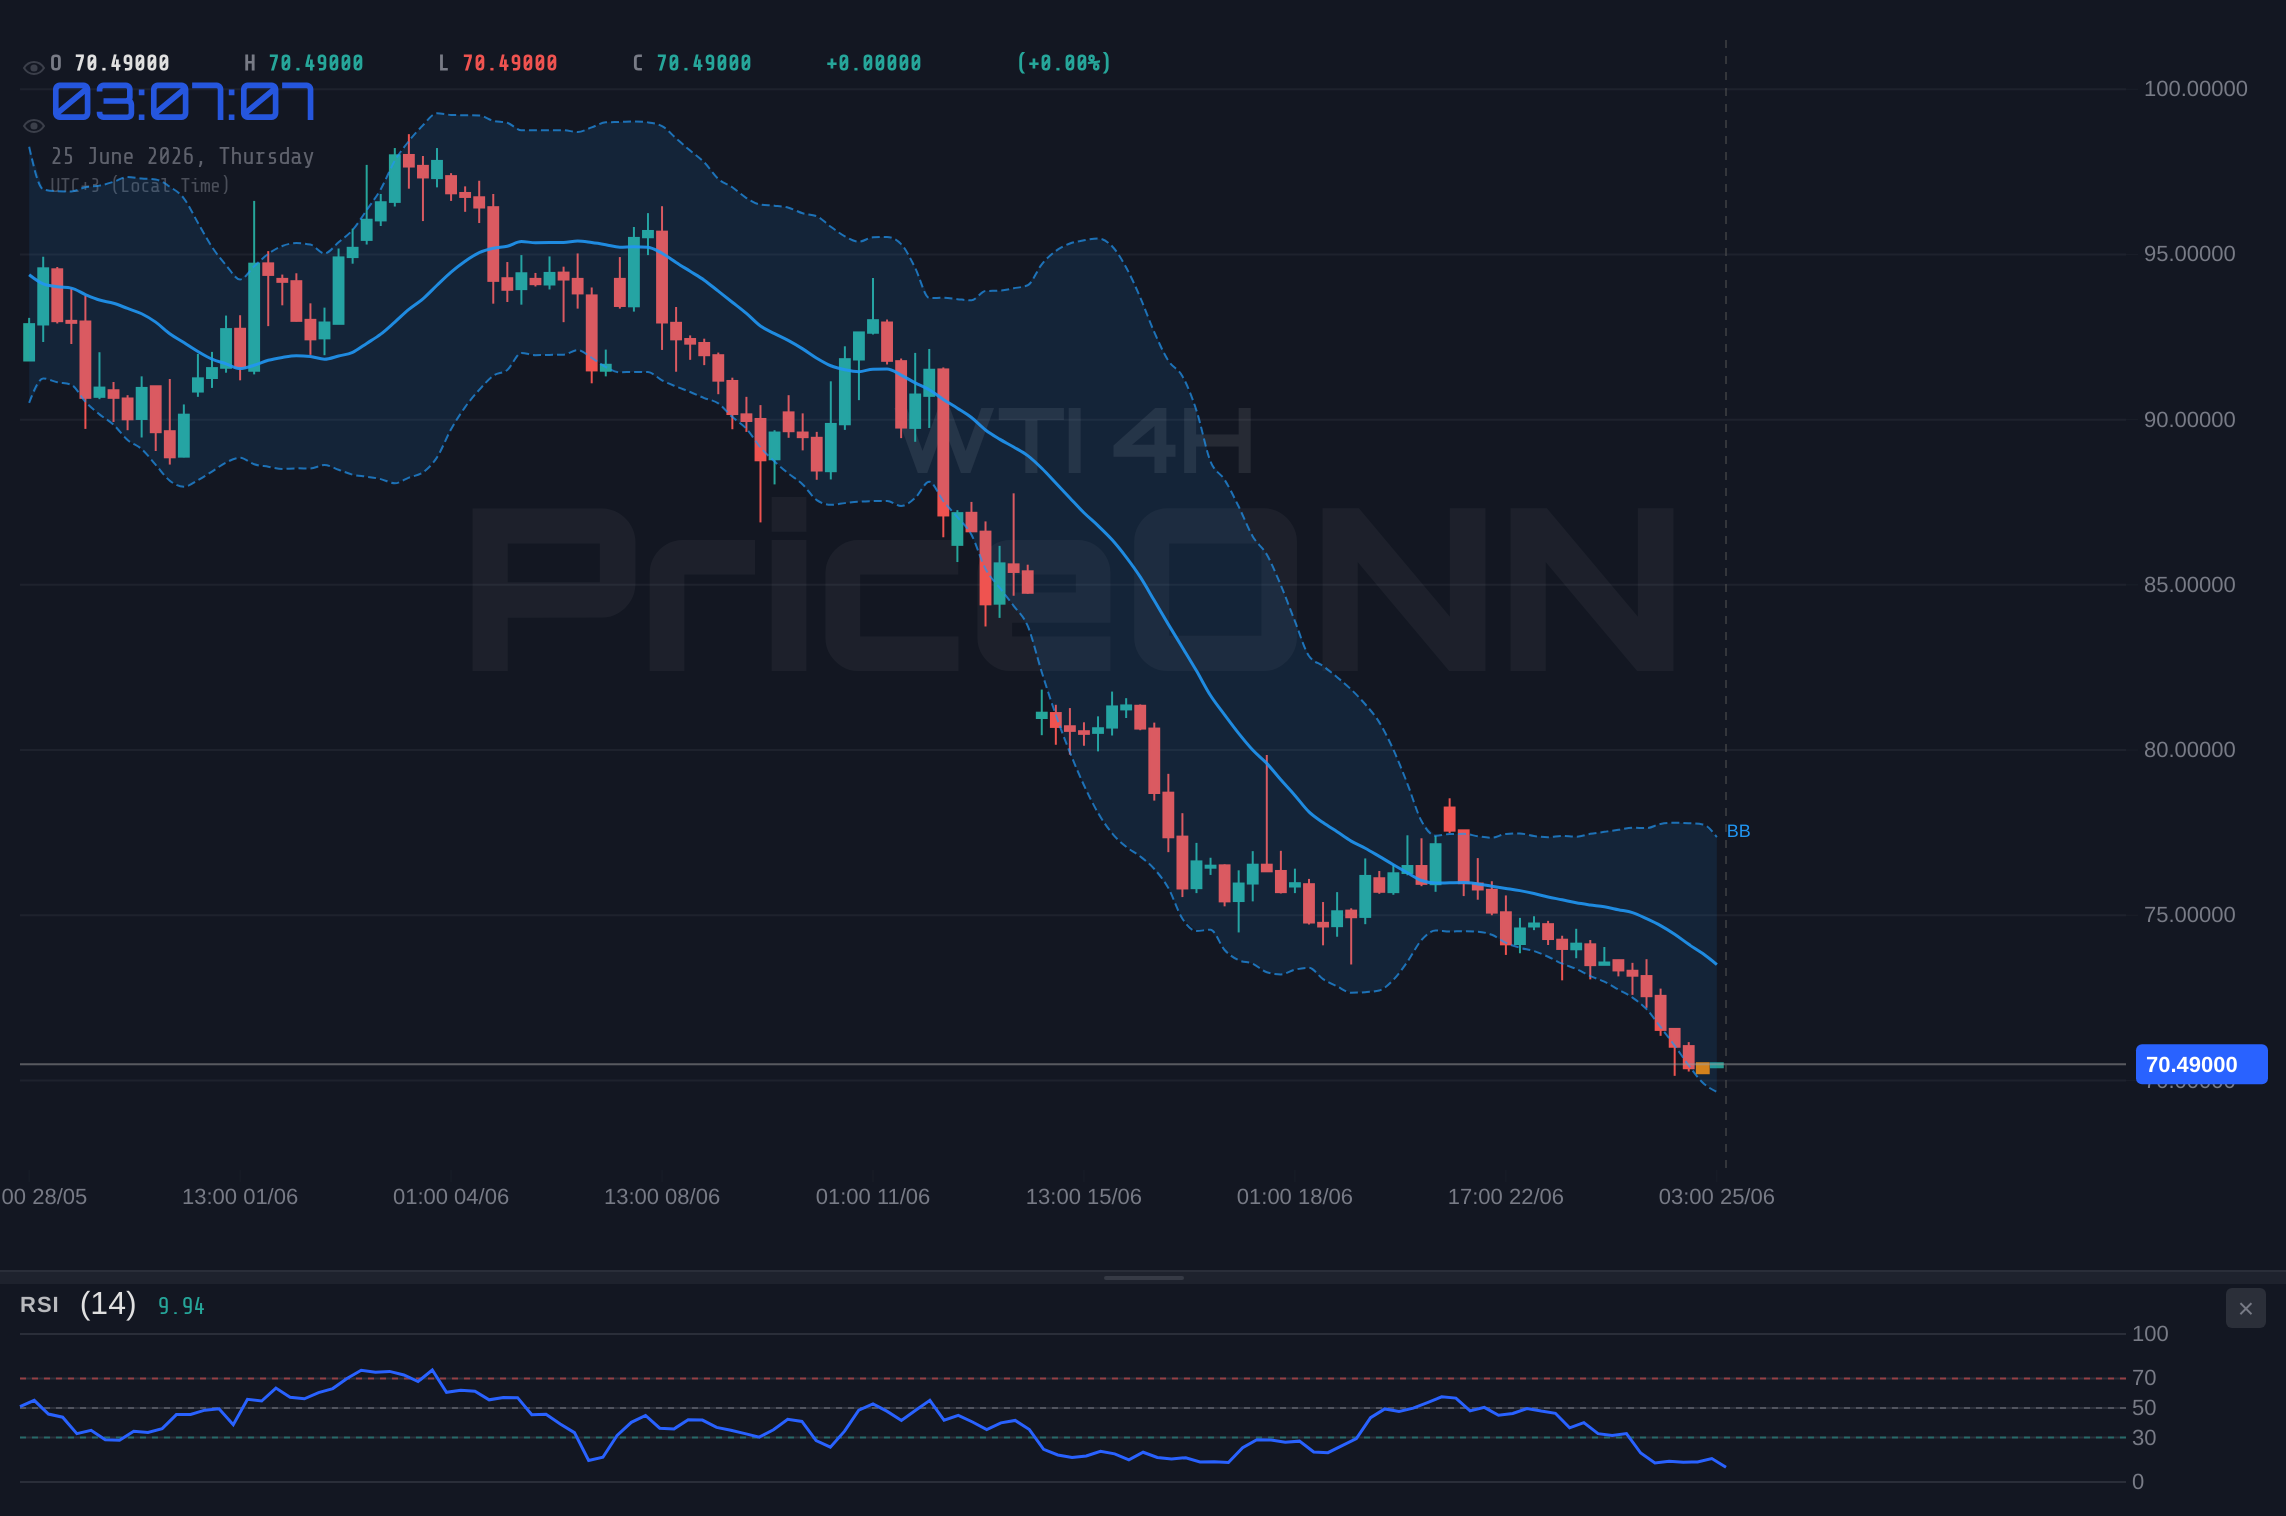
Delving into the daily chart provides a longer-term perspective, and it confirms the dominance of the downtrend, albeit with slightly less aggressive momentum strength at 100%. The RSI at 26.64 remains in oversold territory, a classic sign of potential capitulation or a deep oversold condition that could lead to a significant reversal if confirmed by other factors. The MACD continues to show negative momentum below its signal line, and price is trading below the middle Bollinger Band. The Stochastic oscillator, with K at 3.5 and D at 8.08, is deeply oversold, again pointing to potential exhaustion in the current sell-off. The ADX at 28.27, while lower than the shorter timeframes, still signifies a strong downtrend. The key support levels to watch on the daily chart are $72.74, $71.92, and $70.80. The current price of $70.62 has already breached the $70.80 level, indicating that the market is pushing into lower support zones. This downward pressure is consistent across all analyzed timeframes, painting a clear picture of a market under significant bearish influence.
The correlated weakness in Brent crude, currently trading at $73.54, reinforces the bearish sentiment for the energy markets. Brent's price action mirrors WTI's, showing a strong downtrend across all timeframes. On the 1-hour chart, Brent RSI is at 29.79, MACD is negative, and ADX is at 41.57, indicating a strong downtrend. The 4-hour chart shows RSI at 19.66, deeply oversold, with a strong downtrend confirmed by ADX 39.51. The daily chart reveals RSI at 24.61, also oversold, with ADX at 31.74, still denoting a strong trend. This synchronized decline in both major crude benchmarks suggests that the bearish pressure is systemic, likely driven by macroeconomic factors rather than isolated supply issues. The fact that both are experiencing such sharp declines, with WTI now below $70.62 and Brent below $73.54, points to a broader demand-side concern or a significant shift in market expectations regarding future supply or economic growth.
Adding another layer to this complex picture is the performance of the US dollar index (DXY), currently at 101.67. The DXY is showing a strong uptrend on the 4-hour and daily charts, with RSI at 71.83 and 76.72 respectively, indicating overbought conditions. This strength in the dollar typically exerts downward pressure on dollar-denominated commodities like oil, as it becomes more expensive for holders of other currencies. The recent news highlighting the euro's fall to a one-year low against the dollar, trading around $1.13537, is a direct consequence of this dollar strength and potentially dovish signals from the European Central Bank (ECB). As reported by news outlets, the euro has indeed sunk to a one-year low, with easing tensions potentially cooling oil prices, but more significantly, weak macroeconomic data from the euro area and signals from ECB Chief Economist Philip Lane emphasizing a 'calibrated' response rather than a 'huge, gigantic' tightening push, are weighing on the single currency. This dovish stance from the ECB, coupled with the dollar's robust performance, creates a challenging environment for commodities priced in dollars.
The correlation between the dollar's strength and oil prices is a critical factor to monitor. When the DXY strengthens significantly, it tends to put pressure on commodities like WTI and Brent. The current DXY reading of 101.67, with strong uptrend signals on multiple timeframes, suggests that this dollar strength is likely to persist in the near term, acting as a headwind for oil prices. Furthermore, the overall risk sentiment, often reflected in indices like the S&P 500, is also playing a role. While the S&P 500 is showing a mixed picture with a 1-hour uptrend and a daily downtrend, the broader narrative of technology sector liquidation and a potential shift in market sentiment, as noted in recent financial news, could be contributing to a risk-off environment. In such an environment, investors often retreat from riskier assets, including commodities, and seek refuge in safer havens like the US dollar, further amplifying the downward pressure on oil.
From a fundamental perspective, the sharp decline in oil prices could be attributed to a combination of factors, including potential easing of geopolitical tensions that had previously supported prices, and growing concerns about global demand. The news mentioning 'easing of tensions between the United States and Iran helping to cool oil prices' suggests that one of the risk premiums that had been supporting crude might be dissipating. While this is positive for consumers, it removes a key bullish catalyst for oil producers. Simultaneously, the weakening euro and the general macroeconomic uncertainty highlighted by the tech sector sell-off could signal a slowdown in global economic activity, which would directly impact oil demand. The market appears to be pricing in a scenario of softer global growth, leading to reduced energy consumption expectations.
Bearish Scenario: Downside Momentum Persists
65% ProbabilityNeutral Scenario: Consolidation and Re-evaluation
25% ProbabilityBullish Scenario: Short-Term Bounce Potential
10% ProbabilityFrequently Asked Questions: WTI Analysis
What happens if WTI breaks below the $70.25 support level on the 1-hour chart?
If WTI breaks below the $70.25 support on the 1-hour chart, it would likely confirm the continuation of the strong downtrend, potentially targeting the next support at $69.49. This would be driven by persistent bearish momentum and a lack of significant buying interest at current levels, further exacerbated by the strong ADX reading of 41.77.
Should I consider buying WTI at current levels around $70.62 given the oversold RSI?
Buying at current levels around $70.62, despite the oversold RSI, is a high-risk proposition. While a short-term bounce is possible, the strong downtrend indicated by the ADX (41.77 on 1H, 39.93 on 4H) and negative MACD momentum suggests that such a move would likely be a counter-trend trade. Confirmation of a bullish reversal would require breaking key resistance levels like $70.42 with conviction.
Is the RSI at 22.4 on the 4-hour chart a definitive buy signal for WTI?
An RSI reading of 22.4 on the 4-hour chart is indeed a strong oversold signal, indicating that WTI has been sold off aggressively. However, it is not a definitive buy signal on its own. In a strong downtrend, RSI can remain oversold for extended periods. Confirmation from other indicators, like a MACD crossover or a break of resistance, is crucial before considering a long position.
How will the strong dollar and weak euro affect WTI prices this week?
The strong dollar, currently at DXY 101.67, and the weak euro (EURUSD at $1.13537) are creating headwinds for WTI. This correlation means that as the dollar strengthens, oil becomes more expensive for non-dollar buyers, potentially dampening demand and pushing prices lower. This macro environment supports the bearish outlook for WTI unless there is a significant shift in central bank policy or geopolitical events.
| Indicator | Value | Signal | Interpretation |
|---|---|---|---|
| RSI (14) | 33.16 | Oversold | Potential for bounce, but trend is strong |
| MACD | -0.45 | Negative Momentum | Sellers in control |
| Stochastic | K=22.61, D=21.77 | Bullish Crossover | Short-term reversal signal, needs confirmation |
| ADX | 41.77 | Strong Trend | Downtrend is very powerful |
| Bollinger Bands | Below Middle Band | Bearish Bias | Price below average, indicating downward pressure |
The fundamental backdrop continues to favor a bearish outlook for WTI. The persistent strength of the US Dollar Index (DXY) at 101.67, coupled with the euro's weakness to $1.13537, creates a challenging environment for dollar-denominated commodities. Recent news highlighting dovish signals from the ECB and a potential cooling of geopolitical tensions suggests that the tailwinds that previously supported oil prices might be receding. This confluence of factors - strong dollar, weak euro, and potentially softening global demand - reinforces the bearish sentiment currently weighing on WTI. As traders, our focus must remain on risk management and identifying high-probability setups. While the oversold conditions on shorter timeframes suggest a potential for a short-term bounce, the overwhelming trend strength across multiple timeframes, particularly the ADX readings, indicates that any such move is likely to be a counter-trend rally within a larger bearish move. The key levels identified, particularly the $70.25 support and $70.42 resistance on the 1-hour chart, will be crucial in determining the immediate direction. A break below $70.25 could open the door for further declines towards $69.49 and $68.83, while a sustained move above $70.42 would be needed to signal a potential reversal, targeting higher resistance levels.
Looking ahead, the market will be closely watching for any shifts in central bank policy, particularly from the Federal Reserve and the ECB, as well as any further developments in geopolitical hotspots that could impact oil supply. The upcoming economic data releases will be critical in shaping expectations for global growth and inflation, which in turn will influence oil demand. For now, the technical picture for WTI at $70.62 is decidedly bearish, with strong downward momentum across timeframes and significant headwinds from a strengthening dollar and correlated weakness in other energy benchmarks. Patience and a disciplined approach to risk management are paramount as the market digests these complex fundamental and technical signals. The potential for a short-term bounce exists, but the prevailing trend suggests that any upside moves should be treated with caution until clear confirmation of a trend reversal emerges.
Track markets in real-time
AI-powered analysis, technical indicators and real-time price data.
Join Our Telegram Channel
Breaking market news, AI analysis and trading signals instantly.
Join Channel