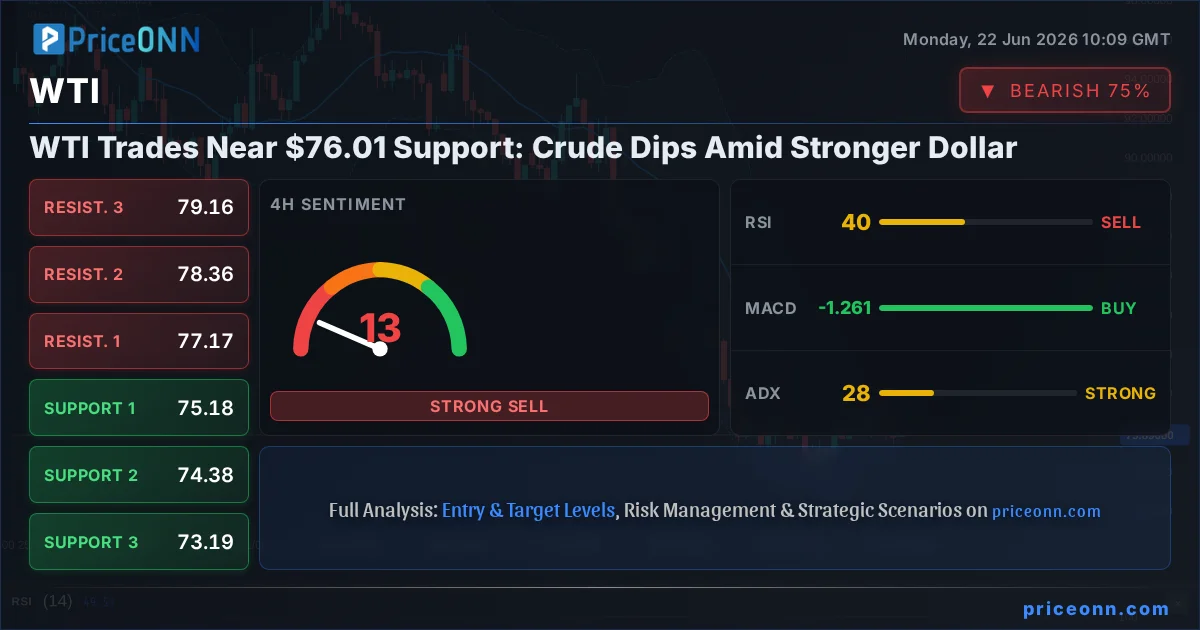
The price action in WTI crude oil is currently at a critical juncture, with the commodity trading precariously close to the $76.01 mark. This level represents a significant area of interest for traders and analysts alike, as the interplay of macroeconomic factors, geopolitical undercurrents, and technical indicators paints a complex picture. As the US Dollar Index (DXY) shows renewed strength, and with bearish sentiment creeping into longer timeframes for WTI, the immediate future of crude oil prices hinges on whether this support level can hold or if a further decline is on the horizon. This analysis delves into the multifaceted drivers influencing WTI, exploring the technical signals, the correlation with broader market movements, and the potential scenarios that could unfold in the coming days and weeks.
- With RSI at 46.57 on the 1H chart, WTI shows bearish momentum, suggesting further downside potential below $76.01.
- Critical support for WTI sits at $75.38, a level that, if broken, could trigger a sharp sell-off towards $74.97.
- The ADX reading of 15.77 on the 1H chart indicates a weak trend, suggesting the current downward move may lack conviction but could accelerate if key levels break.
- The strengthening DXY, currently at 100.93, is putting pressure on commodities like WTI, reinforcing the bearish outlook.
The Dollar's Grip: Why Macro Matters for WTI
The relationship between the US Dollar Index (DXY) and crude oil prices, particularly WTI, is a cornerstone of commodity market analysis. Currently, the DXY is trading at 100.93, exhibiting a strengthening trend across multiple timeframes. This upward momentum in the dollar typically exerts downward pressure on dollar-denominated commodities like oil. When the dollar strengthens, it becomes more expensive for holders of other currencies to purchase commodities priced in dollars, thus dampening demand. Furthermore, a stronger dollar can signal a shift towards risk aversion in global markets, which often correlates with reduced demand for riskier assets and commodities. The DXY's current position, showing a strong uptrend on the 4H and 1D charts (ADX 48.66 and 34.17 respectively), suggests that this dollar strength is not a fleeting intraday move but a more sustained trend, posing a significant headwind for WTI.
The implications of this dollar strength are amplified by the fact that major economic powers are navigating complex monetary policy landscapes. While specific central bank announcements are not detailed in the provided data, the general trend of a strong dollar often reflects expectations about interest rate differentials or global economic uncertainty that drives capital towards perceived safe havens. For WTI, this macro backdrop creates a challenging environment. As the price hovers around $76.01, the dollar's influence cannot be overstated. A sustained rally in the DXY could easily push WTI lower, even if other factors might otherwise support prices. Traders are therefore watching the DXY's trajectory as closely as they are watching the crude oil charts themselves, understanding that a strong dollar can be a powerful force in driving commodity prices.
This correlation is not merely theoretical; it plays out in real-time trading sessions. On the 1H chart, while WTI shows some mixed signals, the longer-term daily outlook is decidedly bearish, influenced in part by the macro picture. The ADX on the daily chart at 37.39 indicates a strong downtrend, and while the RSI is in neutral territory at 39.79, the overall trend is clearly downwards. This bearish trend is often exacerbated by a strengthening dollar, which acts as a persistent drag on oil prices. The battle between dollar strength and any potential underlying demand-side support for oil will be a key theme to monitor.
Technical Breakdown: WTI's Support at $76.01
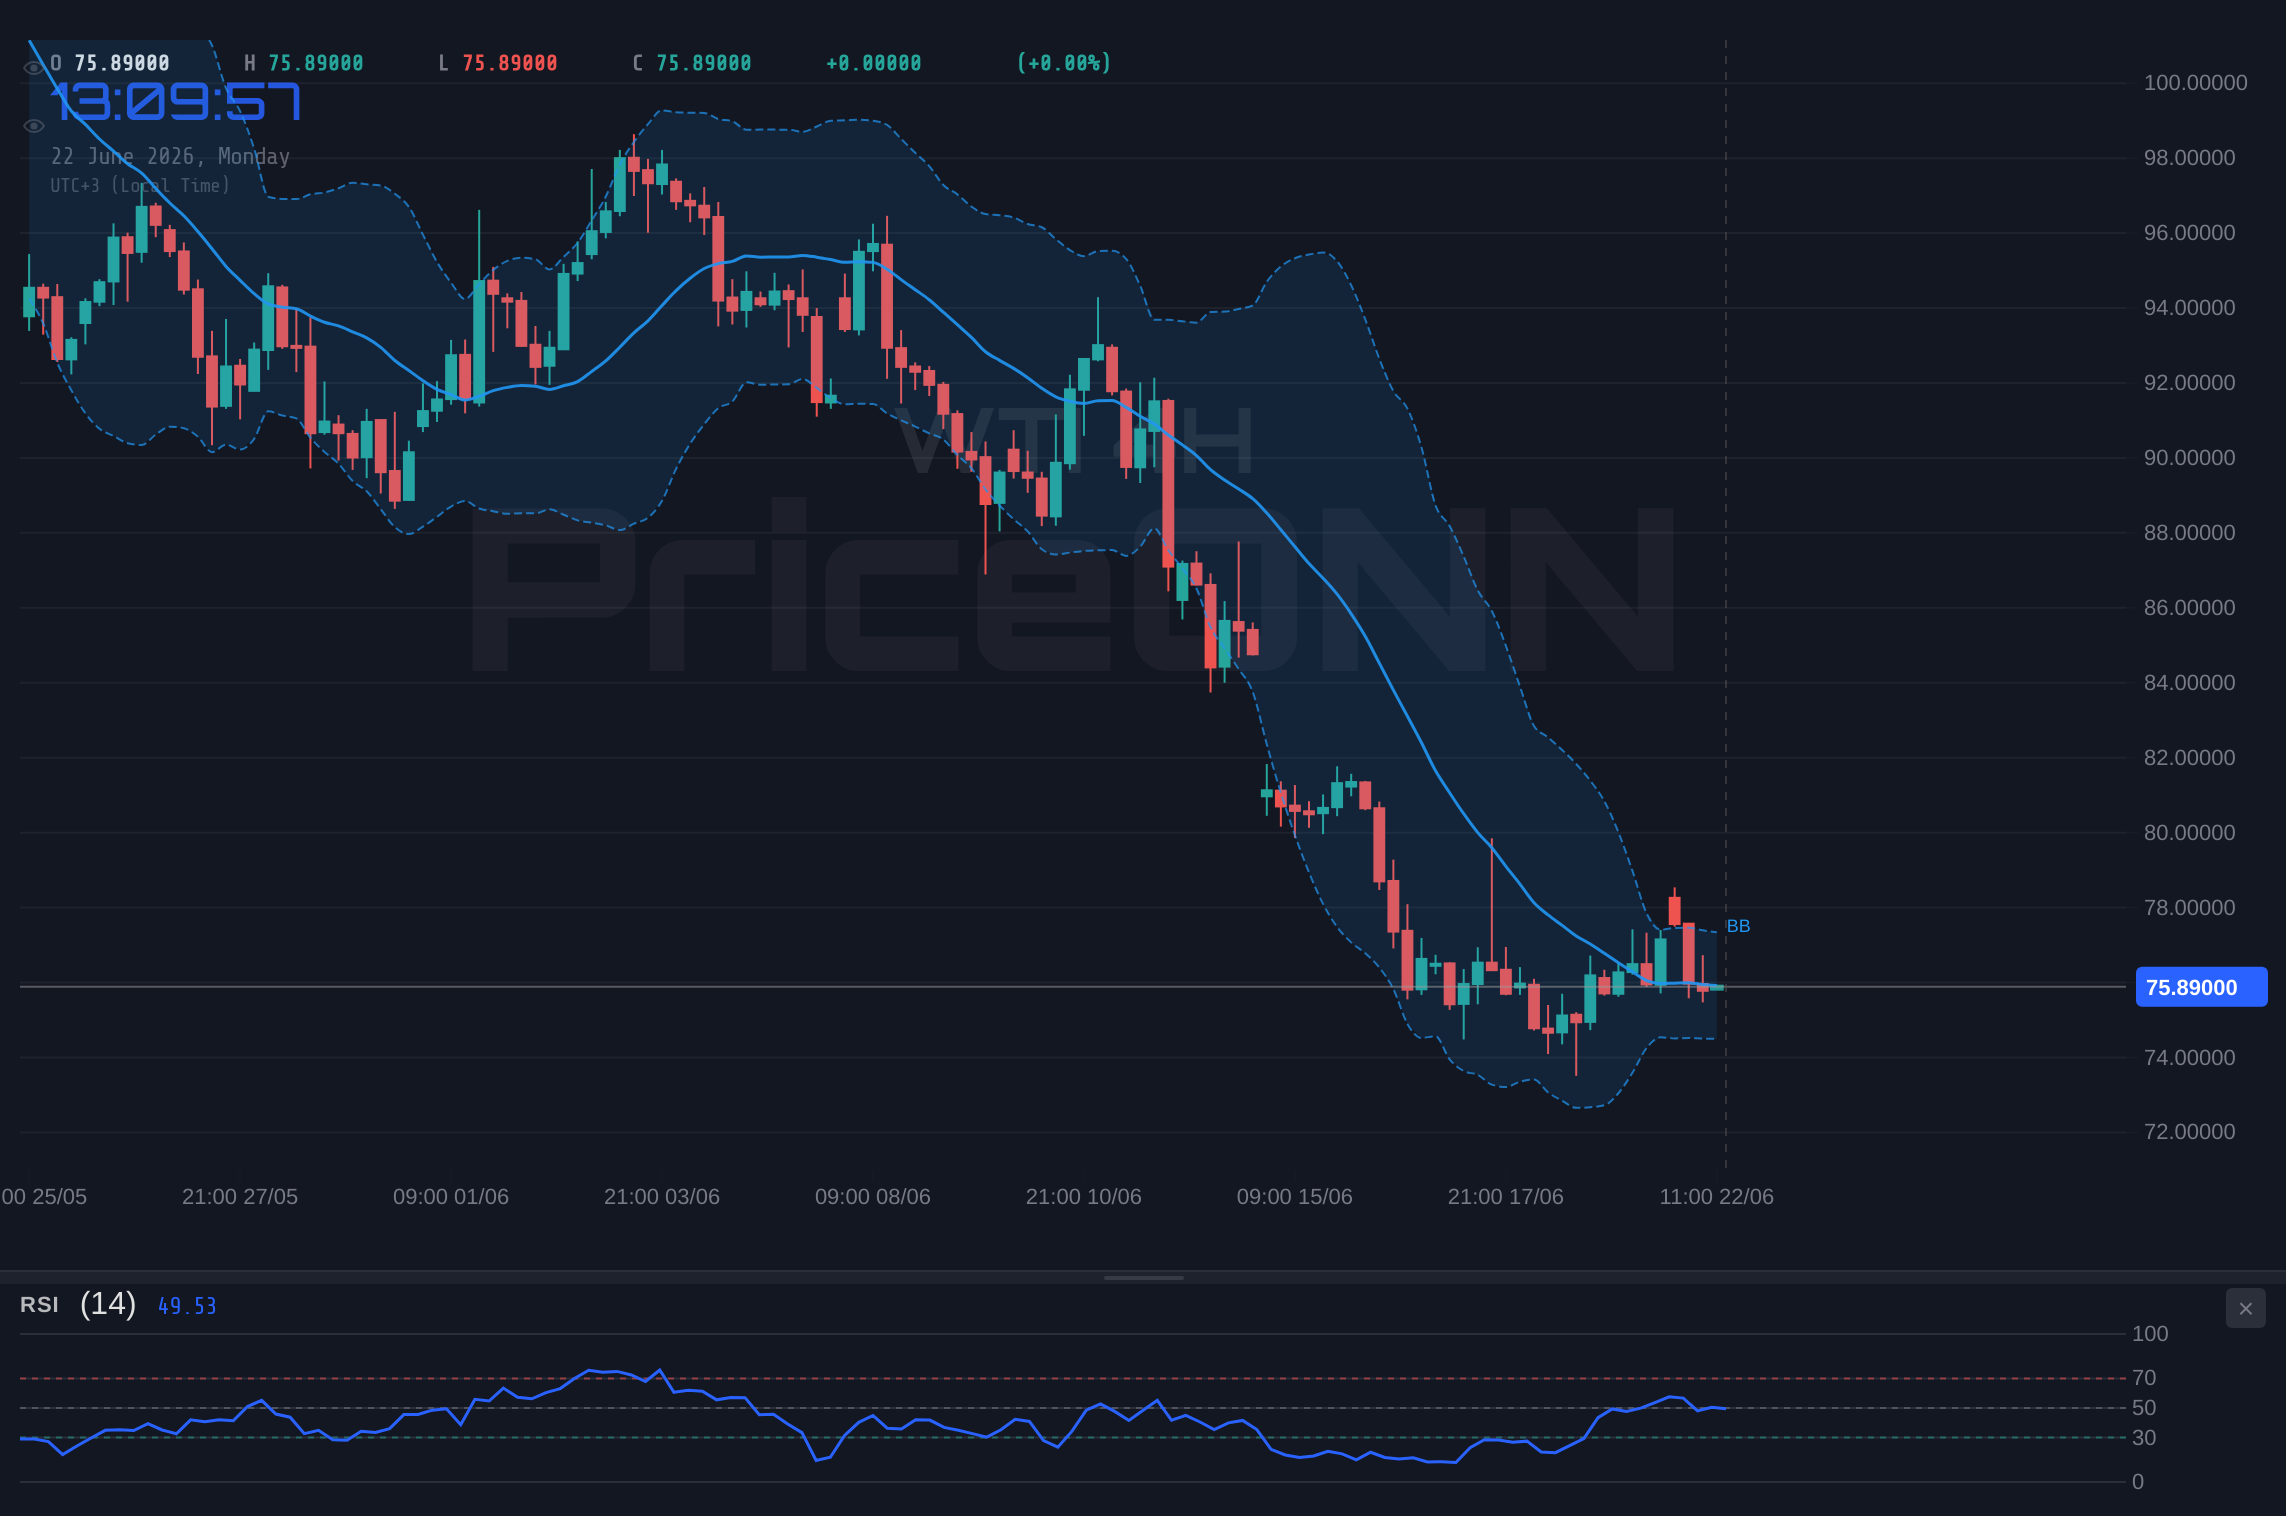
Turning our attention to the technical landscape, WTI's current position near $76.01 is a focal point. On the 1-hour chart, the trend is currently neutral with a strength of 50%, but the ADX at 15.77 suggests a weak trend, indicating a lack of strong directional conviction in the very short term. However, the RSI is at 46.57, trending downwards, and the MACD shows negative momentum. Stochastic oscillators are giving a buy signal (%K > %D at 20.29 vs 15.6), but this is within an oversold context and could be a minor pullback before further downside, especially considering the sell signals from other indicators. The Bollinger Bands are below the middle band, reinforcing a bearish short-term bias.
The 4-hour chart paints a more concerning picture for bulls. Here, the trend is also neutral, but the ADX at 28.11 indicates a stronger trend is developing, and the RSI at 40.61 continues its downward trajectory. The MACD is showing positive momentum, which is a slight divergence from the bearish sentiment on other charts, but this could be a lagging indicator or a sign of a potential short-term bounce. Stochastic is giving a sell signal (%K
The daily timeframe is where the most significant bearish signals are concentrated. The trend is decisively downwards, with a strength of 97%. The ADX at 24.12 confirms a strong downtrend. The RSI at 31.18 is approaching oversold territory, suggesting that while selling pressure is intense, there might be limited room for further immediate capitulation without a catalyst. However, the MACD is firmly in negative momentum, below its signal line, and the Stochastic oscillators are deep in oversold territory with %K below %D (13.74 vs 8.66), flashing a strong sell signal. The Bollinger Bands are below the middle band, confirming the bearish trend. The confluence of these daily indicators strongly suggests that the path of least resistance for WTI is to the downside, making the $76.01 support level a critical line in the sand.
Understanding these technical nuances is vital. The weak trend on the 1H chart (ADX 15.77) suggests that any move below $76.01 might not be immediately sharp but could accelerate if key support levels are breached. The stronger trend indicators on the 4H (ADX 28.11) and 1D (ADX 24.12) charts indicate that the prevailing downward momentum has substance. The conflicting signals between Stochastic and other indicators highlight the need for confirmation. For instance, while Stochastic might show oversold conditions, a break below key support levels could invalidate any potential for a near-term bounce and trigger further liquidation.
Navigating the Scenarios: What's Next for WTI?
Given the current technical and macroeconomic crosscurrents, several scenarios are plausible for WTI. The market is at a crossroads, and the outcome will likely depend on which factors gain prominence: the persistent dollar strength and bearish technicals, or potential supply-side dynamics and a shift in risk appetite.
Bearish Scenario: The Downside Accelerates
70% ProbabilityConsolidation Scenario: The Waiting Game
20% ProbabilityBullish Scenario: A Support Bounce
10% ProbabilityWhy the Bearish Scenario Dominates
Currently, the technical indicators and the prevailing macroeconomic environment strongly favor the bearish scenario. The daily timeframe, in particular, presents a compelling case for further downside. With the ADX at 24.12 indicating a strong downtrend and the RSI at 31.18 nearing oversold conditions, the market is primed for a potential continuation of the sell-off. The Stochastic oscillator's position deep in oversold territory (K=13.74, D=8.66) suggests that while selling pressure is intense, there might be a short-term oversold bounce. However, the MACD's negative momentum and the Bollinger Bands sitting below the middle band on the daily chart are strong confirmations of the prevailing bearish trend. This outlook is further reinforced by the strengthening DXY, which is currently at 100.93 and showing upward momentum.
The 4-hour chart also leans bearish, with an ADX of 28.11 indicating a developing trend and an RSI of 40.61 trending down. While the MACD shows positive momentum, this could be a temporary divergence. The Stochastic's sell signal (K=54.34, D=70.18) aligns with the overall bearish sentiment. The key support level to watch on this timeframe is $75.38. A break below this level would likely confirm the bearish thesis and could accelerate the decline towards the next support at $74.97.
On the 1-hour chart, the signals are more mixed, with a weak trend (ADX 15.77) and some conflicting indicators like Stochastic. However, the RSI's downward trend (46.57) and negative MACD momentum suggest that even in the short term, the pressure is downwards. The immediate support at $76.01 is critical. If this level fails, the targets of $75.38 and $74.97 become highly probable. The probability assigned to the bearish scenario (70%) reflects the confluence of strong daily bearish signals, the influence of the strengthening dollar, and the proximity to key support levels that are showing signs of weakness.
Geopolitical Ripples and Oil Market Fundamentals
Beyond the immediate technicals and dollar strength, the oil market is always susceptible to geopolitical events and shifts in fundamental supply and demand. Recent news highlights potential geopolitical tensions in the Middle East, specifically concerning the Strait of Hormuz. Reports suggest that blockades, while perhaps unlikely, have paralyzed significant oil transit routes in the past, emphasizing the region's volatility. India, heavily reliant on imported fossil fuels, is reportedly rethinking its energy strategy in light of these disruptions. This heightened geopolitical risk in a critical oil-producing region could, under different circumstances, provide a floor for oil prices. However, the current market sentiment appears to be prioritizing the macro headwinds and bearish technicals over these potential supply-side concerns.
Furthermore, analysts are warning that China's oil demand may never fully recover to pre-pandemic levels, citing demand destruction. This is a significant factor, as China is one of the world's largest oil consumers. If its demand remains permanently depressed, it would create a structural headwind for global oil prices, irrespective of geopolitical flare-ups. The interplay between potential supply disruptions and weakened demand creates a delicate balance, but currently, the demand-side concerns and the strong dollar appear to be weighing more heavily on WTI.
The mention of a potential US-Iran framework deal, as reported by Forex news, could also influence market sentiment by easing geopolitical tensions, which would be bearish for oil prices. While the details are scarce, any de-escalation in the Middle East would remove a significant risk premium that may have been baked into crude prices. This adds another layer to the bearish argument, suggesting that even if geopolitical events were to normally support prices, current developments might be counteracting that effect.
What Traders Should Watch This Week
For traders focused on WTI, the coming week presents several key triggers that will likely dictate the direction of prices. The immediate focus remains on the $76.01 support level. A decisive break below this psychological and technical level, especially on increasing volume and confirmed by a continued rise in the DXY, would strongly signal the continuation of the bearish trend. The next critical support to monitor would be $75.38, followed by $74.97. A failure to hold these levels could lead to a more significant price decline.
Conversely, any sign of dollar weakness, perhaps signaled by a downturn in the DXY below its 4H middle Bollinger Band or a negative RSI divergence, could provide a reprieve for WTI. In such a scenario, traders would look for a bounce off the $76.01 support, with initial resistance seen at $76.46 and then $77.13. Confirmation of a bullish reversal would require not only a weakening dollar but also a shift in technical indicators, such as RSI moving back above 50 and MACD showing positive momentum on the 1H or 4H charts.
The broader market sentiment, reflected in the performance of indices like the SP500 and Nasdaq, will also be crucial. If risk appetite dwindles further, leading to a sell-off in equities, it would likely correlate with a stronger dollar and weaker oil prices. The news flow regarding geopolitical events in the Middle East and China's energy demand will also be closely watched. Any concrete developments on these fronts could introduce volatility and potentially shift the market's focus, but for now, the technical picture and the dollar's strength appear to be the dominant forces.
Indicator Dashboard: A Technical Snapshot
| Indicator | Value | Signal | Interpretation |
|---|---|---|---|
| RSI (1H) | 46.57 | Bearish | Downward trend, suggesting selling pressure. |
| MACD (1H) | Negative Momentum | Bearish | Momentum is fading, favoring sellers. |
| Stochastic (1H) | K=20.29, D=15.6 | Bullish | Oversold conditions, potential for short-term bounce. |
| ADX (1H) | 15.77 | Neutral | Weak trend, indicating consolidation or indecision. |
| RSI (4H) | 40.61 | Bearish | Downward trend, approaching oversold territory. |
| MACD (4H) | Positive Momentum | Bullish | Momentum is building, counter to longer-term trend. |
| Stochastic (4H) | K=54.34, D=70.18 | Bearish | Mid-range, favoring sellers. |
| ADX (4H) | 28.11 | Bearish | Developing trend, favoring directional move. |
| RSI (1D) | 31.18 | Bearish | Nearing oversold, but strong trend intact. |
| MACD (1D) | Negative Momentum | Bearish | Strong negative momentum confirms downtrend. |
| Stochastic (1D) | K=13.74, D=8.66 | Bearish | Deeply oversold, but trend may continue. |
| ADX (1D) | 24.12 | Bearish | Strong downtrend confirmed. |
Key Levels to Watch
Frequently Asked Questions: WTI Analysis
What happens if WTI breaks decisively below the $76.01 support level?
A break below $76.01, especially if confirmed by increasing volume and a rising DXY, would likely trigger a move towards the next support at $75.38. The daily chart's strong bearish trend indicators support this scenario, suggesting potential for further downside towards $74.97 if the selling pressure intensifies.
Is the current RSI reading of 46.57 on the 1H chart a buy signal for WTI?
No, an RSI of 46.57 trending downwards is not a buy signal; it indicates bearish momentum. While the Stochastic oscillator on the 1H chart is in oversold territory, suggesting a potential for a short-term bounce, the overall trend and other indicators point towards continued weakness. A sustained move above $77.17 would be needed to invalidate the bearish outlook.
How is the strengthening DXY impacting WTI's price action around $76.01?
The DXY trading at 100.93 and showing upward momentum creates a headwind for WTI. A stronger dollar makes oil more expensive for foreign buyers, potentially dampening demand. This macro factor reinforces the bearish technical signals, increasing the probability of WTI testing and potentially breaking below the $76.01 support level.
What are the key price levels to watch for WTI following the dip below $76.01?
If WTI breaks below $76.01, the immediate focus shifts to support at $75.38. A further breakdown could target $74.97. On the upside, immediate resistance is at $76.46, followed by $77.13. A decisive move above $77.17 would be needed to challenge the prevailing bearish sentiment.
The path forward for WTI appears challenging in the short to medium term, heavily influenced by a strengthening US dollar and bearish technical signals on longer timeframes. While geopolitical risks and potential supply-side issues always loom, the current market narrative prioritizes macroeconomic headwinds. Traders should maintain a cautious approach, focusing on the critical support at $76.01 and the subsequent levels. Patience is key; waiting for clear confirmation of either a breakdown or a sustained bounce will be crucial for navigating these choppy waters.
Track markets in real-time
AI-powered analysis, technical indicators and real-time price data.
Join Our Telegram Channel
Breaking market news, AI analysis and trading signals instantly.
Join Channel