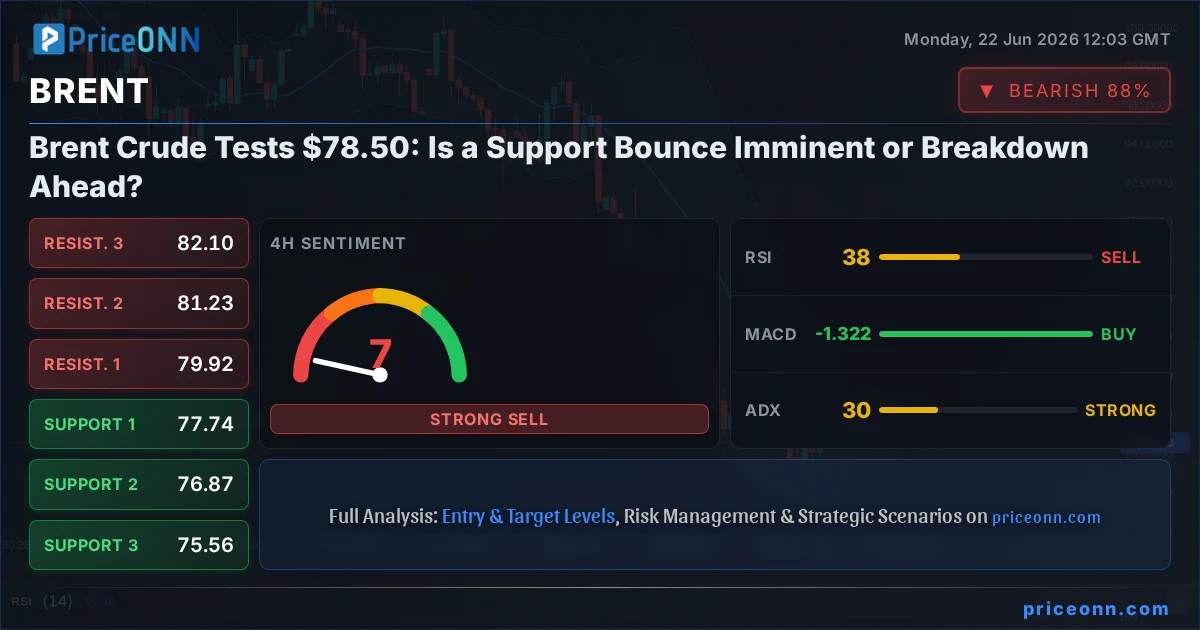
The global oil market is at a critical juncture, with Brent crude futures currently trading around the $78.50 mark. This pivotal price point represents a confluence of factors, including recent geopolitical tensions and shifting macroeconomic expectations. The question on every trader's mind is whether the current levels will hold as a springboard for renewed upside, or if the downward pressure will prevail, leading to a deeper correction. This analysis delves into the intricate technical and fundamental landscape surrounding Brent, aiming to decipher the next likely move.
- Brent crude is trading near $78.50, a critical level influenced by geopolitical events and demand outlooks.
- Key support is identified at $78.96, with resistance challenging around $78.87 and $79.92 on different timeframes.
- The 1-hour chart shows a neutral trend with bullish leanings (RSI 43.7), while daily charts indicate a strong downtrend (ADX 27.76).
- Geopolitical events, particularly concerning the Strait of Hormuz and US-Iran relations, are creating volatility.
The Bull Case: Geopolitical Support and Technical Rebound Potential
On the bullish side, the narrative is heavily influenced by the persistent geopolitical tensions in the Middle East. Recent reports highlight the ongoing crisis surrounding the Strait of Hormuz, which has been described as a critical choke point for global oil supply. The fact that this blockade was once considered unthinkable, yet has now become a tangible risk, injects a significant risk premium into oil prices. India, heavily reliant on energy imports, is already rethinking its strategy due to these disruptions. This underlying supply-side vulnerability provides a foundational support for Brent, even amidst broader concerns about global demand. Furthermore, the 1-hour technical indicators offer a glimmer of hope for bulls. While the RSI at 43.7 is not yet signaling oversold conditions, it is moving away from the extreme lows seen earlier. The Stochastic oscillator showing a crossover (%K > %D) suggests a potential upward momentum shift, albeit from a weak trend environment (ADX 11.62). A break and hold above the immediate resistance at $78.87 could entice buyers, targeting higher levels.
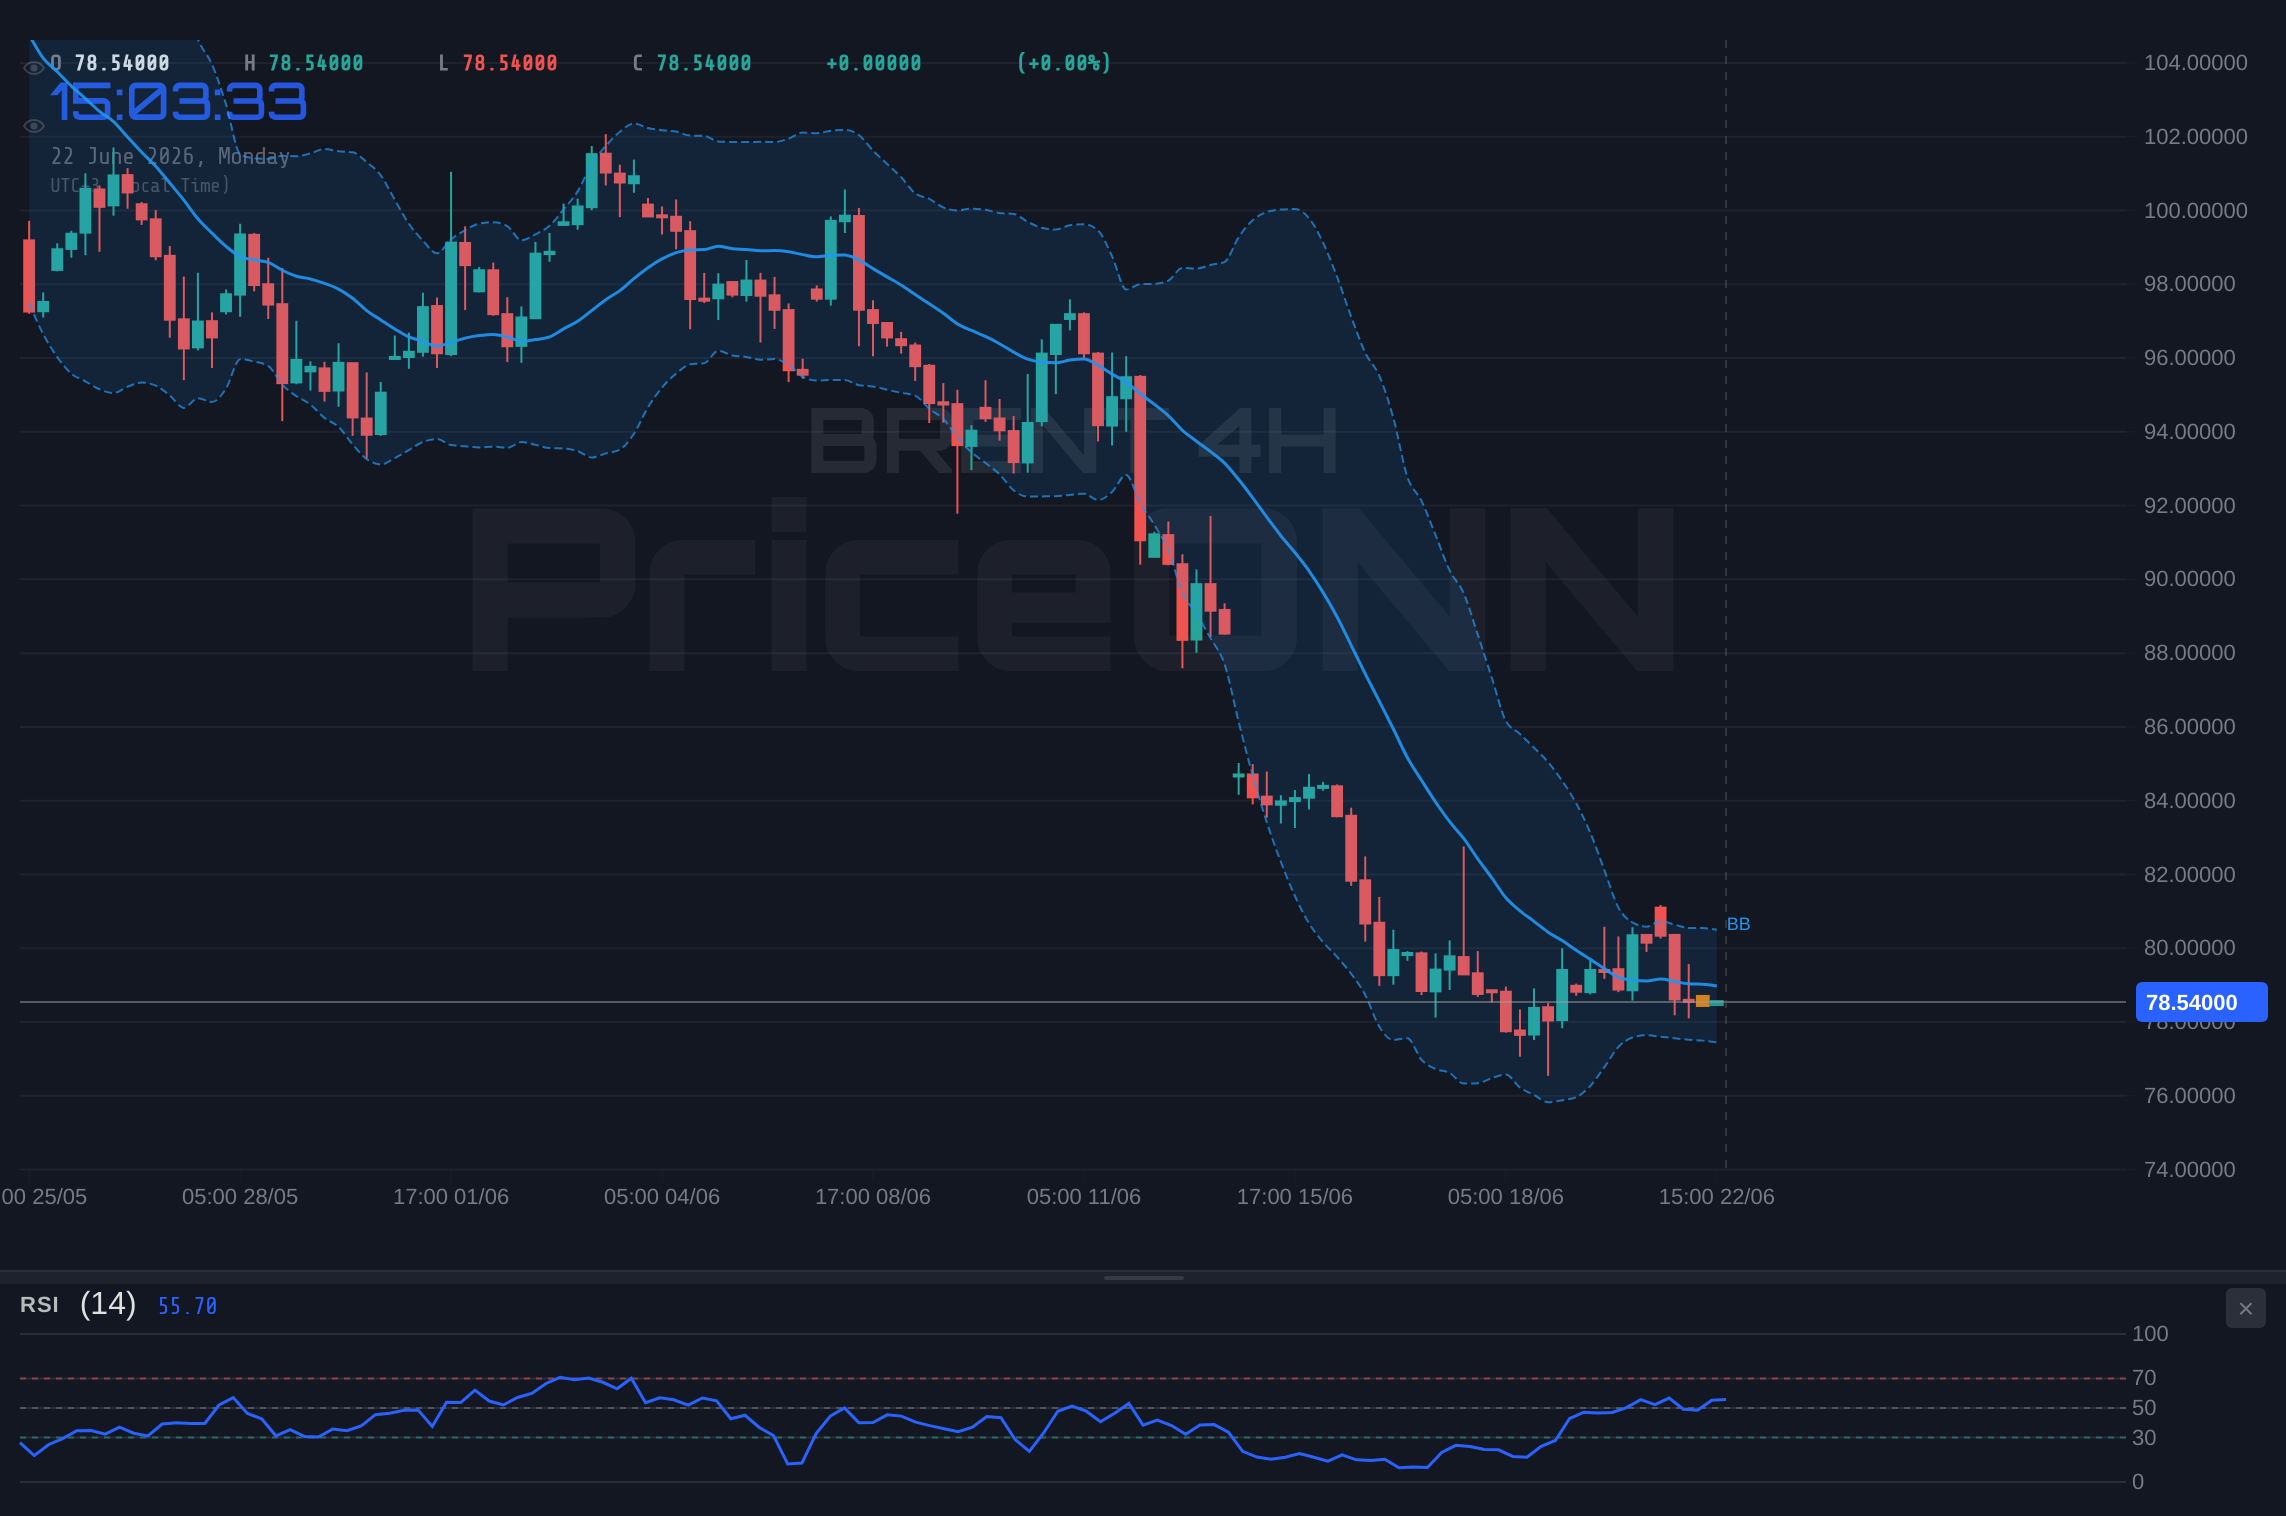
The 4-hour chart, while leaning bearish with an ADX of 29.61, shows a MACD that has recently turned positive, hinting at a potential shift in momentum. This could be interpreted as a short-term buying opportunity for nimble traders, especially if the price can reclaim the middle Bollinger Band. The daily chart, despite its strong downtrend signal (ADX 27.76), shows Brent trading near the lower Bollinger Band at $78.18. Historically, such positions can sometimes precede a reversion to the mean, particularly if geopolitical headlines continue to support a risk-on sentiment in energy markets. The fact that oil prices eased on news of a US-Iran framework deal, while potentially signaling a de-escalation, also highlights the market's sensitivity to such developments. A less volatile geopolitical landscape could, paradoxically, lead to a short-term relief rally as speculative short positions are unwound.
The argument for a bullish reversal also hinges on the idea of market overreaction. The significant daily drop of 2.06% (-$1.65) to $78.50 suggests that the market may have priced in too much negativity. If demand destruction fears, as analysts predict for China, are not immediately realized, and if geopolitical risks remain elevated, a bounce could be on the cards. The potential for a short squeeze, especially if prices push above the $79.92 resistance level, cannot be discounted. Traders often use these moments of uncertainty to position for a rebound, anticipating that the underlying supply constraints will ultimately dictate price action.
The Bear Case: Demand Concerns and Daily Downtrend Dominance
Conversely, the bearish argument is compelling, primarily driven by the persistent concerns over global demand and the clear downtrend established on the daily timeframe. Analysts are warning that China's oil demand may never fully recover, citing potential long-term structural changes and demand destruction. This outlook casts a long shadow over the energy market, suggesting that any bullish geopolitical-driven rallies might be short-lived. The daily chart paints a stark picture: a strong downtrend with an ADX reading of 27.76 indicates a firmly established bearish momentum. The price is trading below the middle Bollinger Band, and the MACD is firmly in negative territory, reinforcing the bearish sentiment. The RSI at 28.48 is deep in oversold territory, which, while historically suggesting a potential bounce, also signifies significant selling pressure.
The immediate support levels at $78.96, $77.77, and $76.96 are critical. A decisive break below $78.96 would invalidate any immediate bullish hopes and likely trigger further selling, potentially accelerating towards the $77.77 mark. The correlation with broader market sentiment also plays a role. While the S&P 500 and Nasdaq are showing signs of strength (1H and 4H bullish trends), the daily trend for both remains weak or neutral, indicating underlying fragility. If risk appetite were to falter, capital would likely flow away from commodities like oil. Furthermore, the news regarding the US and Iran reaching a framework deal, even if preliminary, could reduce immediate geopolitical risk premiums. While the Strait of Hormuz remains a concern, any perceived de-escalation could lead to a rapid unwinding of long positions.
The technical indicators on longer timeframes are predominantly bearish. The 4-hour chart, despite some conflicting signals like a Stochastic crossover, maintains a strong downtrend with an ADX of 29.61 and the price below its middle Bollinger Band. The daily Stochastic is also in oversold territory but showing a bearish crossover (%K
Navigating the Crosscurrents: Technicals as the Tiebreaker
In this tug-of-war between geopolitical supply fears and demand-side concerns, technical analysis provides the most objective framework for decision-making. The daily chart's persistent downtrend, underscored by a strong ADX of 27.76 and bearish MACD, suggests that the path of least resistance is currently downwards. However, the oversold RSI (28.48) and the proximity to the lower Bollinger Band ($78.18) on the daily chart cannot be ignored. This creates a classic divergence: a strong trend but an oversold condition, hinting at a potential for a short-term reversal or at least a significant pause in the downtrend.
The 1-hour chart offers a more constructive picture for bulls, with a neutral trend but some bullish leaning indicators like the Stochastic crossover. A sustained push above $78.87, confirmed by increasing volume, could signal the beginning of a short-covering rally. The key would be holding above the $78.96 support level, which has acted as a significant psychological and technical barrier. If this level fails, the bearish case gains significant traction, potentially leading to a rapid decline towards $77.77. The 4-hour chart presents a mixed bag, with a strong downtrend signal from ADX (29.61) but a MACD that has turned positive, indicating a potential shift in momentum. This ambiguity underscores the need for caution.
The ADX indicator across all timeframes provides crucial context. On the 1-hour chart, it's a weak 11.62, suggesting a lack of commitment in the current move. On the 4-hour, it rises to 29.61, indicating a stronger trend, and on the daily, it sits at 27.76, also pointing to a significant trend. The conflicting signals between shorter-term bullish setups (Stochastic, MACD on 1H) and longer-term bearish dominance (Daily RSI, MACD, ADX) mean that confirmation is paramount. A break above immediate resistance levels, coupled with increasing volume and a hold above key support, would be needed to confirm a bullish reversal. Conversely, a decisive break below $78.96 would confirm the bearish thesis.
The recent news flow also adds complexity. While the Strait of Hormuz remains a persistent risk, the reports of a potential US-Iran framework deal could temporarily ease supply fears. If this de-escalation gains traction, it would remove a significant bullish catalyst from the market, potentially accelerating the downtrend dictated by weaker demand fundamentals. The interplay between these geopolitical narratives and the underlying demand picture will be crucial in determining the short-to-medium term direction of Brent crude.
The Verdict: Cautious Optimism with a Bearish Lean
Considering the confluence of technical signals and fundamental drivers, the outlook for Brent crude remains cautiously optimistic but with a discernible bearish lean in the short-to-medium term. The strong downtrend on the daily chart, supported by weak demand forecasts, particularly from China, presents a significant headwind. The ADX values on the 4-hour and daily charts (29.61 and 27.76 respectively) confirm that a trend is indeed in play, and it is currently against the bulls. The oversold RSI on the daily chart (28.48) offers a potential for a bounce, but this is more likely to be a corrective move within the larger downtrend rather than a sustained reversal, unless accompanied by significant positive catalysts.
The immediate support at $78.96 is the linchpin. A failure to hold this level would likely trigger a cascade of stop-losses and accelerate the decline towards $77.77. On the upside, a convincing break above the $78.87 resistance, followed by consolidation above $79.00, would be required to signal a potential shift. However, the prevailing sentiment, driven by macroeconomic uncertainty and demand concerns, makes such a scenario less probable in the immediate future. The geopolitical risk premium, while present, might not be enough to entirely counteract the fundamental weakness if demand continues to falter.
Therefore, the most probable scenario involves continued volatility, with the potential for a short-term bounce from current levels towards the $79-$80 region, followed by a resumption of the downtrend if key supports break. Traders should remain vigilant, prioritizing risk management and seeking confirmation before committing to positions. The market is currently balancing the immediate threat of supply disruption against the longer-term specter of demand weakness, a delicate equilibrium that is unlikely to resolve without further significant news or data releases.
Bearish Scenario: Breakdown Below Support
65% ProbabilityBullish Scenario: Support Holds, Rebound Initiated
25% ProbabilityNeutral Scenario: Consolidation Around $78.50
10% ProbabilityFrequently Asked Questions: BRENT Analysis
What happens if BRENT breaks below the $78.96 support level?
A break below $78.96 would likely invalidate the bullish scenario and confirm the bearish trend. This could trigger further selling, with potential targets at $77.77 and subsequently $76.96 as the market reacts to the confirmed downtrend.
Should I buy BRENT at current levels around $78.50 given the oversold RSI on the daily chart?
Buying solely based on the daily oversold RSI (28.48) is risky without confirmation. A more prudent approach involves waiting for price action to hold above $78.96 and break resistance at $78.87, signaling a higher probability bullish setup with targets at $79.92.
Is the ADX at 27.76 on the daily chart a sell signal for BRENT right now?
An ADX of 27.76 indicates a strong downtrend is in place on the daily chart, which generally supports bearish positions. However, it doesn't automatically signal a 'sell' but rather confirms the strength of the existing trend, suggesting caution for long entries and potential opportunities on the short side if other indicators align.
How will potential de-escalation in US-Iran relations affect BRENT this week?
Any perceived de-escalation in US-Iran relations could reduce the geopolitical risk premium embedded in oil prices, potentially leading to a short-term price decline. This could accelerate the bearish trend if demand concerns remain dominant, pushing BRENT towards lower support levels.
Volatility creates opportunity - those prepared will be rewarded. Patience and discipline in managing risk are key as the market navigates these complex crosscurrents.
Time Horizon: This analysis is primarily focused on short-to-medium term trading opportunities, with consideration for the daily trend.
| Indicator | Value | Signal | Interpretation |
|---|---|---|---|
| RSI (14) | 43.7 | Neutral | Moving away from oversold on daily, but still weak. |
| MACD Histogram | -0.45 | Bearish | Negative momentum persists on daily chart. |
| Stochastic %K | 35.07 | Neutral | Crossed up from oversold on 1H, but needs confirmation. |
| ADX | 27.76 | Strong Trend | Confirms a strong downtrend on the daily chart. |
| Bollinger Bands | Middle Band | Watch | Price is below middle band on daily, suggesting bearish pressure. |
The market is currently balancing on a knife's edge, with geopolitical risks providing a floor while demand concerns threaten to pull prices lower. The $78.50 level represents a critical battleground. For bulls to regain control, they must defend the $78.96 support and push through immediate resistance hurdles, ideally with increasing volume and conviction. Conversely, a failure at these key levels would likely see prices re-test lower bounds, driven by persistent demand weakness and potentially easing geopolitical tensions. Traders should exercise caution, prioritize risk management, and await clearer signals before committing significant capital. The market always provides another opportunity; patience and a well-defined strategy are paramount.
Track markets in real-time
AI-powered analysis, technical indicators and real-time price data.
Join Our Telegram Channel
Breaking market news, AI analysis and trading signals instantly.
Join Channel