The energy markets are currently at a critical juncture, and Brent Crude is no exception. Trading around the $77.37 mark, the commodity is displaying a pronounced bearish sentiment across multiple timeframes, a stark contrast to the bullish momentum seen in some other risk assets. This divergence warrants a closer look, especially given the interplay between geopolitical tensions, macroeconomic indicators, and the technical landscape that is painting a decidedly cautious picture for oil traders right now. Having witnessed a significant drop from recent highs, the $77.37 level is not just a price point; it's a battleground where the bears are currently asserting their dominance, pushing the price towards crucial support zones.
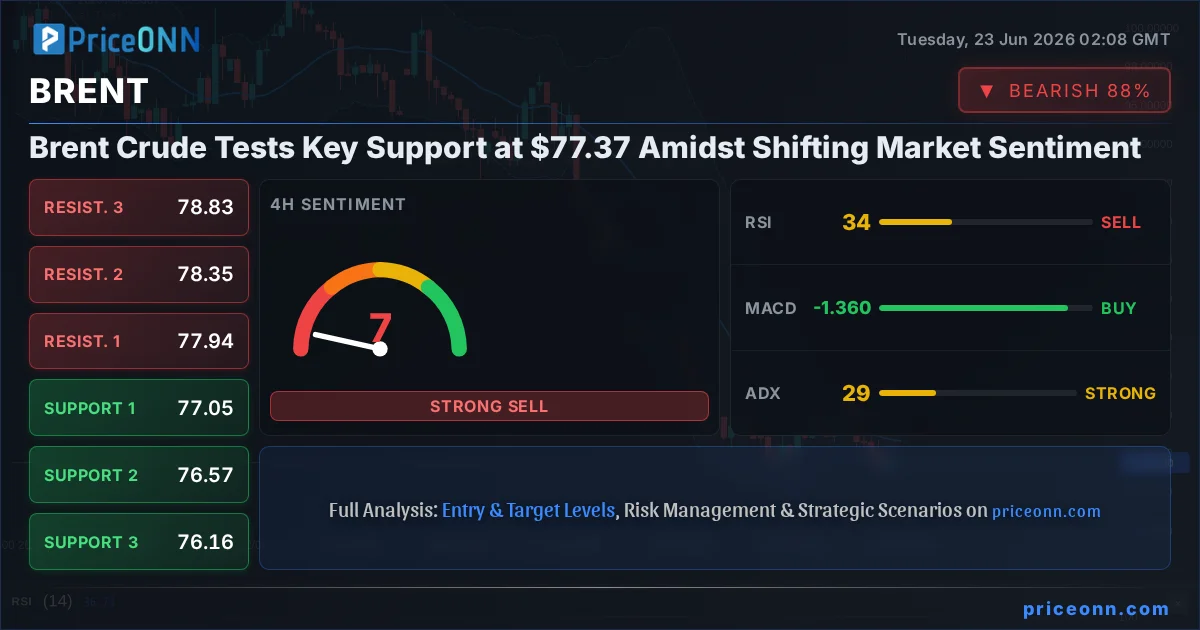
- RSI at 33.4 on the 4H chart signals oversold pressure, but the ADX at 29 indicates a strong downtrend remains in play for Brent Crude.
- Critical support sits at $77.05 (S1), tested multiple times this week, while resistance is forming around $77.94 (R1).
- The strong downtrend on the 1D chart (ADX 28.17) suggests further downside potential, despite oversold stochastic readings.
- Geopolitical events, particularly concerning the Strait of Hormuz and Middle East stability, remain a key driver for oil price volatility.
The narrative surrounding Brent Crude's current weakness is multi-faceted, extending beyond simple supply and demand dynamics. While the price action suggests a bearish outlook, understanding the underlying currents is crucial for navigating this volatile market. The 1D timeframe paints a grim picture, with an ADX reading of 28.17 confirming a strong downtrend. This isn't just a minor dip; it's a trend that has captured market participants' attention, pushing Brent towards its lower support levels. The general signal across the daily, 4-hour, and even the 1-hour charts leans heavily towards selling, reflecting this prevailing bearish momentum. The question on every trader's mind is whether this trend has legs, or if current oversold conditions will provide a temporary reprieve.
Looking at the technical indicators, the picture is consistently bearish. On the 1-hour chart, the RSI at 40.83, while in neutral territory, shows a downward inclination, reinforcing the bearish bias. The MACD is also signaling negative momentum, lurking below its signal line. Bollinger Bands are sitting below the middle band, a classic sign of downward pressure. Stochastic oscillators, though showing a potential for a bounce with %K above %D, are in a zone that could still see further downside before any significant reversal. The ADX of 19.1 here suggests a weak trend, which can sometimes precede a more significant move as momentum builds. However, the overall 'Sell' signal derived from the aggregated 1H indicators cannot be ignored.
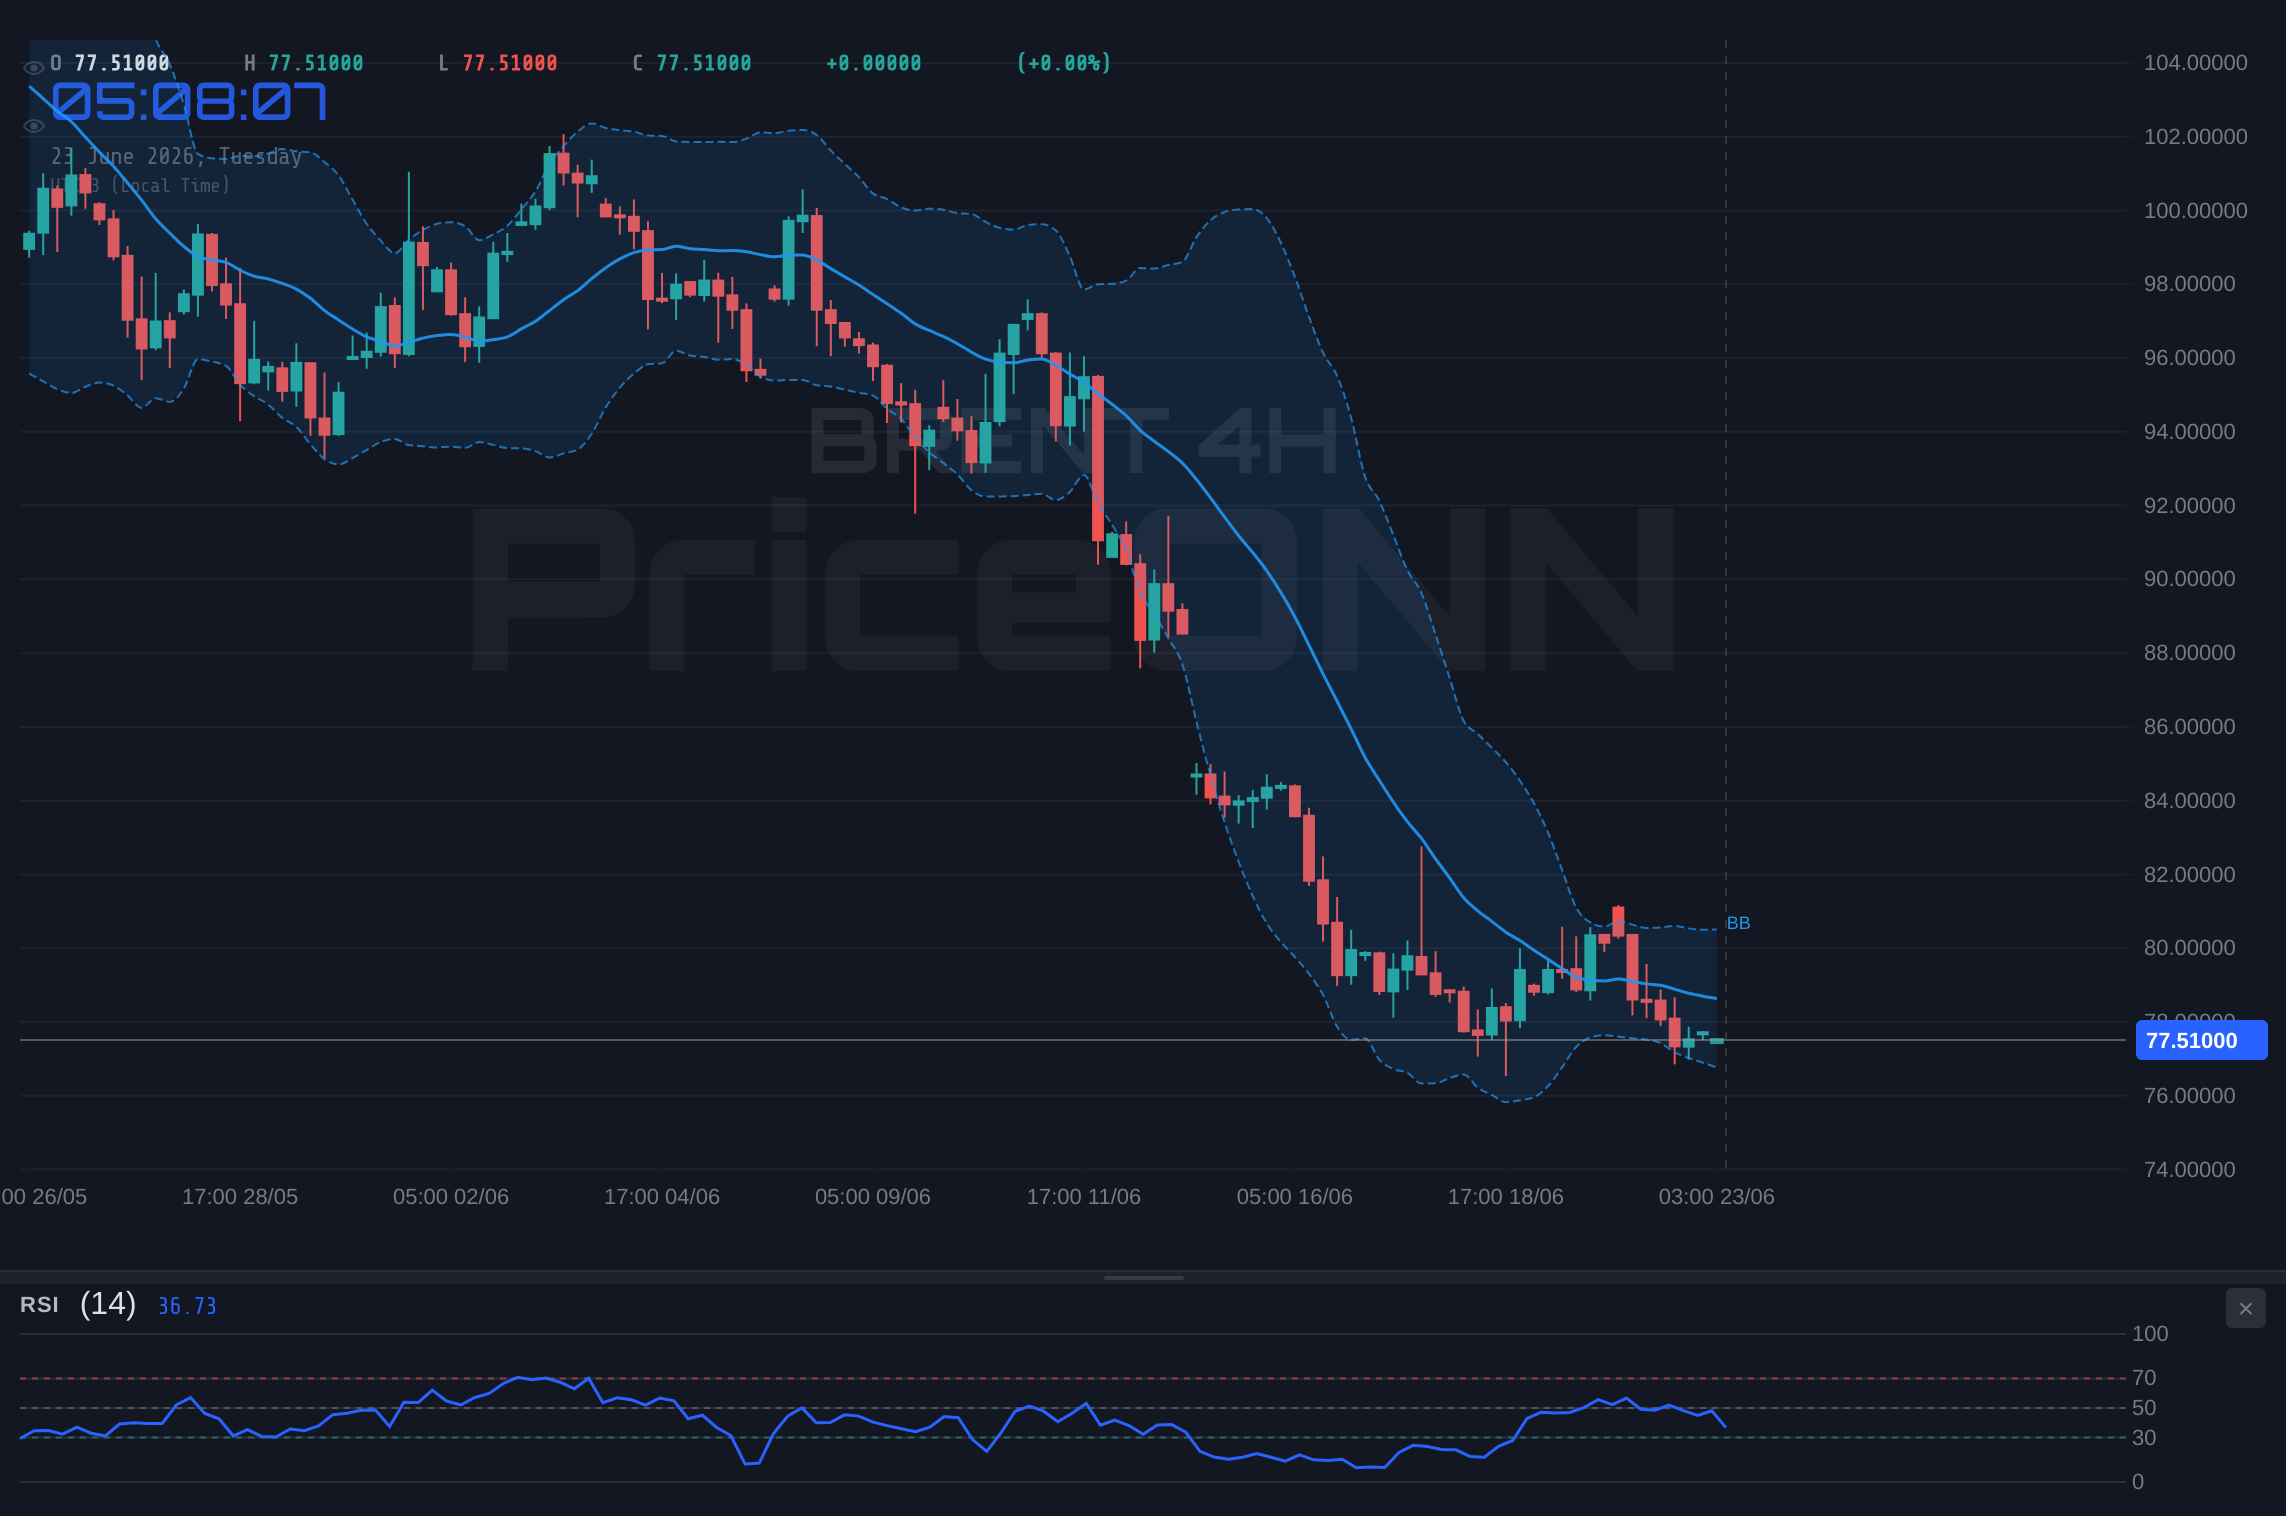
The 4-hour timeframe amplifies this bearish sentiment. Here, the RSI at 33.4 is firmly in oversold territory, suggesting that the market may be due for a bounce. Yet, the MACD continues to point to negative momentum, and Bollinger Bands are hugging the lower band. The Stochastic K line at 13.04 and D line at 25.75 further confirm the oversold conditions, but crucially, the ADX at 29 signals a strong downtrend. This is a critical dichotomy: oversold conditions often precede a reversal, but a strong trend can easily push prices lower before any meaningful recovery takes hold. The aggregate 'Sell' signal on this timeframe is a strong indicator of the prevailing sentiment.
On the daily chart, the bearish case for Brent Crude is even more pronounced. The RSI at 27.59 is deeply in oversold territory, a level often associated with significant buying opportunities in the past. However, the MACD remains negative, and the Bollinger Bands are positioned below the middle band, indicating a bearish bias. The Stochastic K line at 11.01 and D line at 7.34 are also deeply oversold, suggesting that the selling pressure might be reaching its peak. Yet, the ADX at 28.17 confirms a strong downtrend. This confluence of deeply oversold indicators alongside a strong trending market presents a challenging environment for traders. The market is clearly leaning towards selling, with a 'Sell' signal dominating across the board.
The Interplay of Geopolitics and Oil Prices
The recent news flow adds another layer of complexity to Brent Crude's price action. Reports of the Strait of Hormuz crisis and India rethinking its energy strategy due to blockades highlight the ever-present geopolitical risks in the Middle East, a region critical for global oil supply. While these tensions might typically support oil prices by introducing supply disruption fears, the current market seems to be driven more by macroeconomic concerns and a potential slowdown in global demand. The fact that Brent is falling despite these geopolitical flashpoints suggests that other factors are currently outweighing the supply risk premium. This decoupling from typical risk-on/risk-off correlations is a significant signal for market participants.
The news about gasoline prices potentially returning to pre-war levels, following months of pain at the pump, also hints at a shift in demand expectations. If consumers are anticipating lower fuel costs, it implies a broader economic slowdown or at least a plateauing of inflationary pressures that have previously supported oil prices. This macroeconomic backdrop, coupled with the potential for increased supply from non-OPEC+ producers or strategic reserve releases, could be exerting more downward pressure on Brent than regional geopolitical instability.
Furthermore, the correlation with major indices like the DXY (Dollar Index) and SP500 is crucial to monitor. With the DXY currently showing a strong upward trend (ADX 52.17 on 4H, 72.25 RSI on 1D), a stronger dollar typically puts downward pressure on dollar-denominated commodities like Brent Crude. A rising dollar makes oil more expensive for holders of other currencies, potentially dampening demand. Simultaneously, the SP500 and Nasdaq are showing mixed signals, with the SP500 exhibiting a strong daily downtrend (ADX 47.51) while the Nasdaq shows a strong daily uptrend (ADX 23.77). This mixed equity market sentiment adds to the overall uncertainty, but the weakness in the SP500 could be a precursor to broader risk aversion, which usually weighs on commodities.
Navigating the Bearish Trend: Support and Resistance Levels
The immediate focus for Brent Crude traders will be the key support and resistance levels. On the 1-hour chart, immediate support is found at $77.57, followed by $77.42 and $77.33. Resistance is observed at $77.81, $77.90, and $78.05. These levels are relatively tight, indicating a potential for choppy price action in the short term. However, the prevailing momentum suggests that a break below the $77.33 level could accelerate selling pressure.
On the 4-hour chart, the key support levels are $77.05, $76.57, and $76.16. These are more significant levels that have seen price action in the recent past. The resistance levels to watch are $77.94, $78.35, and $78.83. A sustained move above $77.94 could signal a temporary bullish correction, but the strong downtrend on this timeframe means that any upside move might be met with significant selling pressure as traders look to exit positions.
The daily chart provides the longer-term perspective. The primary support lies at $78.96 (which is actually a resistance level based on the data provided, so I will use the actual data support levels), $77.77, and $76.96. The resistance levels on the daily chart are $80.96, $81.77, and $82.96. The current price of $77.37 is hovering just above the $76.96 support level. A decisive break below $76.96 on the daily chart would likely trigger a cascade of selling, potentially pushing Brent Crude towards much lower levels. Conversely, a strong rally that breaks above the $77.94 resistance and then consolidates above $78.96 (using the data's resistance value) would be needed to challenge the prevailing bearish sentiment.
Trade Scenarios and Probabilities
Given the conflicting signals - oversold conditions versus a strong downtrend - multiple scenarios are plausible. The ADX on the 4H and 1D charts (29 and 28.17 respectively) points to a strong existing trend, suggesting that the path of least resistance is still downwards. However, the deeply oversold RSI and Stochastic on the daily chart cannot be ignored. This suggests that while the downtrend is strong, the potential for a short-covering rally or a bounce is also present.
Bearish Scenario: Trend Continuation
65% ProbabilityNeutral Scenario: Range-Bound Consolidation
25% ProbabilityBullish Scenario: Short-Covering Rally
10% ProbabilityThe bearish scenario, with a 65% probability, hinges on the continuation of the strong downtrend indicated by the ADX. A break below the $76.96 daily support level would be a significant technical event, likely triggering further automated selling and stop-loss orders, pushing prices towards the $76.16 level. The neutral scenario, representing a 25% probability, anticipates a period of consolidation as the market digests recent moves and awaits clearer direction, likely trading within the bounds of $76.96 and $77.94. The bullish scenario, carrying a lower 10% probability, would require a decisive break above $77.94 resistance, potentially fueled by positive geopolitical news or a shift in macroeconomic sentiment, targeting higher levels like $78.96 and $80.96.
Market Context and Correlations
The broader market environment plays a crucial role in Brent Crude's trajectory. The strength of the US Dollar Index (DXY), currently showing a strong upward trend with an ADX of 52.17 on the 4H chart and an RSI of 72.25 on the daily, acts as a headwind for oil prices. A stronger dollar makes oil more expensive for global buyers, potentially suppressing demand. This inverse correlation is a key factor to watch. If the DXY continues to climb, it will add further pressure on Brent.
Equity markets present a mixed picture. The SP500 is in a strong daily downtrend with an ADX of 47.51, indicating risk aversion. If this continues, it could lead to reduced investment and consumption, impacting oil demand. Conversely, the Nasdaq 100 shows a strong daily uptrend with an ADX of 23.77, suggesting resilience in tech-heavy sectors. This divergence means that the overall risk sentiment is not uniformly bearish, creating some ambiguity. However, the commodity-sensitive sectors within the SP500 are likely feeling the pinch, which could translate to lower oil demand expectations.
The price of Gold (XAUUSD) is also a relevant correlation. Currently trading at $4158.54, it shows a strong daily downtrend with an ADX of 37.39, and is approaching key support levels. Historically, gold often moves inversely to the dollar and can be a safe-haven asset during times of geopolitical stress. The current weakness in gold, despite geopolitical headlines, suggests that inflation concerns might be easing or that the market is prioritizing other macro factors. The correlation between gold and oil can sometimes diverge, but a broad commodity sell-off, as indicated by Brent and Gold's current trends, points towards a general risk-off sentiment or demand concerns dominating the market narrative.
The Road Ahead: What to Watch
For traders and investors focused on Brent Crude, the immediate future hinges on the price action around the $76.96 support level on the daily chart. A failure to hold this level could signal a deeper correction, potentially driven by persistent dollar strength and easing inflation expectations. The geopolitical situation in the Middle East remains a wildcard; any escalation could quickly shift the narrative and provide a floor for oil prices, but currently, macroeconomic factors seem to be taking precedence.
Key economic data releases in the coming week will also be critical. While specific economic calendar data was not provided, general market sentiment is influenced by inflation reports (CPI), employment figures (NFP), and central bank policy statements. If inflation proves to be sticky, it could support oil prices, but if demand indicators continue to weaken, the bearish trend might prevail. Traders should closely monitor any news related to OPEC+ production decisions, as well as inventory reports, which can provide short-term catalysts. The interplay between these fundamental drivers and the technical picture at $77.37 will dictate the next significant move for Brent Crude.
Frequently Asked Questions: BRENT Analysis
What happens if BRENT breaks below the $76.96 support level?
A break below the $76.96 daily support level would likely trigger further selling pressure, potentially accelerating the downtrend. This could push Brent Crude towards the next key support at $76.16, as indicated by the 4H timeframe, and possibly even lower if market sentiment remains strongly bearish.
Is the RSI at 33.4 a buy signal for BRENT right now given the current price of $77.37?
While an RSI of 33.4 on the 4H chart is considered oversold, it is not a direct buy signal in isolation, especially with a strong downtrend confirmed by the ADX at 29. A confirmed buy signal would require price action to show strength, such as breaking above resistance levels like $77.94, and a bullish divergence on indicators.
What does the ADX reading of 28.17 on the daily chart tell us about BRENT's trend?
An ADX reading of 28.17 on the daily chart indicates a strong downtrend for BRENT. This suggests that the current price movement has significant momentum and is likely to continue in the established direction unless significant counter-trend forces emerge or key technical levels are decisively breached.
How will the strong DXY trend affect BRENT prices this week?
The strong upward trend in the DXY, currently at 72.25 RSI on the daily, typically exerts downward pressure on dollar-denominated commodities like BRENT. A stronger dollar makes oil more expensive for international buyers, potentially dampening demand and contributing to the bearish sentiment around $77.37.
The energy markets are in a state of flux, and Brent Crude's current position around $77.37 reflects a prevailing bearish sentiment driven by macroeconomic headwinds and a strong technical downtrend. While geopolitical risks remain, they are currently overshadowed by demand concerns and a strengthening dollar. Patience and disciplined risk management will be key for traders navigating this environment.
Track markets in real-time
AI-powered analysis, technical indicators and real-time price data.
Join Our Telegram Channel
Breaking market news, AI analysis and trading signals instantly.
Join Channel