The global financial landscape is currently a complex tapestry of shifting central bank policies, geopolitical undercurrents, and evolving risk appetites. In this intricate environment, energy markets, particularly crude oil, are highly sensitive barometers of broader economic health and sentiment. Today, our focus is on Brent crude, currently hovering around the critical $76.08 mark. This level is not just a number; it represents a significant confluence of technical support and a potential inflection point shaped by macro forces. The recent strength in the US Dollar Index (DXY) and a palpable risk-off sentiment across major indices like the S&P 500 and Nasdaq are exerting downward pressure, creating a challenging backdrop for oil prices. Understanding how these interconnected markets influence Brent is key to navigating the current volatility.
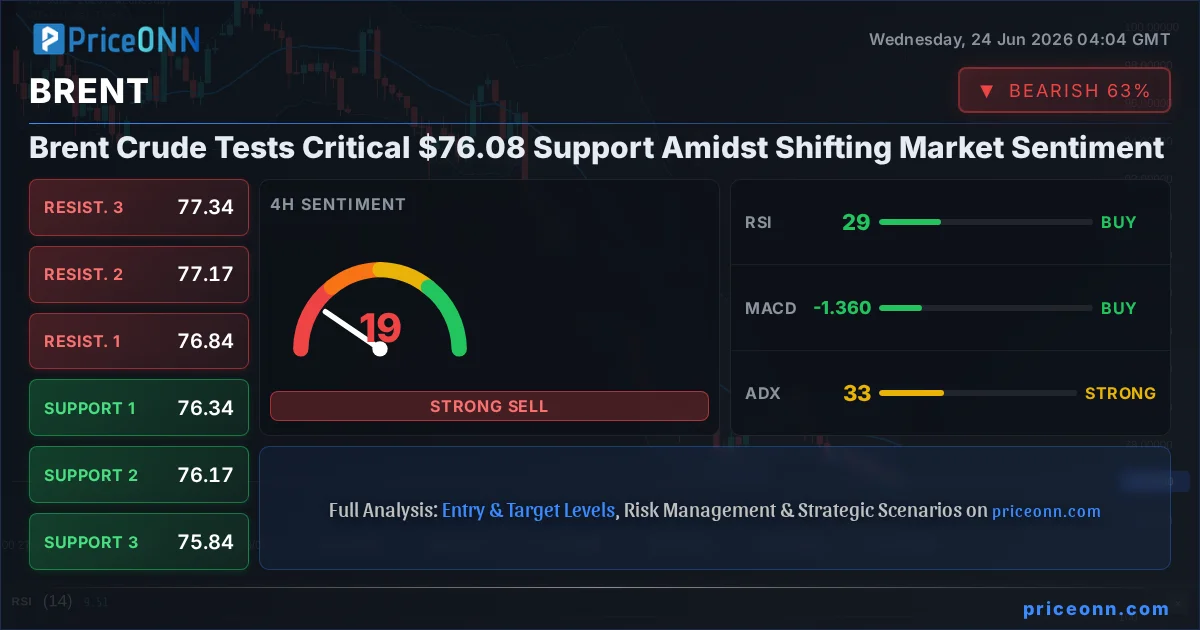
- Brent crude is currently trading at $76.08, testing a key support level.
- The US Dollar Index (DXY) is strong, currently at 101.50, putting pressure on commodities.
- Technical indicators on Brent show a strong downtrend (ADX 32.54 on 4H, RSI below 30 on multiple timeframes), suggesting further downside potential.
- Oversold conditions, particularly on the 4H and 1D RSI (28.93 and 26.53 respectively), suggest a potential for a short-term bounce or consolidation.
- Geopolitical tensions and inflation expectations remain underlying factors for oil prices.
The Macroeconomic Crosscurrents Driving Brent Lower
The narrative for Brent crude at $76.08 is deeply intertwined with the broader macroeconomic picture. A significant driver has been the resurgent strength of the US Dollar. With the DXY currently at 101.50, climbing steadily, it casts a shadow over dollar-denominated commodities like oil. A stronger dollar inherently makes oil more expensive for holders of other currencies, potentially dampening demand. Furthermore, the DXY's upward trajectory often signals a 'risk-off' environment, where investors flock to perceived safe-haven assets, pulling capital away from riskier commodities and equities. This is visibly reflected in the performance of major stock indices; the S&P 500, trading around 6572.87, and the Nasdaq, at 29420.19, are showing signs of struggle, indicating that speculative capital is becoming more cautious. This broader market hesitancy directly impacts oil, as demand forecasts are often tied to economic growth expectations, which tend to falter in risk-averse periods.
Central bank policies are also playing a crucial role. While specific central bank actions were not detailed in the provided data, the general trend of monetary policy tightening globally, or the anticipation of it, tends to strengthen currencies like the dollar. This tightening cycle aims to curb inflation, but it can also lead to slower economic growth, thereby reducing demand for energy. If the Federal Reserve, for instance, maintains a hawkish stance or signals further rate hikes, it would likely bolster the DXY further and continue to pressure Brent. The delicate balance between controlling inflation and avoiding a recession is a tightrope walk that directly impacts commodity pricing, with Brent being a prime example of an asset highly sensitive to these macro shifts.
Geopolitical risks, while not explicitly detailed in the live data feed, are never far from the surface in the energy markets. Historically, tensions in major oil-producing regions can quickly spike prices due to supply disruption fears. However, in the current climate, the dominant narrative seems to be driven more by demand concerns stemming from a slowing global economy and a strong dollar. The absence of immediate, acute supply-side shocks allows the macroeconomic headwinds to take center stage. Nevertheless, any unexpected escalation in geopolitical flashpoints could rapidly alter the price trajectory, introducing volatility and potentially overriding the current bearish momentum driven by macro factors.
Technical Breakdown: Brent Crude at the Crossroads
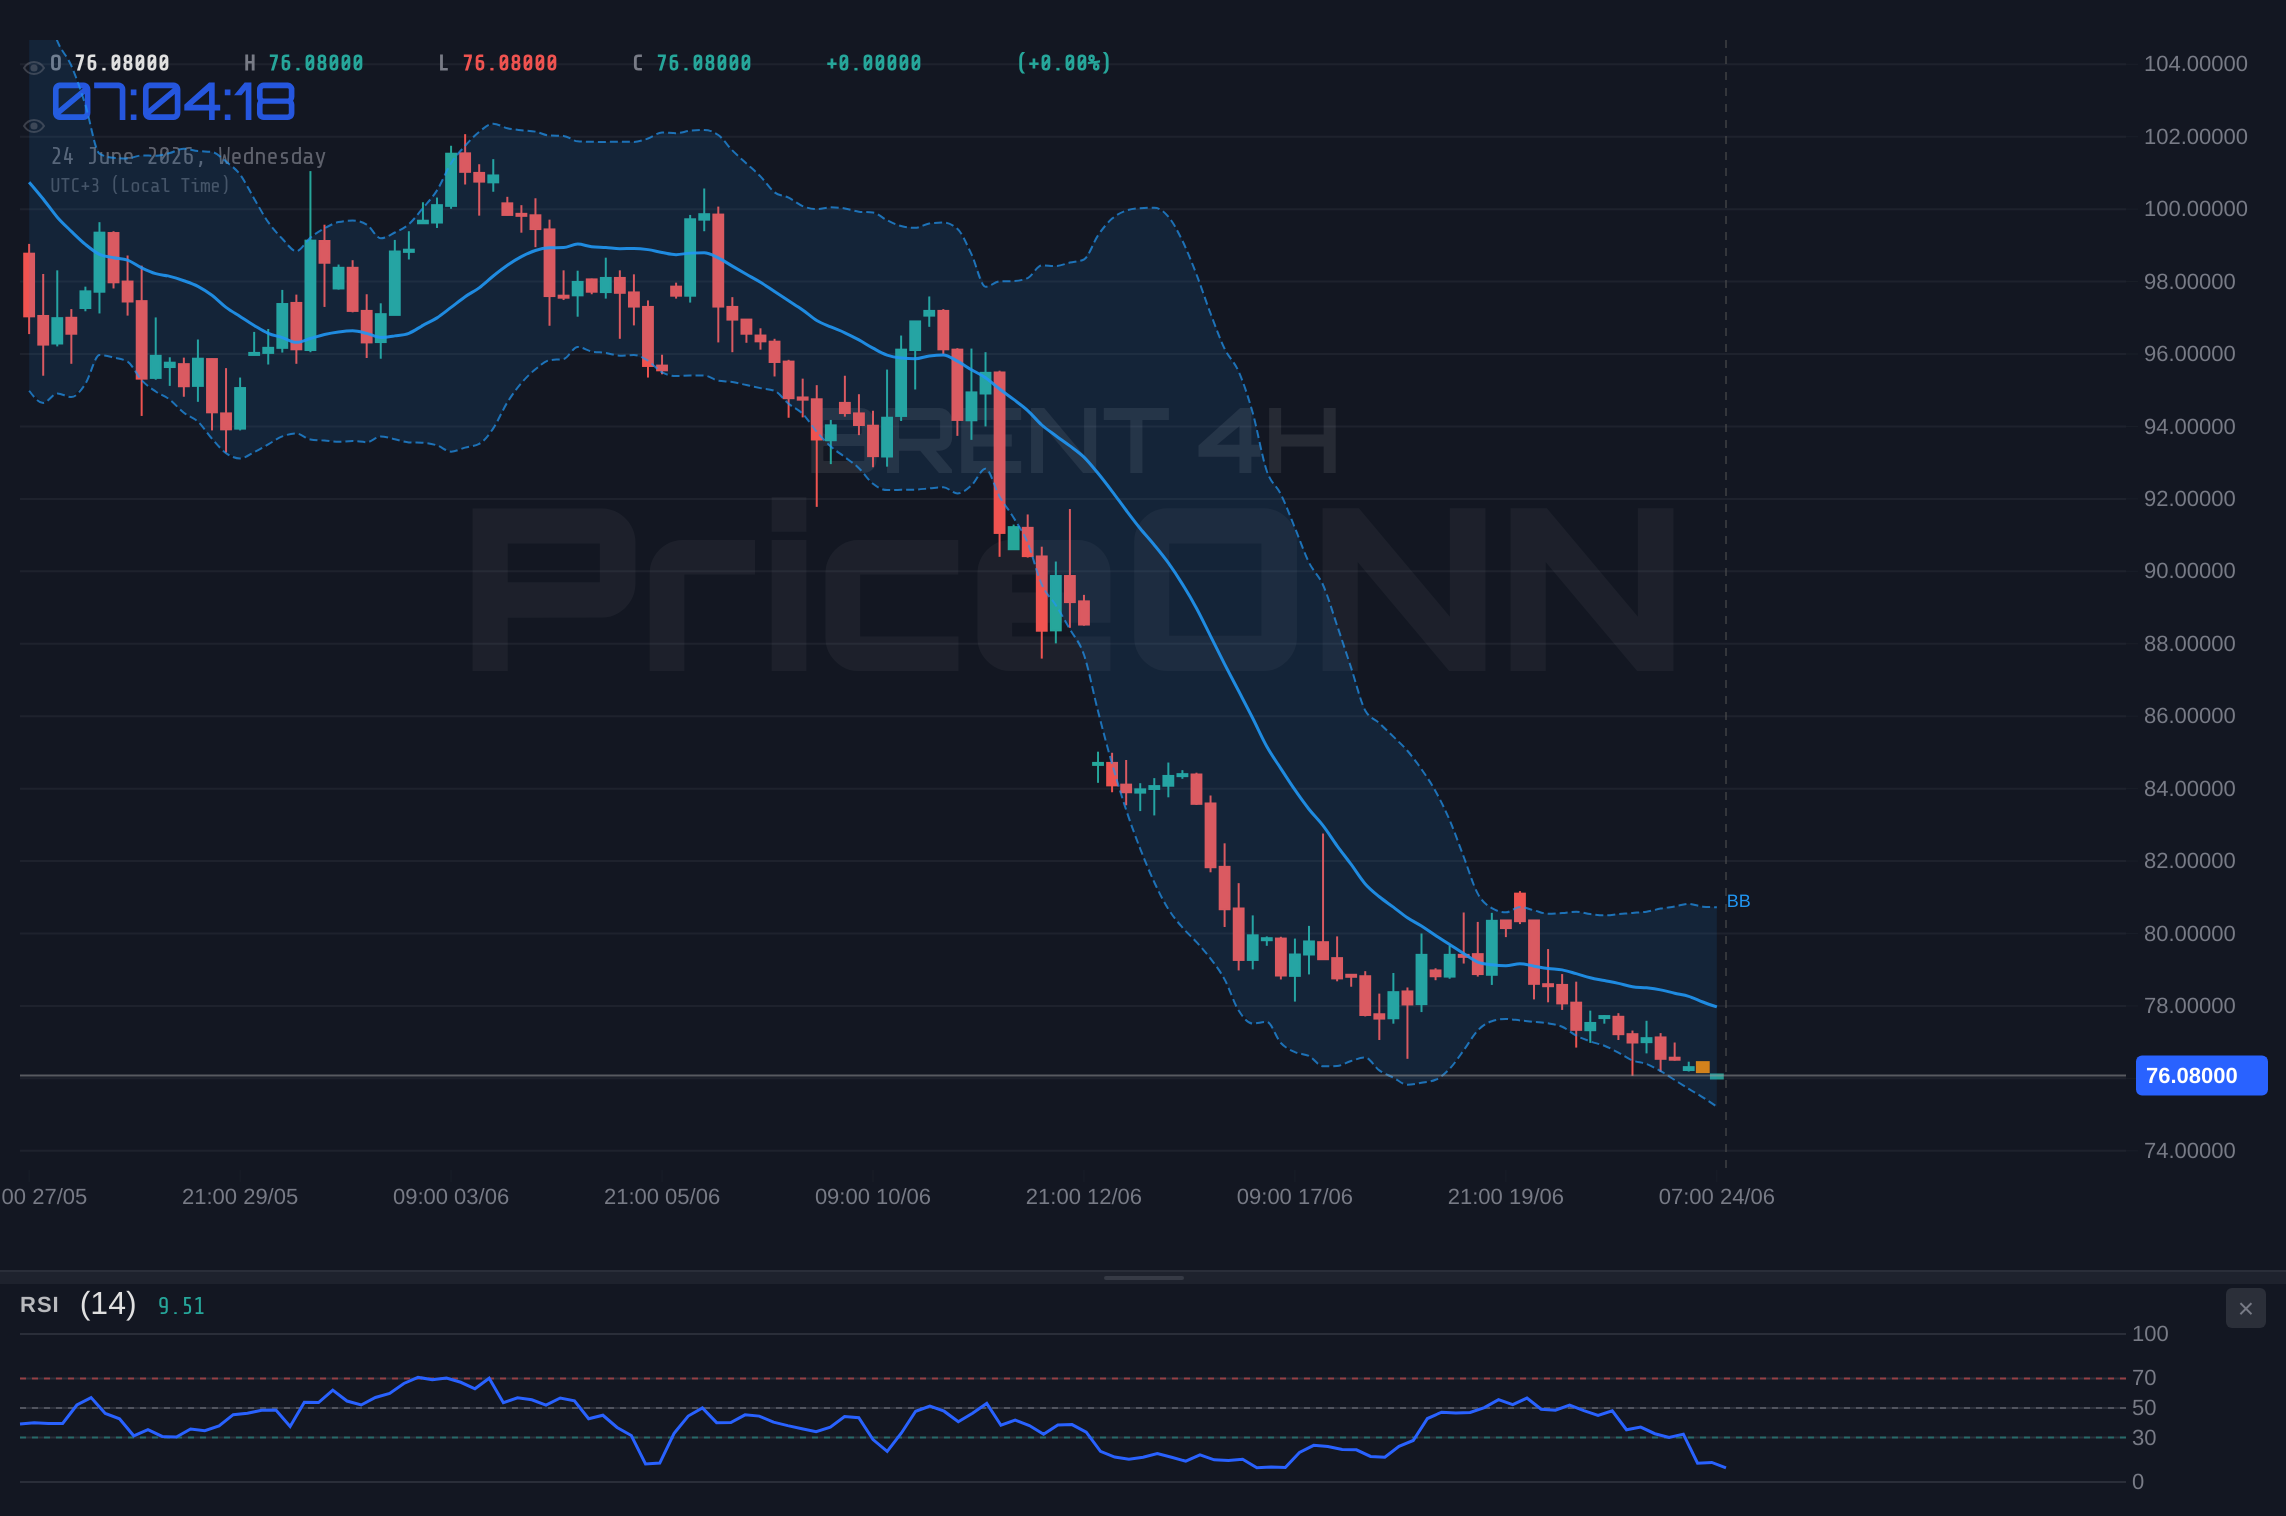
Delving into the technical indicators for Brent crude reveals a market firmly entrenched in a downtrend, but showing signs of exhaustion. On the 1-hour chart, the trend is decisively bearish with 100% strength, indicated by an ADX reading of 32.54. The RSI at 37.35 suggests a move away from oversold territory but still indicates bearish momentum. However, looking at the 4-hour timeframe, the picture becomes more nuanced. The ADX remains strong at 32.54, confirming a robust downtrend. Yet, the RSI has plunged to 28.93, firmly in oversold territory. This divergence - a strong trend accompanied by extreme oversold conditions - often signals a potential for a pause or a short-term reversal. Similarly, on the daily chart, the RSI is at 26.53, also deeply oversold, while the ADX at 31.47 still points to a strong downward trend. This confluence of oversold readings across multiple timeframes, despite the prevailing bearish trend, is what traders watch closely for potential tactical opportunities.
The Stochastic oscillator further supports the oversold narrative. On the 1-hour chart, K=19.92 and D=24.51 show a bearish signal (%K
The key support levels to watch are clearly defined in the data: S1 at $75.53, S2 at $75.30, and S3 at $74.87. A decisive break below $75.53 would signal a continuation of the sharp downtrend, potentially targeting the lower levels. Conversely, any signs of buyers stepping in around the $75.53 to $76.08 zone could lead to a technical bounce. The immediate resistance levels loom at $76.19 (R1), $76.62 (R2), and $76.85 (R3). A sustained move above $76.19 would be the first indication of a potential shift in short-term momentum, although a more significant bullish thesis would require breaking through R2 at $76.62 and ideally challenging R3 at $76.85.
Intermarket Correlations: DXY, Equities, and the Brent Equation
The relationship between Brent crude and the US Dollar Index (DXY) is a cornerstone of commodity market analysis. With the DXY currently at 101.50 and exhibiting a strong upward trend on all observed timeframes (1H, 4H, 1D), its influence on Brent is undeniable. This inverse correlation typically means that as the dollar strengthens, Brent crude faces headwinds. The DXY's strength is a powerful signal of global capital seeking refuge in the US currency, often at the expense of riskier assets and commodities. This dynamic is currently playing out, with Brent trading near its support levels while the DXY pushes higher. Any indication of a DXY pullback could provide immediate relief to Brent prices, offering a potential short-term buying opportunity.
The performance of US equity indices, specifically the S&P 500 and Nasdaq, also provides crucial context. The S&P 500, trading at 6572.87 with a strong 1H uptrend but a questionable 1D downtrend, and the Nasdaq at 29420.19, also showing mixed signals across timeframes, reflect a market grappling with uncertainty. A sustained decline in these indices typically correlates with a 'risk-off' sentiment, which, as mentioned, favors the US dollar and puts pressure on commodities like oil. If the equity markets continue to falter, it would reinforce the bearish case for Brent, suggesting that demand expectations are dimming. Conversely, a recovery in equities, perhaps spurred by a less hawkish Fed or positive economic surprises, could coincide with a weakening DXY and offer support to Brent.
Considering inflation is a critical element for oil prices. While specific inflation data was not provided, oil prices are often seen as both a cause and an effect of inflation. A sustained drop in oil prices, like the one currently pressuring Brent, can help alleviate inflationary pressures globally. This could influence central bank decisions, potentially leading to a less aggressive monetary policy stance in the future, which in turn could support economic growth and eventually oil demand. However, the current downward trend in Brent appears to be more driven by demand-side concerns and dollar strength than by a deliberate effort to combat inflation through lower energy prices. The interplay between oil prices, inflation, and monetary policy remains a complex feedback loop that investors must continuously monitor.
Navigating the Downtrend: Scenarios for Brent Crude
Given the current technical and macroeconomic backdrop, several scenarios are plausible for Brent crude. The prevailing momentum is bearish, with strong trend indicators and oversold conditions suggesting a potential for a short-term bounce, but the overarching macro pressures remain significant.
Bearish Scenario: Sustained Downtrend
65% ProbabilityNeutral Scenario: Consolidation and Range-Bound Trading
25% ProbabilityBullish Scenario: Short-Term Bounce
10% ProbabilityThe bearish scenario appears most probable given the confluence of strong dollar, risk-off sentiment, and persistent downtrend signals. A break below the immediate support at $75.53, the first support level on the 1H chart, would likely trigger a move towards $75.30 (S2) and potentially $74.87 (S3). This thesis remains valid as long as Brent fails to decisively break above the immediate resistance at $76.19 and, more importantly, fails to reclaim higher ground above $76.85. The oversold conditions, however, create a possibility for a short-term bounce. If buyers can defend the $75.53 level and push prices back above $76.19, we might see a move towards $76.62 (R2) and potentially higher. A neutral scenario would involve price action consolidating between the immediate support and resistance levels, reflecting indecision in the market.
What Lies Ahead: Watching Key Levels and Macro Triggers
For traders and investors monitoring Brent crude, the upcoming period requires a keen eye on both technical levels and macroeconomic developments. The $76.08 current price sits precariously close to the $75.53 support (S1). A break below this level would confirm the continuation of the bearish trend, potentially accelerating losses towards $75.30 and $74.87. On the upside, reclaiming the $76.19 resistance (R1) would be the first sign of stabilization, with a more robust bullish case requiring a push through $76.62 (R2) and $76.85 (R3). The strong ADX readings across timeframes (32.54 on 4H, 31.47 on 1D) indicate that any trend continuation or reversal will likely be significant.
Market sentiment, heavily influenced by the DXY's trajectory and equity market performance, will be paramount. A continued rise in the DXY above 101.50, coupled with weakness in the S&P 500 and Nasdaq, would reinforce the bearish outlook for Brent. Conversely, any signal of a Fed pivot or pause, or a significant de-escalation of geopolitical tensions, could weaken the dollar and boost risk appetite, potentially triggering a relief rally in oil prices. Investors should also remain attuned to any official statements from OPEC+ regarding production quotas, although the current price action suggests that macroeconomic factors are currently overshadowing supply-side considerations. Patience and disciplined risk management will be crucial in navigating these choppy waters.
What happens if Brent crude breaks below the $75.53 support level?
A break below the $75.53 support level would likely trigger further selling pressure, confirming the strong downtrend indicated by the ADX at 32.54. The next key targets would be $75.30 (S2) and potentially $74.87 (S3), reflecting a continuation of the bearish momentum driven by macro factors like dollar strength.
Is the current RSI reading of 28.93 on the 4H chart a buy signal for Brent at $76.08?
While an RSI of 28.93 is deeply oversold and suggests selling momentum may be exhausted, it is not a standalone buy signal. Given the strong downtrend (ADX 32.54) and bearish macro environment, it indicates a potential for a short-term bounce rather than a sustained trend reversal. Confirmation above resistance levels like $76.19 would be needed.
How is the strong DXY at 101.50 impacting Brent crude's price action around $76.08?
The strong DXY at 101.50 makes dollar-denominated Brent crude more expensive for holders of other currencies, thus suppressing demand. This inverse correlation is a significant headwind for oil prices, contributing to the bearish pressure seen as Brent tests its support levels near $76.08.
What is the outlook for Brent crude if the S&P 500 continues to decline from 6572.87?
A continued decline in the S&P 500 (currently at 6572.87) would likely signal a worsening risk-off sentiment, reinforcing the bearish case for Brent crude. This scenario would support further dollar strength and potentially lead to lower oil demand expectations, pushing Brent towards its support levels.
Track markets in real-time
AI-powered analysis, technical indicators and real-time price data.
Join Our Telegram Channel
Breaking market news, AI analysis and trading signals instantly.
Join Channel