The complex interplay of geopolitical tensions and evolving market sentiment has placed WTI crude oil under significant pressure, with the commodity currently trading around the critical $74.80 mark. This price point is not just a number; it represents a crucial juncture where the prevailing bearish trend is being tested against the persistent underlying dynamics of global energy supply and demand. While headlines often focus on the immediate price action, a deeper dive into the technical indicators and the broader geopolitical landscape reveals a nuanced picture for WTI, suggesting that the current downward momentum may have further room to run, contingent on key technical levels holding.
- RSI at 44.3 signals continued bearish pressure, indicating room for further declines before oversold conditions emerge.
- The critical support level at $74.22 is being eyed as a potential floor, but a decisive break below could accelerate downward movement.
- MACD shows positive momentum on the 1H chart, but this is counteracted by strong bearish signals across 4H and 1D timeframes, suggesting caution.
- Geopolitical developments, particularly those impacting Middle Eastern supply routes like the Strait of Hormuz, remain a key catalyst for potential volatility.
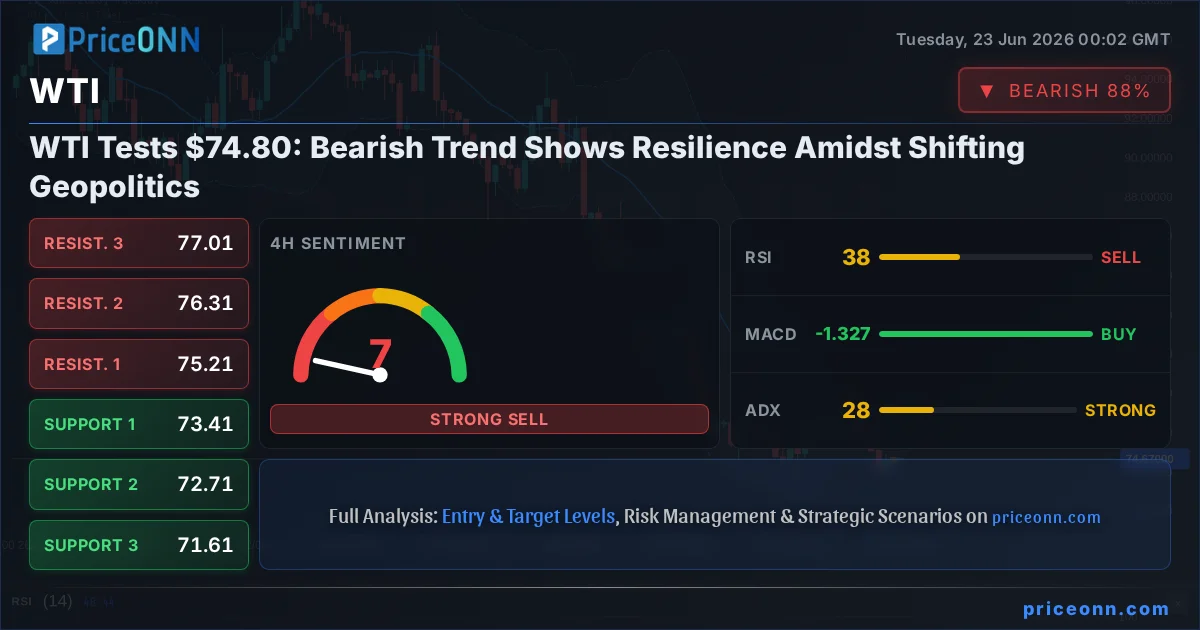
The narrative surrounding WTI has been dominated by a consistent bearish sentiment, a trend clearly reflected across multiple timeframes. On the daily chart, the ADX stands at a robust 24.73, confirming a firmly established downward trend. This is not merely a fleeting correction; it's a market that has been systematically pricing in lower levels. The RSI(14) at 30.14 on the daily timeframe further corroborates this, indicating that while the market is approaching oversold territory, the underlying bearish conviction remains strong. This suggests that any near-term bounces are likely to be met with selling pressure, rather than a fundamental shift in market direction. The MACD, while showing positive momentum on the 1-hour chart, is firmly below its signal line on the daily, reinforcing the prevailing downtrend. This divergence in short-term versus long-term indicators highlights the importance of a multi-timeframe approach to understanding WTI's current predicament.
Navigating the Bearish Current: Technical Indicators in Focus
Looking closer at the technical indicators, the picture for WTI remains predominantly bearish. On the 1-hour chart, the Stochastic oscillator, with K at 62.43 and D at 34.15, shows a bullish signal (%K > %D), suggesting a potential short-term upward correction. However, this is a localized signal within a broader bearish context. The Bollinger Bands are trading below the middle band, indicating downward pressure, and the ADX at 21.46 points to a moderate trend strength, not yet indicating a stalled market.
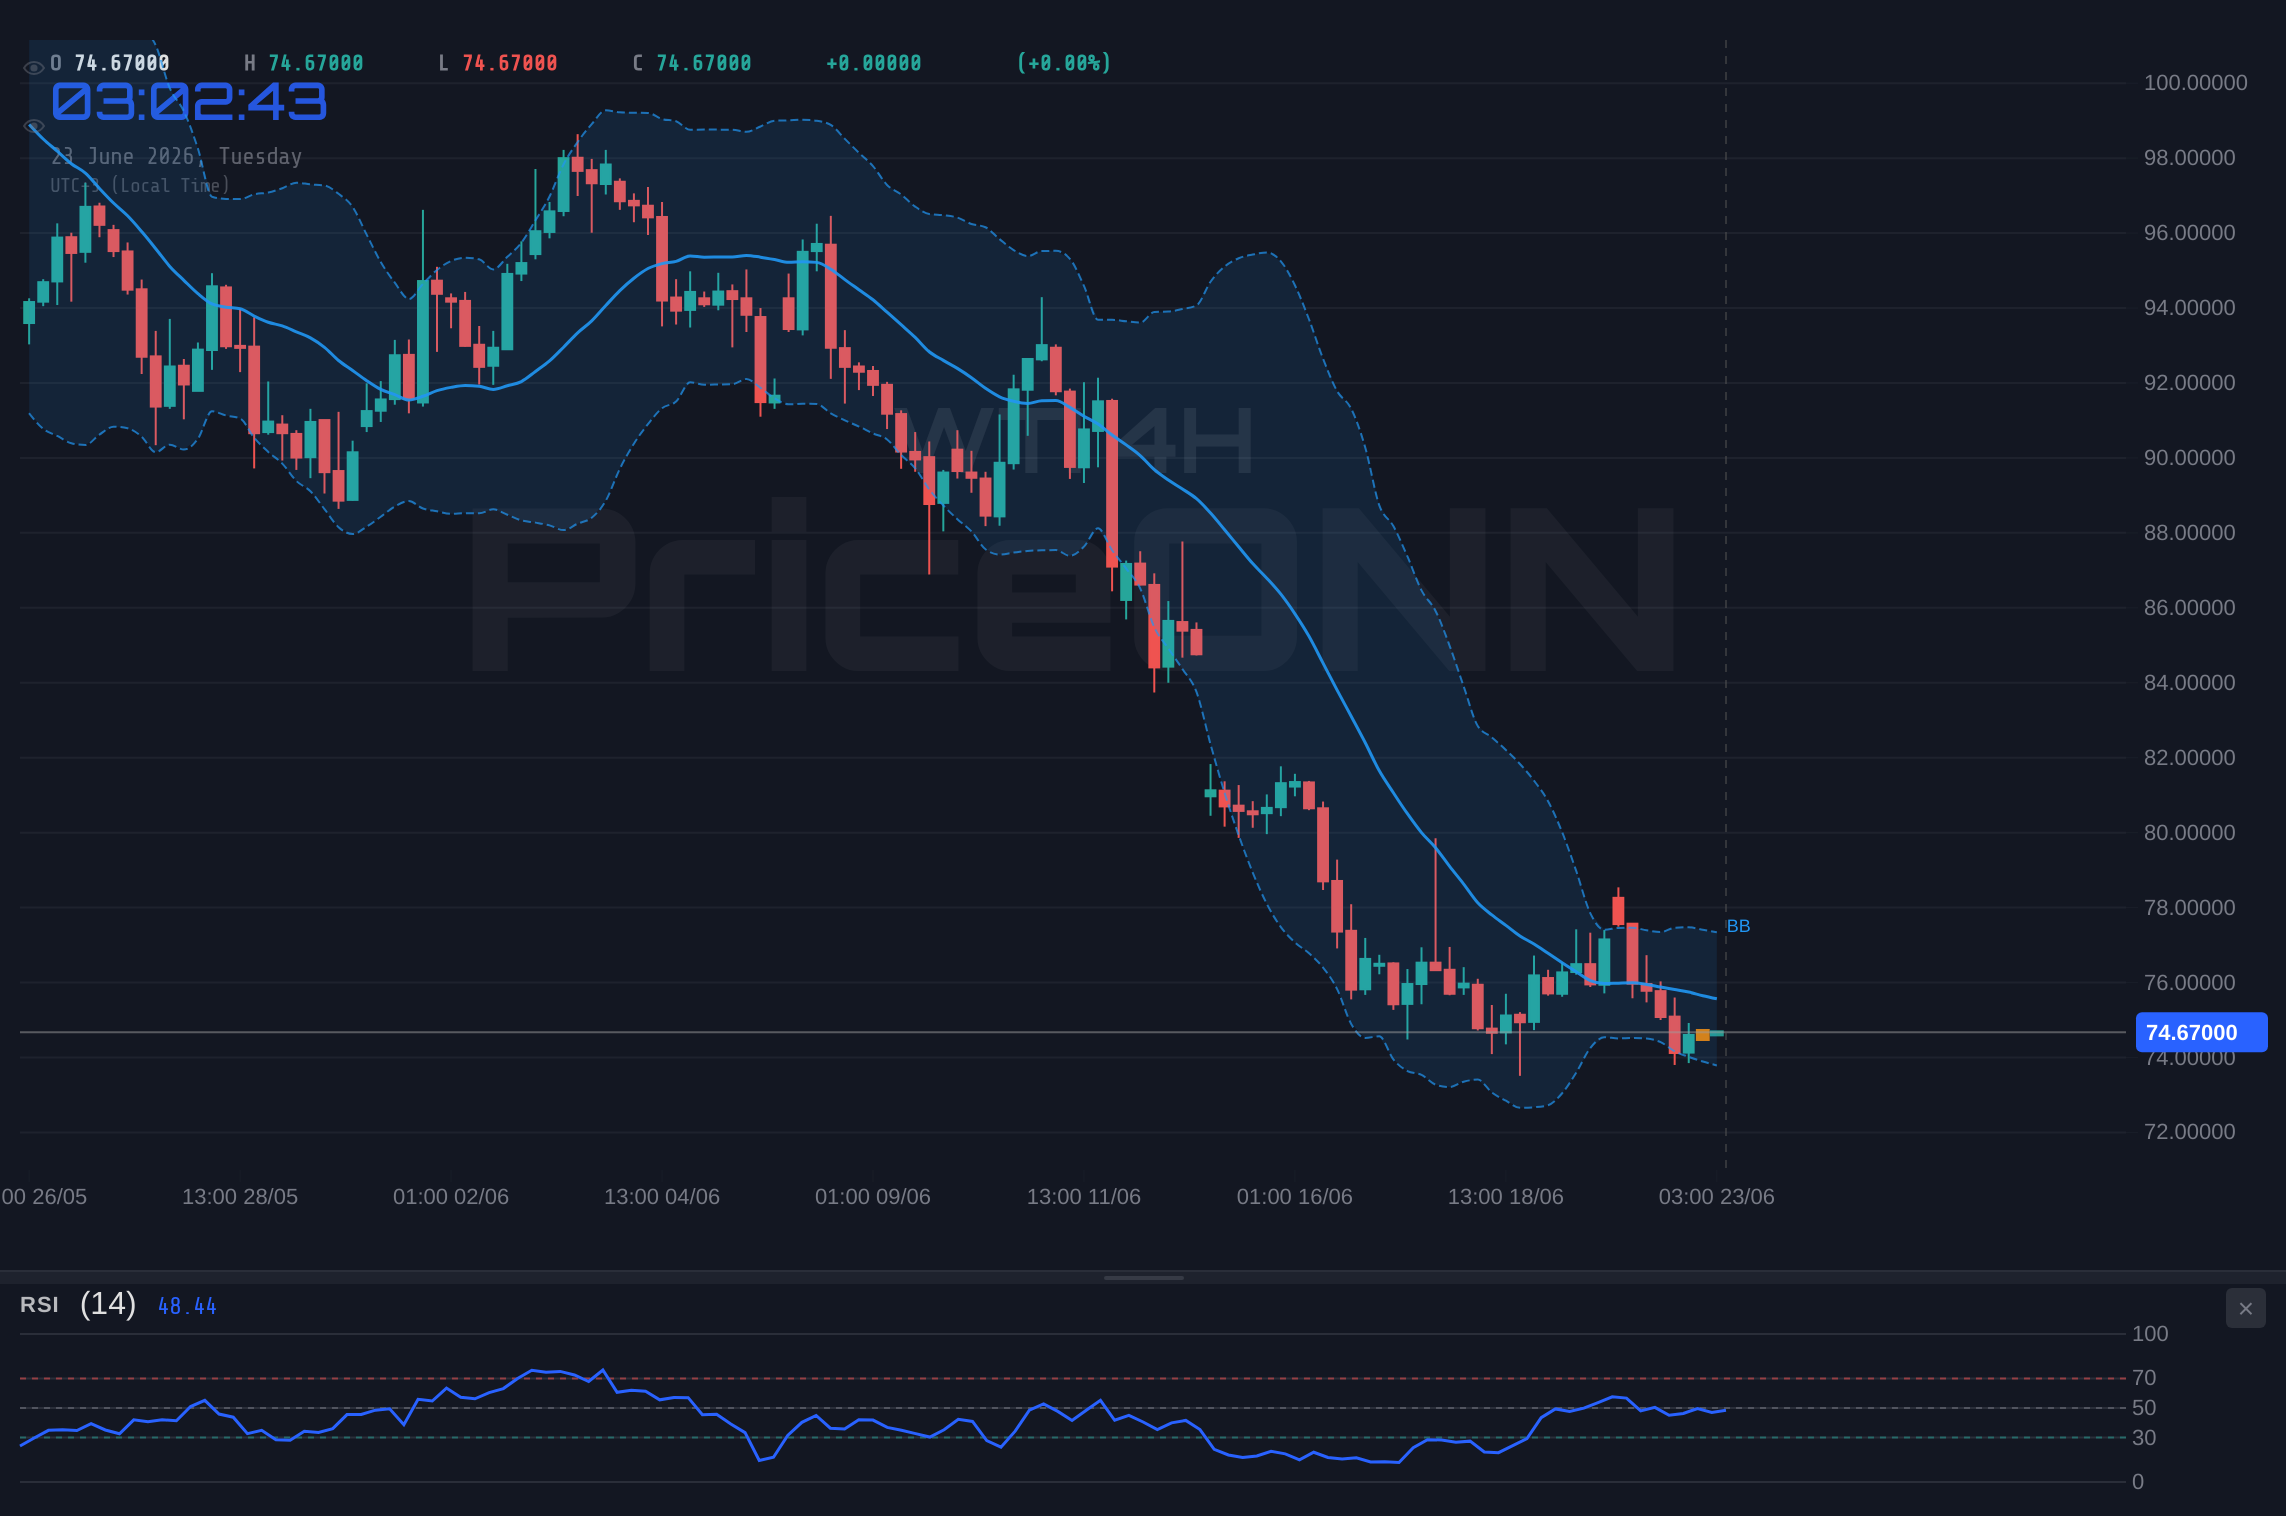
The 4-hour timeframe paints a more definitive bearish story. The ADX at 28.14 signals a strong downward trend, and the RSI at 37.81 is comfortably within neutral territory, far from oversold conditions. This implies that sellers still have significant control and that further price depreciation is plausible. The MACD is also below its signal line, reinforcing the negative momentum. The Stochastic oscillator here, with K at 10.04 and D at 42.27, is firmly in oversold territory and showing a bearish signal (%K
The daily chart is where the most significant bearish signals are concentrated. The ADX at 24.73 confirms a strong downtrend, and the RSI at 30.14 hovers just above oversold territory. This level has historically acted as a pivot point, but the current market structure suggests it may not hold as a significant floor without a substantial shift in fundamentals or sentiment. The MACD is negative and below its signal line, a classic bearish indicator. The Stochastic oscillator, with K at 11.8 and D at 8.34, is deeply oversold, presenting a potential, albeit weak, signal for a bounce. However, given the confluence of bearish indicators across the higher timeframes, any such bounce is likely to be corrective rather than indicative of a trend reversal. The current price of $74.80 is finding itself precariously positioned relative to these indicators, suggesting that downside risk remains elevated.
Geopolitical Undercurrents: The Hormuz Factor and Energy Strategy
While the technicals paint a clear bearish picture, the fundamental backdrop, particularly geopolitical developments, cannot be ignored. The recent news surrounding the Hormuz Crisis, as reported by various outlets including Reuters and Bloomberg, highlights the fragility of energy supply routes. India's response, as noted by Financial Times, to rethink its energy strategy underscores the global implications of disruptions in this critical chokepoint. The Strait of Hormuz is a vital artery for global oil trade, and any instability there has an immediate and often amplified effect on crude prices. Although the immediate price action for WTI shows a downtrend, the persistent geopolitical risks associated with the region serve as a constant wildcard, capable of triggering sharp price spikes should tensions escalate. This underlying risk premium is a crucial factor that prevents a complete collapse in prices, even amidst a bearish technical trend. The market is essentially caught between a bearish technical setup and the latent threat of supply-side shocks.
The broader macroeconomic environment also plays a significant role. The strengthening US Dollar Index (DXY), currently trading at 101.06, exerts downward pressure on dollar-denominated commodities like WTI. As the DXY strengthens, it becomes more expensive for holders of other currencies to purchase oil, thus dampening demand and contributing to lower prices. This inverse correlation between the DXY and WTI is a well-established market dynamic. Furthermore, the recent performance of equity markets, such as the S&P 500 trading at 6572.87, which shows a mixed but trending upwards signal on some timeframes despite a daily downtrend, can influence risk appetite. A significant decline in risk appetite, often signaled by a fall in major indices like the S&P 500 or Nasdaq, typically leads investors to seek safer assets, which can indirectly impact oil demand and prices. The current data suggests a cautious approach from investors, with the S&P 500 showing conflicting signals across timeframes.
Support and Resistance: Defining the Battleground
The current price of $74.80 for WTI places it in a precarious position relative to its key technical levels. On the 1-hour chart, immediate support is seen at $74.62, followed by $74.40 and $74.22. Resistance is identified at $75.02, $75.20, and $75.42. These levels suggest a tight trading range in the short term, but the overall bearish trend implies that a break below the initial support at $74.62 is more probable than a sustained rally above resistance.
Expanding to the 4-hour timeframe, the support levels become more significant: $73.41, $72.71, and $71.61. The resistance levels are $75.21, $76.31, and $77.01. The fact that the current price of $74.80 is well within the range defined by these 4-hour levels indicates that the market is currently consolidating its recent losses, but the proximity to the lower support zones is a cause for concern for bulls. A decisive break below $73.41 on this timeframe would likely trigger a more aggressive sell-off, targeting the lower support levels.
On the daily chart, the key support levels are significantly lower: $76.04, $74.93, and $74.24. The resistance levels are $77.84, $78.53, and $79.64. The current price of $74.80 is testing the very edge of the first daily support level at $74.93, and is closely approaching the next critical support at $74.24. This proximity to lower support levels, combined with the strong bearish trend indicated by the ADX and RSI, suggests that the downside remains the path of least resistance. Any upward movement will likely face stiff resistance around the $77.84 to $79.64 range, which would need to be decisively breached to alter the bearish outlook.
Scenario Analysis: Charting Potential Paths for WTI
Given the current technical and fundamental backdrop, three primary scenarios can be envisioned for WTI. The bearish scenario remains the most probable, driven by the confluence of strong downtrend indicators, a strengthening dollar, and potential for further supply stability if geopolitical tensions do not escalate. The bullish scenario hinges on a significant geopolitical event that disrupts supply or a dovish shift in central bank policy that weakens the dollar and boosts risk appetite. A neutral scenario would involve WTI trading within a defined range, potentially consolidating its recent losses as traders await clearer fundamental catalysts.
The prevailing bearish sentiment, supported by the ADX at 24.73 on the daily chart and an RSI below 40, indicates that sellers are in control. The proximity of the current price to critical support levels at $74.24 ($76.04 and $74.93 are nearer) suggests that a breakdown is a distinct possibility. If WTI fails to hold above the immediate support zone around $74.22-$74.62, it could trigger a cascade of stop-losses, pushing prices towards the next significant psychological and technical level at $71.61, as identified on the 4-hour chart. The ongoing geopolitical risks, while a potential upside catalyst, have not yet materialized into a significant supply disruption, allowing the bearish technicals to dictate price action. The strengthening DXY at 101.06 further adds to the headwinds for oil prices.
Bearish Scenario: Downside Momentum Continues
65% ProbabilityNeutral Scenario: Range-Bound Consolidation
25% ProbabilityBullish Scenario: Geopolitical Surprise or Dovish Fed
10% ProbabilityThe Road Ahead: What to Watch for WTI Traders
For traders and investors monitoring WTI, the immediate focus remains on the $74.22 to $74.93 support zone. A failure to hold this area could signal the next leg down in the current bearish trend. Key indicators like the daily ADX at 24.73 and RSI at 30.14 suggest that momentum is still in favor of the bears. However, traders must also remain vigilant to geopolitical developments, particularly any news emanating from the Strait of Hormuz region, which could rapidly alter the supply-demand calculus and trigger sharp price movements. The strengthening DXY at 101.06 continues to be a headwind, reinforcing the bearish technical setup.
The mixed signals from the 1-hour Stochastic oscillator, showing a potential short-term bounce, should be treated with caution. It is crucial to prioritize the signals from the higher timeframes (4H and 1D) which clearly indicate a strong downtrend. Any upward move is likely to face significant resistance, with the $77.01 to $79.64 range serving as a formidable barrier. Until WTI can decisively break and hold above these resistance levels, the path of least resistance remains to the downside. The market is currently in a state of consolidation, but the underlying trend is undeniably bearish, making any long positions highly speculative without clear confirmation of a trend reversal or a significant fundamental catalyst.
Frequently Asked Questions: WTI Analysis
What happens if WTI breaks below the $74.22 support level?
A break below $74.22 would invalidate the neutral scenario and likely accelerate the bearish trend. This could trigger stop-losses, pushing WTI towards the next significant support at $72.71, and potentially further down to $71.61 on the 4-hour chart, as indicated by the technical levels.
Should I consider buying WTI at current levels around $74.80 given the oversold Stochastic on the 1D chart?
Buying at current levels carries significant risk due to the strong bearish trend indicated by the daily ADX at 24.73 and RSI at 30.14. While the 1D Stochastic is oversold, the overall trend suggests this may not be a sustainable entry point. A more prudent approach would be to wait for confirmation of a trend reversal or a confirmed bounce from a more significant support level.
Is the RSI at 30.14 on the daily chart a buy signal for WTI?
While an RSI below 30 typically signals oversold conditions that *can* precede a reversal, it is not a standalone buy signal, especially in a strong downtrend. The current ADX reading of 24.73 confirms a strong trend, meaning RSI can remain in oversold territory for extended periods. A sustained break above resistance levels and a shift in MACD would be needed for confirmation.
How will the ongoing Hormuz tensions affect WTI prices this week?
Escalating tensions in the Strait of Hormuz could act as a significant bullish catalyst, potentially disrupting supply and driving prices higher. However, as of now, these tensions have not led to a material supply disruption, allowing the bearish technicals to dominate. Traders should monitor headlines closely for any signs of escalation that could override the current bearish sentiment.
The energy markets are a constant dance between supply, demand, and geopolitical stability. While WTI currently sits at $74.80 under considerable bearish pressure, the underlying risks remain. Patience and disciplined risk management are paramount. Traders must respect the current trend, watch key levels like $74.22 and $77.01 closely, and stay attuned to geopolitical developments that could swiftly alter the market's trajectory. The market always provides opportunities, but it's crucial to wait for the right setup and manage risk effectively.
Track markets in real-time
AI-powered analysis, technical indicators and real-time price data.
Join Our Telegram Channel
Breaking market news, AI analysis and trading signals instantly.
Join Channel