The energy markets are witnessing a significant downturn in crude oil prices, with WTI now trading below the crucial $71.10 mark. This sharp decline, marking an 8.16% drop in WTI's value for the day, is not merely a fleeting dip but a testament to the prevailing bearish sentiment that has gripped the commodity. As traders eye the current price of $71.10, the technical indicators are flashing a complex picture, oscillating between oversold conditions that might suggest a bounce and a strong, persistent downtrend that could signal further downside. This analysis delves into the intricate interplay of technical signals, macroeconomic factors, and geopolitical undercurrents shaping WTI's trajectory, offering a comprehensive market outlook for investors and traders navigating these volatile waters.
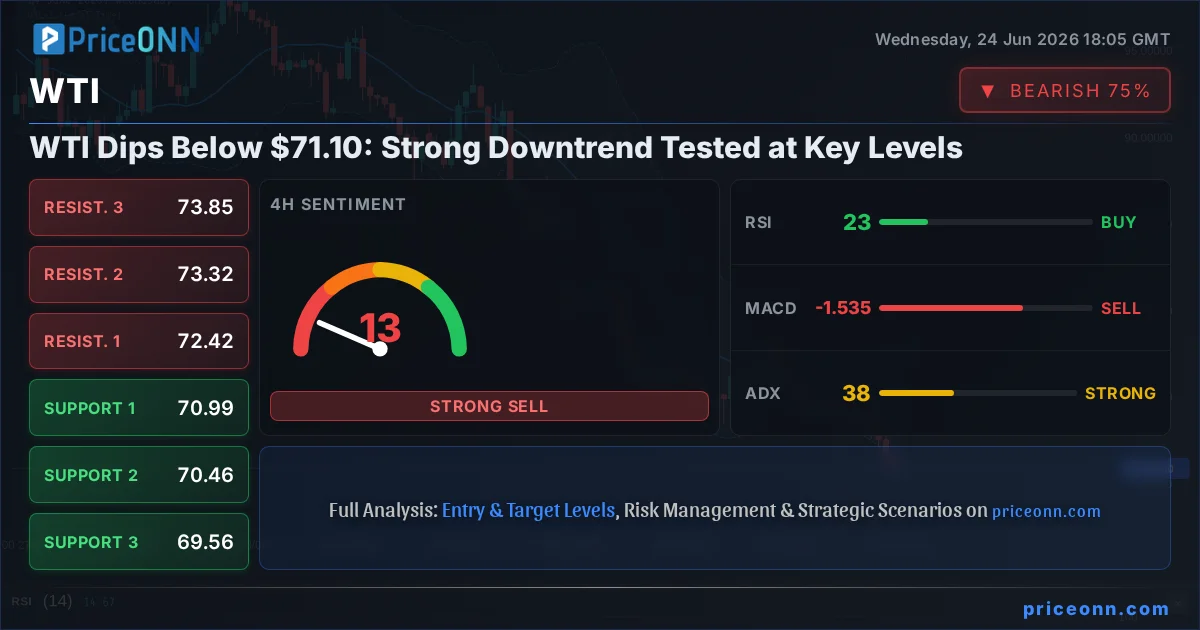
- WTI crude oil is trading at $71.10, down significantly amid a strong bearish trend.
- RSI at 33.57 suggests oversold conditions, but ADX at 39.75 indicates a powerful downtrend persists.
- Key support levels are identified at $70.73 and $70.45, while resistance looms at $71.36 and $71.71.
- The DXY's strength and a broader risk-off sentiment are contributing factors to the oil price decline.
Navigating the Downtrend: WTI's Technical Landscape
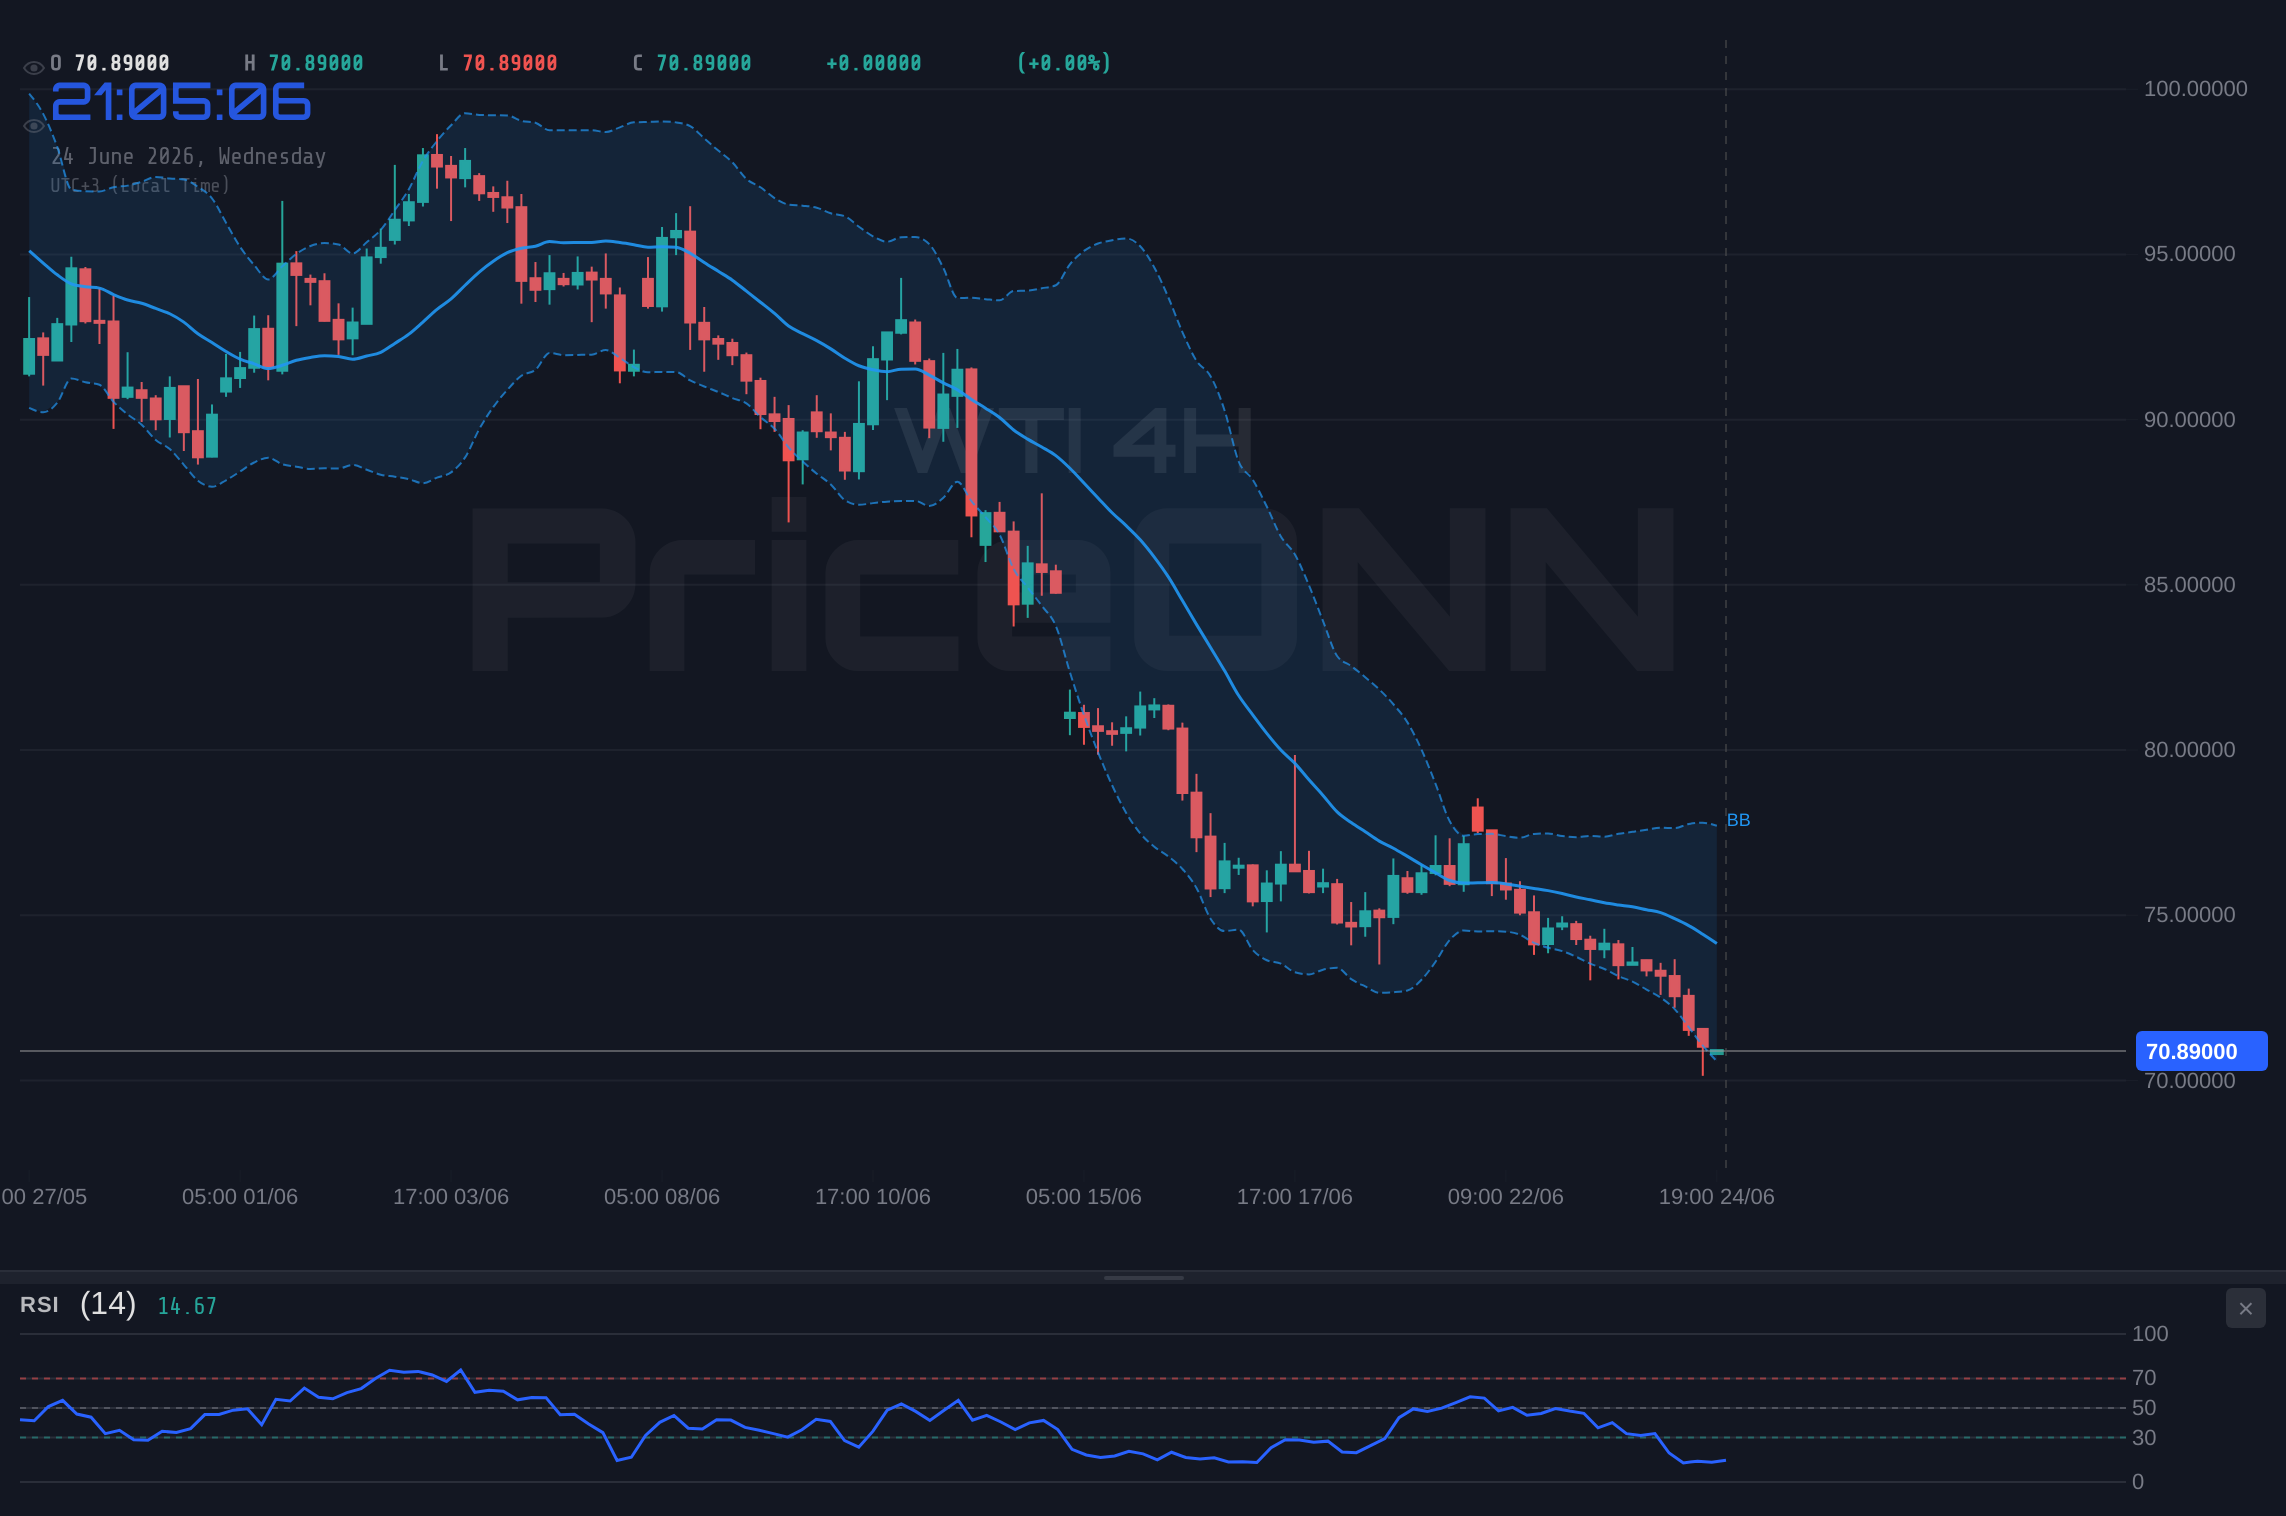
The 1-hour chart for WTI paints a stark picture of bearish dominance. With the price currently hovering around $71.10, the trend is unequivocally downwards, boasting a strength of 100%. The Relative Strength Index (RSI) at 33.57, while not yet in extreme oversold territory, certainly signals a market that is heavily weighted towards selling pressure, hinting at potential short-term buying opportunities if buyers step in. However, the MACD is firmly below its signal line, confirming negative momentum. The Bollinger Bands are also showing the price trading below the middle band, suggesting a bearish bias. Stochastic K at 32.74 and D at 14.35 indicate a potential for a bounce as %K is above %D, but the overall picture remains bearish. The Average Directional Index (ADX) at 39.75 is a critical figure here; it signifies a strong, established downtrend. This is not a market in consolidation; it's a market with conviction behind its moves. The overall signal is a strong 'SELL' based on the 1-hour timeframe, with 7 out of 8 indicators pointing downwards.
Expanding the view to the 4-hour timeframe, the bearish trend remains firmly in place, albeit with a slightly reduced strength of 100%. The current price of $71.10 is being tested against immediate support levels at $70.73 and $70.45. The RSI here dips further to 23.89, firmly in oversold territory and presenting a more compelling case for a potential reversal or at least a significant pullback. The MACD continues its negative trajectory, reinforcing the bearish momentum. Stochastic readings are also deeply oversold, with K at 13.13 and D at 15.63, suggesting that the downward momentum may be exhausting itself. However, the ADX remains robust at 38.25, indicating that the strong downtrend is far from over. This creates a divergence: technically oversold, but structurally still in a powerful downward trend. The general signal remains 'SELL', but the oversold conditions warrant caution for aggressive short positions.
On the daily chart, the narrative continues to be dominated by the bears, though the trend strength slightly moderates to 100%. WTI is currently trading at $71.10, with significant support found at $70.73, $70.45, and further down at $70.10. Resistance levels are firmly overhead, starting at $71.36 and extending to $71.71. The RSI at 33.57 is once again in the oversold zone, a recurring theme across timeframes, suggesting that substantial selling has occurred. The MACD remains negative, and Bollinger Bands show the price hugging the lower band. Stochastic K (32.74) is above D (14.35), hinting at a potential upward move, but the ADX at 39.75 continues to confirm a strong, prevailing downtrend. The overall signal is a 'SELL', but the daily oversold RSI may be a precursor to a corrective rally, especially if the market finds a reason to pause its sell-off.
Macroeconomic Undercurrents and Geopolitical Ripples
The persistent weakness in WTI crude oil prices cannot be solely attributed to technical factors. The broader macroeconomic environment is playing a significant role. The US Dollar Index (DXY) is showing renewed strength, currently trading at 101.69 and climbing. A stronger dollar typically puts downward pressure on dollar-denominated commodities like oil, as they become more expensive for holders of other currencies. The DXY's 1H trend is strong (99% strength) with RSI at 62.55, indicating upward momentum. On the 4H, DXY is at 101.63 with a very strong trend (100% strength) and RSI at 76.57, signaling overbought conditions for the dollar itself, which might eventually lead to a pullback, but for now, it supports lower oil prices. The daily DXY trend is also strong at 99% with RSI at 76.88, reinforcing the headwinds for oil.
Furthermore, the prevailing risk sentiment in the markets is leaning towards 'risk-off'. This is evident in the performance of major indices. The SP500, currently trading at 6572.87, is showing a mixed picture with a strong 1H and 4H upward trend but a bearish 1D trend. However, the Nasdaq 100, a bellwether for tech stocks and risk appetite, is experiencing a notable decline, trading at 29086.47 with a strong bearish trend across all timeframes. This sell-off in tech and a general cautiousness among investors often leads to reduced demand for riskier assets, including commodities like oil. When investors become more risk-averse, they tend to move capital towards safer havens, which can indirectly pressure oil prices by reducing speculative demand and increasing the appeal of assets like the strengthening US dollar and gold.
Geopolitical factors, while not overtly alarming at this precise moment, always cast a shadow over the energy markets. The recent news regarding easing tensions between the United States and Iran, as reported, could theoretically reduce immediate supply disruption fears. However, the market seems to be pricing in a broader sentiment of demand concerns and potential oversupply rather than immediate geopolitical supply shocks. The recent breaking news about the Euro sinking to a one-year low, partly fueled by falling oil prices and dovish ECB signals, highlights the interconnectedness of global markets. A weaker Euro suggests potential economic headwinds in a major economic bloc, which could translate into lower energy demand. This situation underscores how global economic health, currency movements, and commodity prices are intrinsically linked, creating a complex web of influences on WTI.
Intermarket Correlations and Strategic Implications
The correlation between WTI and the US Dollar Index (DXY) is a critical aspect for traders to monitor. As observed, the DXY's current strength, particularly on the 4H and 1D charts where it shows very strong upward trends and high RSI readings, is a significant headwind for WTI. If the DXY continues its ascent, it will likely exert further downward pressure on oil prices. Conversely, any sign of the DXY rolling over, perhaps due to a shift in Fed policy expectations or a broader market reassessment of risk, could provide a much-needed reprieve for WTI. The market is currently pricing in a strong dollar environment, which is a direct dampener on commodity prices.
The performance of stock indices, particularly the Nasdaq 100, also provides crucial context. The Nasdaq's pronounced weakness, with a strong bearish trend across multiple timeframes and oversold RSI readings on lower timeframes, suggests a broader market deleveraging or a rotation out of growth assets. This 'risk-off' environment typically correlates with lower demand for industrial commodities like crude oil. As investors pull capital from riskier assets, demand for WTI can falter, exacerbating price declines. The fact that WTI is falling while the Nasdaq is also falling, despite WTI's own oversold technicals, indicates that the macro trend is currently overpowering potential technical bounces.
Looking at other commodities, gold's performance offers another layer of insight. Gold is also experiencing a decline, trading at $3972.43, with a strong downtrend confirmed across timeframes. This move, despite the dollar's strength and risk-off sentiment which typically favors gold as a safe haven, suggests that the selling pressure is broad-based across commodities. The news citing gold's advance looking vulnerable as market sentiment shifts, with a bearish trend line forming, reinforces this observation. When both gold and oil are falling despite typical safe-haven correlations being disrupted, it points to overarching demand concerns or a significant flow of capital out of the commodity complex.
Trade Scenarios and Risk Management
Given the current technical and fundamental backdrop, several scenarios can be envisioned for WTI. The prevailing trend is strongly bearish, supported by a robust ADX across all timeframes, indicating that the path of least resistance remains to the downside. However, the oversold conditions on the RSI and Stochastic indicators across the 4H and 1D charts cannot be ignored. These suggest that while the trend is down, the immediate risk of a short-term bounce or corrective rally is elevated.
Bearish Scenario: Persistent Selling Pressure
65% ProbabilityNeutral Scenario: Consolidation and Oversold Bounce
25% ProbabilityBullish Scenario: Reversal Attempt
10% ProbabilityRisk management is paramount in this environment. Traders should be mindful of the strong ADX readings, which suggest that trend-following strategies might be more appropriate, but the oversold indicators warrant caution for entering new short positions without confirmation. A break below the $70.45 support level on the 1H chart would likely trigger a cascade towards $70.10 and potentially $69.56, aligning with the bearish scenario. Conversely, a failure to break lower, coupled with a strong close above $71.71, could signal a short-covering rally, targeting $72.42 and $73.32. Given the current strong downtrend, the probability for the bearish scenario is set at 65%, with a neutral consolidation scenario at 25%, and a full bullish reversal attempt being the least likely at 10%.
The prevailing macroeconomic data, including a strong DXY and bearish equity market sentiment, along with potential dovish signals from central banks, could prolong the downside pressure on WTI. Traders should exercise extreme caution and employ strict risk management protocols, including setting appropriate stop-losses, especially given the volatile nature of energy markets and the potential for sudden geopolitical events to influence prices.
The Road Ahead: What to Watch for WTI
Looking forward, several factors will be critical in determining WTI's next move. Firstly, the US Dollar Index (DXY) will remain a key barometer. If the DXY continues its upward trajectory, especially with its 4H and 1D charts showing strong trends and overbought RSI, it will likely cap any upside attempts for WTI. A potential pullback in the DXY, however, could be the catalyst for a short-covering rally in oil. Secondly, the performance of major stock indices, particularly the Nasdaq 100, will offer clues about overall market risk appetite. A continued sell-off in tech stocks would reinforce the bearish sentiment for commodities like WTI.
Economic data releases will also play a crucial role. Upcoming inflation figures and employment reports will shape expectations for central bank policies, particularly from the Federal Reserve. Any indication of a more hawkish stance from the Fed could further strengthen the dollar and weigh on oil prices, while signs of economic cooling might lead to speculation of rate cuts, potentially boosting demand outlook but also signaling economic weakness. The market's reaction to these data points, and how they influence the DXY and risk sentiment, will be pivotal. For instance, a weaker-than-expected jobs report coupled with strong inflation could create a conflicting narrative, but generally, the focus remains on inflation and the Fed's reaction function.
Geopolitical developments, although currently appearing less dominant than macro factors, always hold the potential to shift the narrative rapidly. Any escalation of tensions in major oil-producing regions or unexpected supply disruptions could quickly override current bearish sentiment. Traders must remain vigilant for headlines that could impact global oil supply dynamics. In the absence of major geopolitical shocks, the focus will likely remain on the interplay between a strong dollar, risk-off sentiment, and the technical picture of oversold conditions battling a strong downtrend. The current price of $71.10 is a critical juncture, and the next few trading sessions will be crucial in determining whether this level holds as a temporary pause or a point of deeper decline.
Frequently Asked Questions: WTI Analysis
What happens if WTI breaks below the $70.45 support level?
If WTI breaks decisively below the $70.45 support, it would invalidate the neutral scenario and strengthen the bearish outlook. This could trigger a rapid decline towards the next key support at $70.10, potentially extending to $69.56 as the market prices in further downside based on the strong ADX trend.
Should I consider buying WTI at current levels around $71.10 given the oversold RSI?
Buying at $71.10 solely based on oversold RSI (33.57) carries significant risk due to the strong 39.75 ADX confirming a downtrend. A more prudent approach would be to wait for confirmation, such as a hold above $71.71 resistance or a clear bullish divergence on lower timeframes, before considering long positions with tight stop-losses below $70.73.
Is the RSI at 33.57 a definitive sell signal for WTI right now?
An RSI of 33.57 is not a definitive sell signal itself; rather, it indicates that WTI is approaching oversold territory after a significant decline. While it suggests selling momentum might be weakening, the strong ADX (39.75) confirms an established downtrend. A sell signal would be reinforced by price action confirming the downtrend, such as failing to break key resistance levels like $71.71.
How will the strong DXY at 101.69 affect WTI prices this week?
The strong DXY at 101.69, with its own robust uptrend, creates direct headwinds for WTI. This correlation suggests that further dollar strength will likely suppress oil prices, potentially pushing WTI towards lower support levels like $70.45 or even $70.10, unless significant geopolitical events or a shift in Fed policy expectations emerge.
The current market environment for WTI is characterized by strong bearish momentum, amplified by macroeconomic factors like a strengthening dollar and risk-off sentiment. While technical indicators point to oversold conditions, the persistent strength of the downtrend, as evidenced by the ADX, suggests that any bounces may be short-lived unless significant fundamental catalysts emerge. For traders, patience and strict adherence to risk management principles are key. Watching the interplay between key support at $70.45 and resistance at $71.71, alongside the DXY's direction, will be crucial in navigating the path forward. The market is signaling caution, and only disciplined execution will lead to favorable outcomes in these choppy conditions.
Technical Outlook Summary
| Indicator | Value | Signal | Interpretation |
|---|---|---|---|
| RSI (14) | 33.57 | Neutral | Approaching oversold, potential for bounce |
| MACD Histogram | -0.3975 | Bearish | Negative momentum continues |
| Stochastic | K:32.74, D:14.35 | Neutral | %K > %D, potential upward cross |
| ADX | 39.75 | Bearish | Strong downtrend confirmed |
| Bollinger | Lower Band | Bearish | Price below middle band |
Key Levels
Track markets in real-time
AI-powered analysis, technical indicators and real-time price data.
Join Our Telegram Channel
Breaking market news, AI analysis and trading signals instantly.
Join Channel