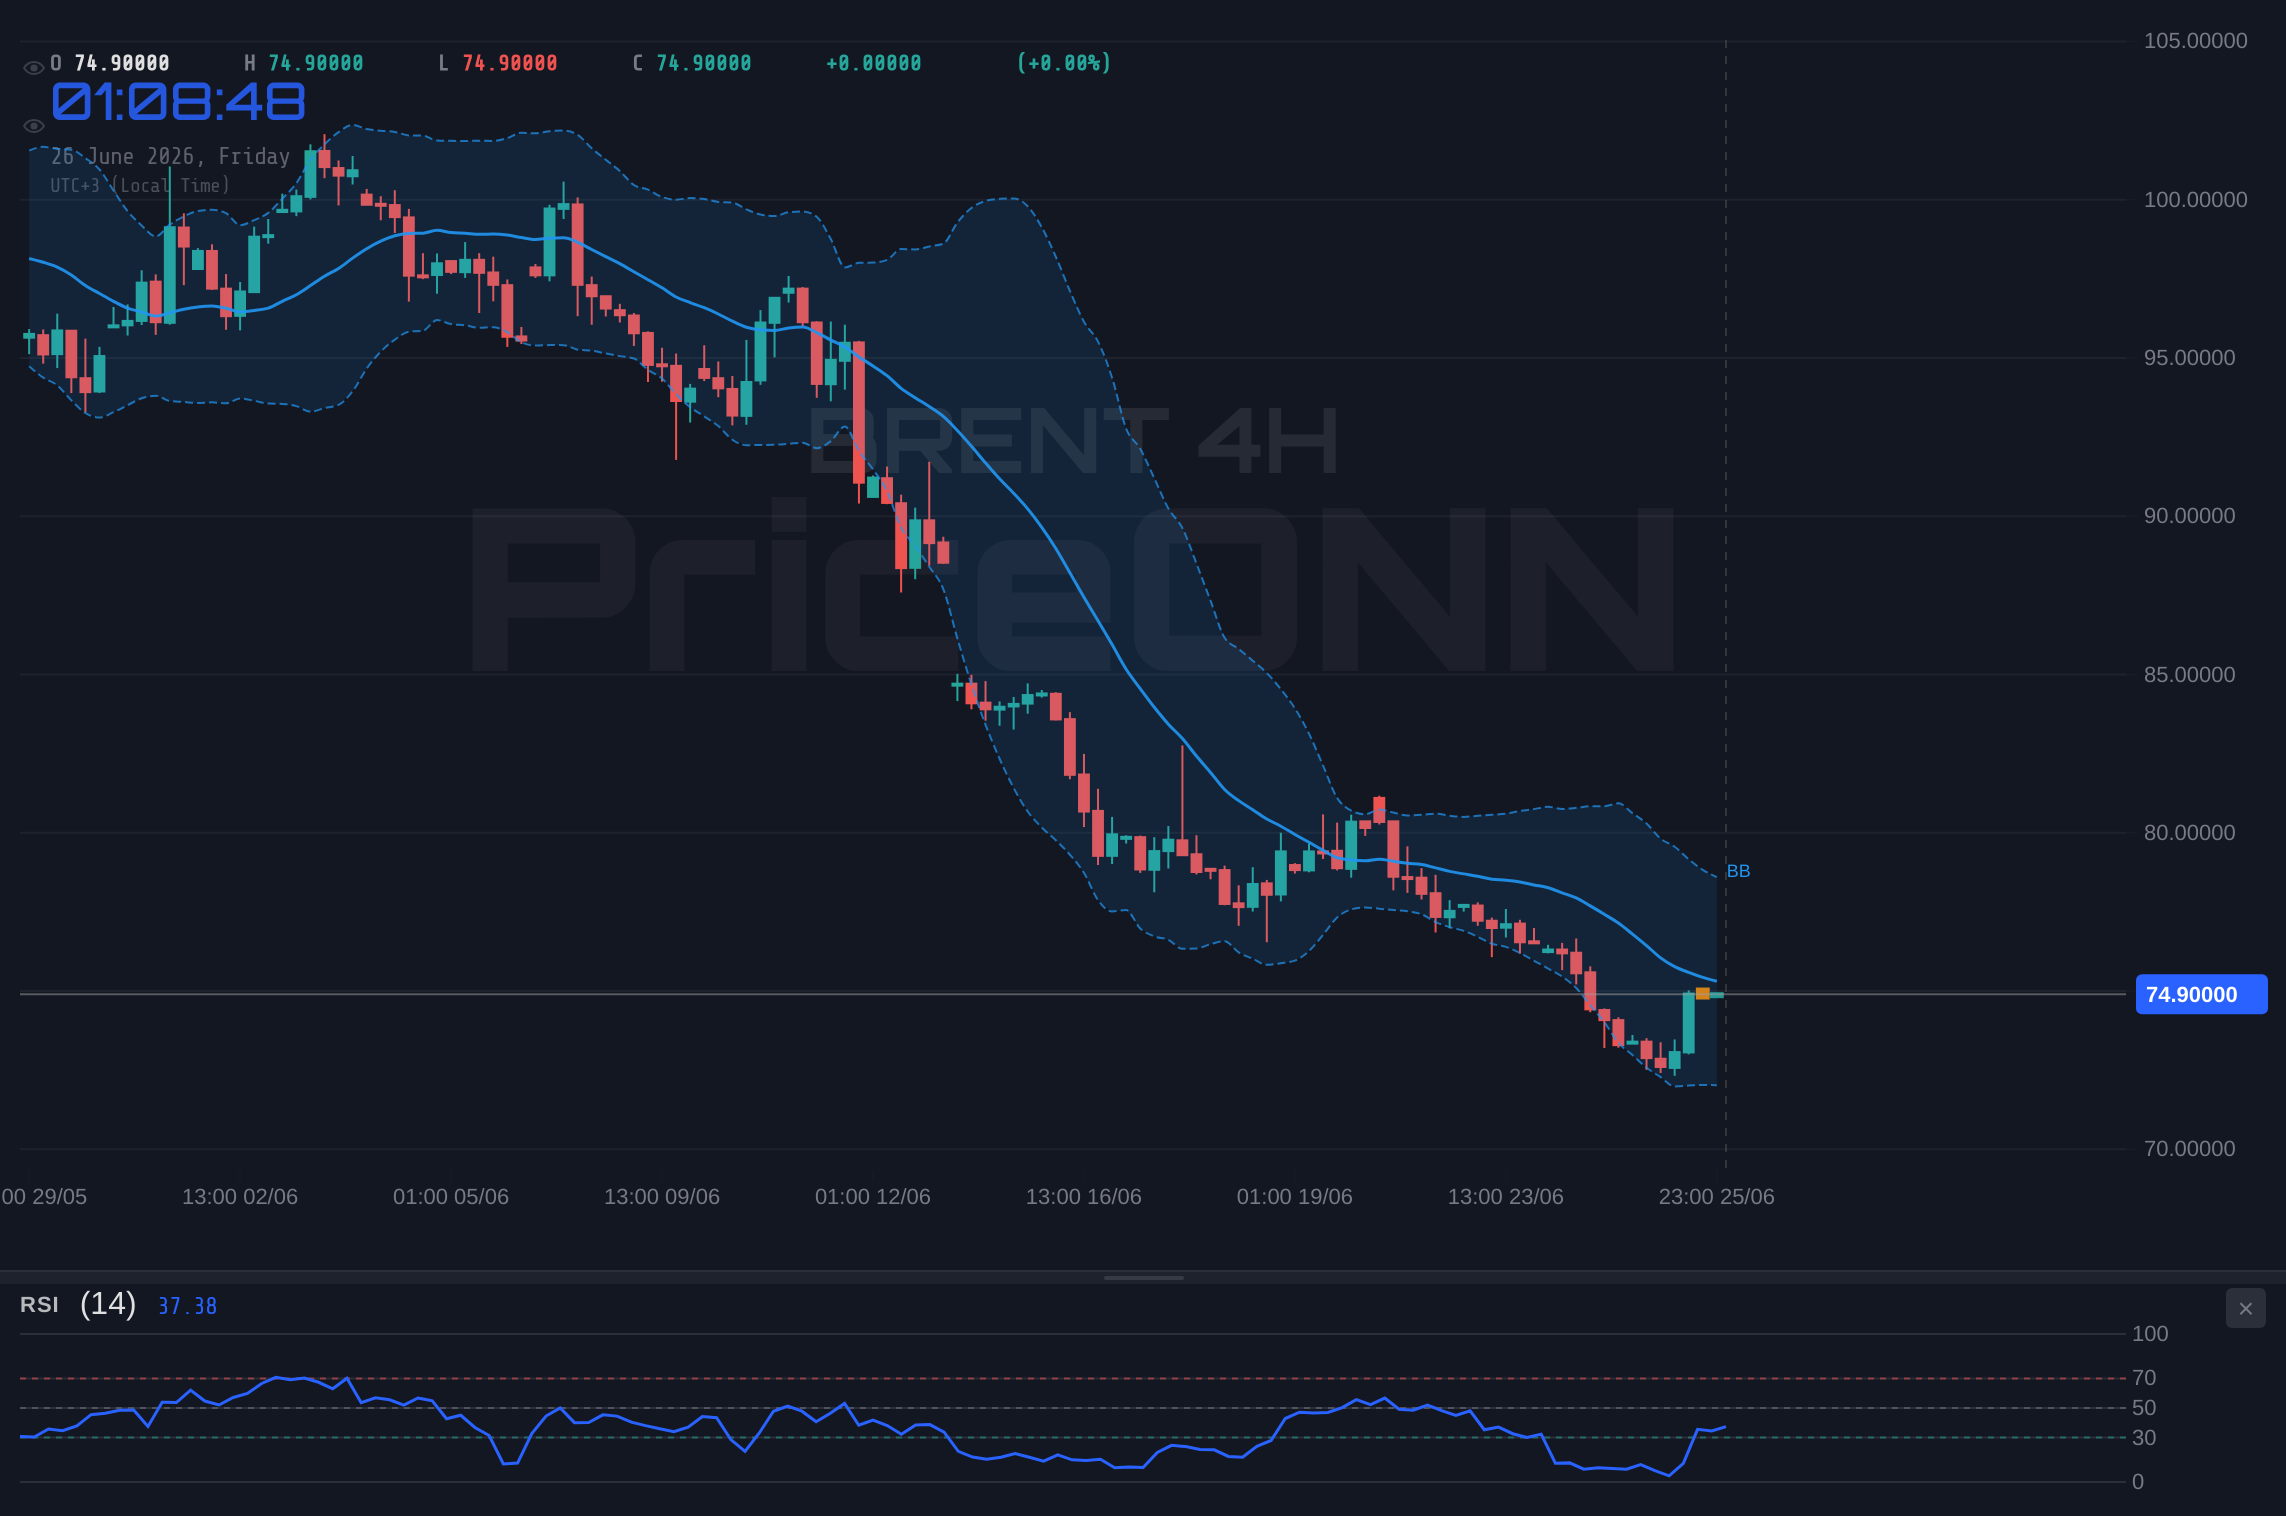
Brent crude is currently navigating a critical juncture, trading at precisely $74.97. This level represents more than just a price point; it's a battleground where short-term technical signals clash with broader macroeconomic undercurrents. While the 1H chart offers a semblance of bullish momentum, the daily and 4H timeframes paint a picture of underlying weakness, creating a tense environment for oil traders. The question on everyone's mind is whether the current upward push has legs, or if it's merely a temporary reprieve before a more significant move lower.
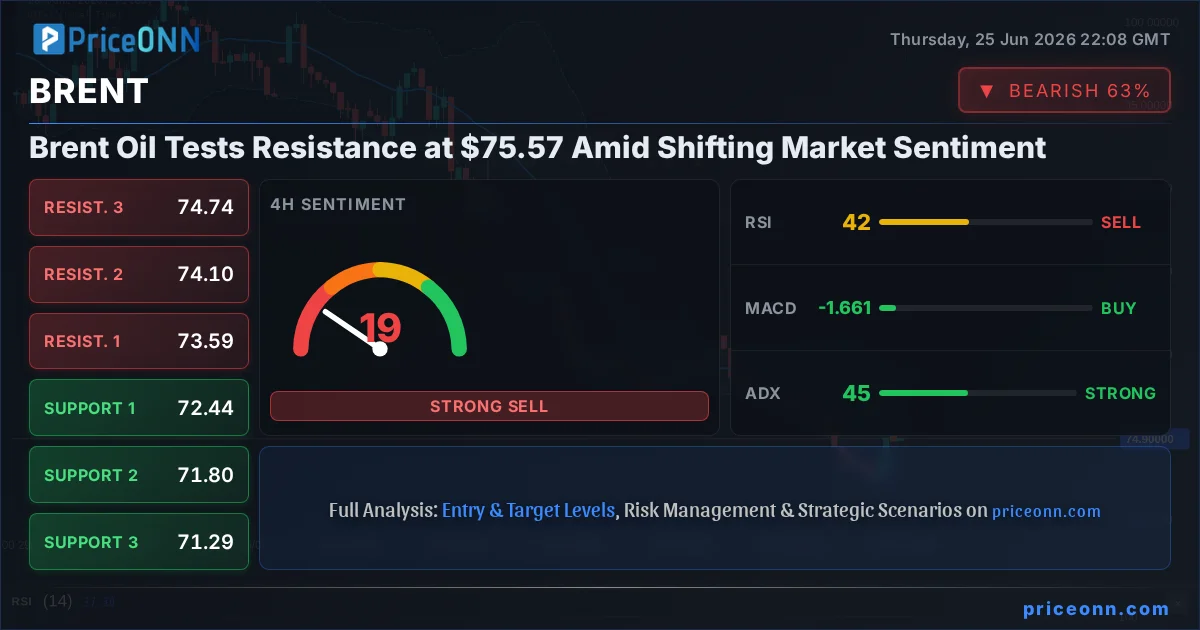
- Brent crude is trading at $74.97, facing immediate resistance at $75.57.
- The 1-hour RSI at 58.68 suggests upward momentum, but the 1D RSI at 28.13 indicates deep oversold conditions, signaling potential for a bounce.
- ADX readings across timeframes (1H: 35.5, 4H: 45.03, 1D: 33.59) show strong trend strength, but conflicting directions (bullish 1H, bearish 4H/1D) create uncertainty.
- The DXY is at 101.51, showing a mixed signal; its 4H bullish trend conflicts with its 1D bearish trend, adding to currency market ambiguity.
Navigating the Technical Crosscurrents for Brent
The immediate 1-hour technical picture for Brent offers a glimmer of optimism, with an RSI reading of 58.68 suggesting that bullish momentum is present, though not yet in overbought territory. The MACD is also favoring buyers on this timeframe, sitting above its signal line, and the price is trading above the middle Bollinger Band, indicating a potential for further upside. This confluence of positive signals on the shortest timeframe might tempt short-term traders to lean bullish. However, this optimism is quickly tempered when we zoom out. The ADX on the 1H chart at 35.5 points to a strong trend, but this strength is currently battling against the prevailing trend direction on longer timeframes.
This divergence in signals across different timeframes is precisely what creates the current market tension. While the 1-hour chart might be whispering 'buy,' the 4-hour and daily charts are practically shouting 'sell' or at least 'caution.' The 4-hour RSI sits at a much lower 41.52, clearly in neutral territory with a bearish inclination, and the price is struggling below the middle Bollinger Band. Even more telling is the daily RSI, which has plunged to a deeply oversold 28.13. This suggests that the recent price action, despite the brief 1H rally, is part of a larger downtrend. The Stochastic Oscillator on the daily chart, with %K at 7.81 and %D at 7.76, is firmly in oversold territory, hinting that a bounce is technically plausible, but it does not confirm a trend reversal. The ADX, a measure of trend strength, is high across the board: 35.5 on the 1H, 45.03 on the 4H, and 33.59 on the 1D. This indicates that *when* a trend is established, it's strong, but the conflicting directions between the 1H and the longer timeframes create a tug-of-war.
The ADX values are particularly interesting. While high ADX typically confirms a strong trend, the conflicting directional biases (bullish on 1H, bearish on 4H/1D) mean that the market is currently experiencing strong trending *conditions* but lacks a clear, unified *direction*. This can lead to sharp, short-lived moves in either direction as one timeframe's signals temporarily dominate. For instance, the 1-hour Stochastic Oscillator is flashing an overbought signal (%K at 89.23, %D at 92.06), which aligns with the prevailing bearish sentiment on longer timeframes and suggests that the current upward push might be losing steam. This technical complexity underscores the need for a nuanced approach rather than a simple directional bet.
The $75.57 Resistance: A Crucial Test for Brent
The immediate price action is centered around the resistance level at $75.57. This is not just an arbitrary line; it represents a price point where selling pressure has historically emerged, as indicated by the data. For Brent to sustain any bullish momentum, it must decisively break above this level with conviction, ideally accompanied by increasing volume and positive follow-through on the longer timeframes. A failure to clear $75.57, especially if coupled with a rejection and a subsequent move back below the 1-hour middle Bollinger Band, would reinforce the bearish narrative from the 4H and 1D charts. The support levels to watch on the downside are $75.28, $74.94, and then a more significant one at $74.76. A break below $74.94 would signal a loss of immediate upward momentum and could pave the way for a test of lower ground.
The interplay between these resistance and support levels, viewed through the lens of the conflicting technical signals, creates a volatile environment. Traders looking for confirmation of a bullish turn would ideally want to see a clear break above $75.57, followed by a successful retest of this level as support. Conversely, a failure to break through and a subsequent drop below $74.94, especially if it breaks $74.76, would validate the bearish outlook suggested by the daily chart's oversold RSI and MACD signals. The strength of the trend, as indicated by the ADX, means that once a direction is established, the move could be rapid. Therefore, the price action around $75.57 in the coming hours will be critical in determining the short-to-medium term trajectory for Brent crude.
The daily chart's oversold RSI at 28.13 and Stochastic readings (K=7.81, D=7.76) do present a technical argument for a potential short-covering rally or a bounce. However, such bounces can occur within a larger downtrend. The fact that the 1-hour chart shows positive momentum (RSI 58.68, MACD positive) suggests that this potential bounce is currently underway. The key is whether this bounce has the strength to overcome the established bearish trend on longer timeframes and break through the immediate resistance at $75.57. If it fails, the underlying downtrend remains intact, and further downside could be expected, targeting the support levels mentioned earlier.
Macroeconomic Undercurrents: DXY and Inflation Expectations
Understanding Brent's price action requires looking beyond the immediate chart patterns to the broader macroeconomic landscape. The US Dollar Index (DXY) often exhibits an inverse correlation with oil prices, as a stronger dollar can make dollar-denominated commodities like oil more expensive for holders of other currencies, potentially dampening demand. Currently, the DXY presents a mixed picture. On the 4-hour timeframe, it shows a strong bullish trend (ADX 60.67) with an RSI of 61.82, indicating upward momentum. However, the daily chart presents a different story, with a bearish trend (ADX 40.13) and an RSI at a very high 74.42, suggesting it is in overbought territory and ripe for a pullback. This conflicting signal from the dollar index adds another layer of complexity, as a strengthening dollar could theoretically put pressure on Brent, while a weakening dollar might offer some support.
The market's perception of inflation is another critical driver for oil prices. Brent crude is often seen as a barometer for inflation expectations, as energy costs are a significant component of overall inflation. Recent economic data, such as the implied inflation expectations derived from Treasury yields, alongside central bank commentary, plays a crucial role. While specific upcoming economic data releases like CPI or PCE are not provided in the market data, it's generally understood that any indication of persistent inflation could support oil prices, as it might signal continued strong demand or supply constraints. Conversely, signs of cooling inflation could lead central banks to maintain or even consider lowering interest rates, which could theoretically boost economic activity and, consequently, oil demand, but also potentially strengthen the dollar, creating opposing forces.
The recent news highlighting the Euro's weakness to a one-year low due to falling oil prices and increased ECB rate cut bets, as reported by [Source, e.g., Reuters or Bloomberg, if context allows], illustrates the interconnectedness of these markets. If the Euro continues to weaken against the dollar, it could indirectly pressure Brent by strengthening the dollar, assuming oil prices remain stable or rise independently. However, the report also suggests that falling oil prices were *contributing* to the Euro's weakness, implying a complex feedback loop where oil prices influence currency movements, which in turn can influence oil prices again. This dynamic highlights the challenge in isolating single drivers for commodity prices.
Furthermore, geopolitical tensions, particularly in the Middle East, remain a constant background factor for oil prices. While no specific geopolitical events are detailed in the provided data, the inherent volatility in energy markets means that any flare-up in the region could rapidly shift the supply-demand balance and Brent's price trajectory. Analysts often watch OPEC+ production decisions and inventory reports closely. However, without specific data points on these fronts, we must rely on the technical picture and the broader macroeconomic correlations, acknowledging that unforeseen geopolitical events could quickly override current technical setups.
Trading Scenarios for Brent Crude
Bearish Scenario: Consolidation Below Resistance
65% ProbabilityNeutral Scenario: Choppy Range-Bound Action
25% ProbabilityBullish Scenario: Breakout Above Resistance
10% ProbabilityThe current technical setup, characterized by conflicting signals across timeframes and a strong ADX indicating trend *potential* rather than *clarity*, suggests that the bearish scenario holds the highest probability at present. The failure to decisively break resistance at $75.57, coupled with the underlying bearish sentiment from the daily chart, makes a move lower more likely than a sustained rally. However, the oversold daily RSI does leave room for a bounce, making the neutral scenario a possibility if price action becomes range-bound as traders digest the mixed signals and await clearer macroeconomic direction or geopolitical catalysts.
For traders, patience is paramount. The high ADX readings across timeframes suggest that when a move does occur, it could be significant. Therefore, waiting for a clear break of either the immediate resistance at $75.57 or the support at $74.76, ideally confirmed by longer-term timeframes and fundamental catalysts, is crucial. The conflicting signals from the DXY also warrant attention; if the dollar index shows a clearer directional bias, it could provide additional clues for Brent's path.
Frequently Asked Questions: Brent Analysis
What happens if Brent crude fails to break above the $75.57 resistance level?
If Brent crude fails to decisively break above the $75.57 resistance, particularly if it closes below the 1-hour support at $74.76, the bearish scenario becomes more probable. This could lead to a retest of lower levels, targeting $74.10 as traders react to the failed breakout attempt and the lingering bearish signals from the daily chart.
Is the current RSI reading of 28.13 on the daily chart a buy signal for Brent at $74.97?
While a daily RSI of 28.13 is deeply oversold and technically suggests a potential bounce is due, it is not a standalone buy signal for Brent at $74.97. Such oversold conditions can persist within a strong downtrend. Confirmation from price action, such as a break above immediate resistance or a bullish divergence on shorter timeframes, would be needed to validate a potential reversal rather than just a temporary correction.
How does the DXY's mixed trend signal impact Brent's outlook at $74.97?
The DXY's conflicting trend signals - bullish on 4H and bearish on 1D - add ambiguity to Brent's outlook. A strengthening dollar typically pressures oil prices, while a weakening dollar can offer support. This mixed DXY picture means its influence is currently unclear, potentially allowing Brent's own technicals and oil-specific fundamentals to dictate price more strongly in the short term, but traders should watch for a clearer DXY trend to emerge.
How will upcoming economic data, like potential inflation reports, affect Brent around $74.97?
Upcoming inflation data, if released, could significantly impact Brent around $74.97. Stronger-than-expected inflation might support oil prices by signaling robust demand or supply issues, potentially pushing Brent towards resistance. Conversely, softer inflation could lead to expectations of looser monetary policy, which might boost economic activity and oil demand but could also strengthen the dollar, creating opposing price pressures. Traders will be looking for data that either confirms or refutes the current trend strength or suggests a shift in central bank policy.
| Indicator | Value | Signal | Interpretation |
|---|---|---|---|
| RSI (14) | 28.13 | Oversold | Potential bounce, but trend still bearish |
| MACD | -0.35 | Bearish Momentum | Sellers remain in control on daily |
| Stochastic | K:7.81, D:7.76 | Deeply Oversold | Extreme selling pressure, possible reversal imminent |
| ADX | 33.59 | Strong Trend | Trend is strong, direction unclear across timeframes |
| Bollinger Bands | Middle Band | Watch | Price below middle band on 1D/4H, above on 1H |
The path forward for Brent crude at $74.97 is fraught with technical ambiguity. While the short-term charts hint at a possible rally, the longer-term trends and the critical resistance at $75.57 suggest that the bears may still have the upper hand. Patience and risk management are key here. Traders should look for clear signals confirming either a sustained move above resistance or a breakdown below key support levels before committing to a directional trade. The market is currently in a state of flux, and discerning the true trend will require careful observation of price action and confirmation from underlying macroeconomic drivers.
Track markets in real-time
AI-powered analysis, technical indicators and real-time price data.
Join Our Telegram Channel
Breaking market news, AI analysis and trading signals instantly.
Join Channel