The battleground is set as the Dollar Index (DXY) eyes the critical $101.66 resistance level. With a potent combination of global risk-off sentiment and a strengthening US dollar narrative, bulls are making a determined push. However, as always in the complex world of currency markets, bears are not far behind, waiting for any sign of weakness to reassert control. This analysis delves into the intricate technicals and prevailing market conditions that are shaping the DXY's immediate future, exploring whether this current upward momentum has the legs to break through key resistance or if it's merely a pause before a potential pullback.
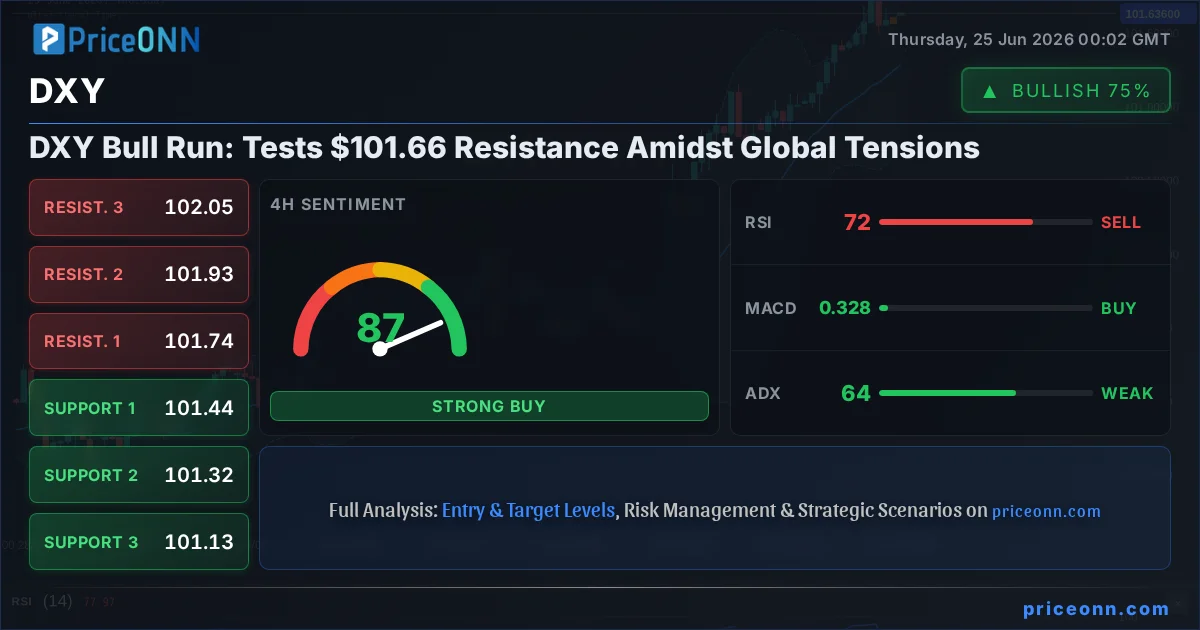
- RSI at 76.65 on the daily chart signals strong overbought pressure, suggesting a potential for consolidation or pullback.
- Critical resistance sits at $101.77, a level that has capped previous upward attempts and requires significant conviction to break.
- MACD histogram shows positive momentum on the daily chart, supporting the bullish trend, but the Stochastic oscillator is entering overbought territory.
- The DXY's correlation with global risk sentiment is key; a sustained equity sell-off could further bolster the dollar's safe-haven appeal.
The current market environment presents a compelling narrative for the US dollar. As risk appetite wavers across global equity markets, exemplified by the pullback in the S&P 500 and Nasdaq, the DXY often finds itself as the primary beneficiary. This flight to safety, a well-trodden path in times of uncertainty, is currently reinforcing the dollar's status as a premier safe-haven asset. The data shows DXY at $101.66, a level that is not just a number but a psychological barrier and a technical pivot point. Its ascent is being closely watched by traders worldwide, as its movements have profound implications for gold, major currency pairs like EUR/USD and GBP/USD, and indeed, the global financial system.
The Bullish Case: Momentum and Macro Tailwinds
Riding the Wave of Risk Aversion
The primary driver behind the DXY's current strength appears to be a palpable shift in global risk sentiment. News of geopolitical tensions and the ongoing tech sector sell-off, as reported on June 24th, have clearly spooked investors. When technology stocks, typically a bellwether for risk-on sentiment, begin to falter, capital tends to flow towards perceived safe havens. The US dollar, with its deep liquidity and global reserve status, is the natural destination for such flows. The DXY's upward trajectory, particularly its ability to hold ground and even push higher, signals that this risk-off sentiment is not merely a fleeting concern but a sustained theme in the market. This dynamic is crucial for understanding the current strength; it's not just about the US economy in isolation, but about the relative attractiveness of the dollar compared to other, riskier assets.
Technical Confirmation: Strength Across Timeframes
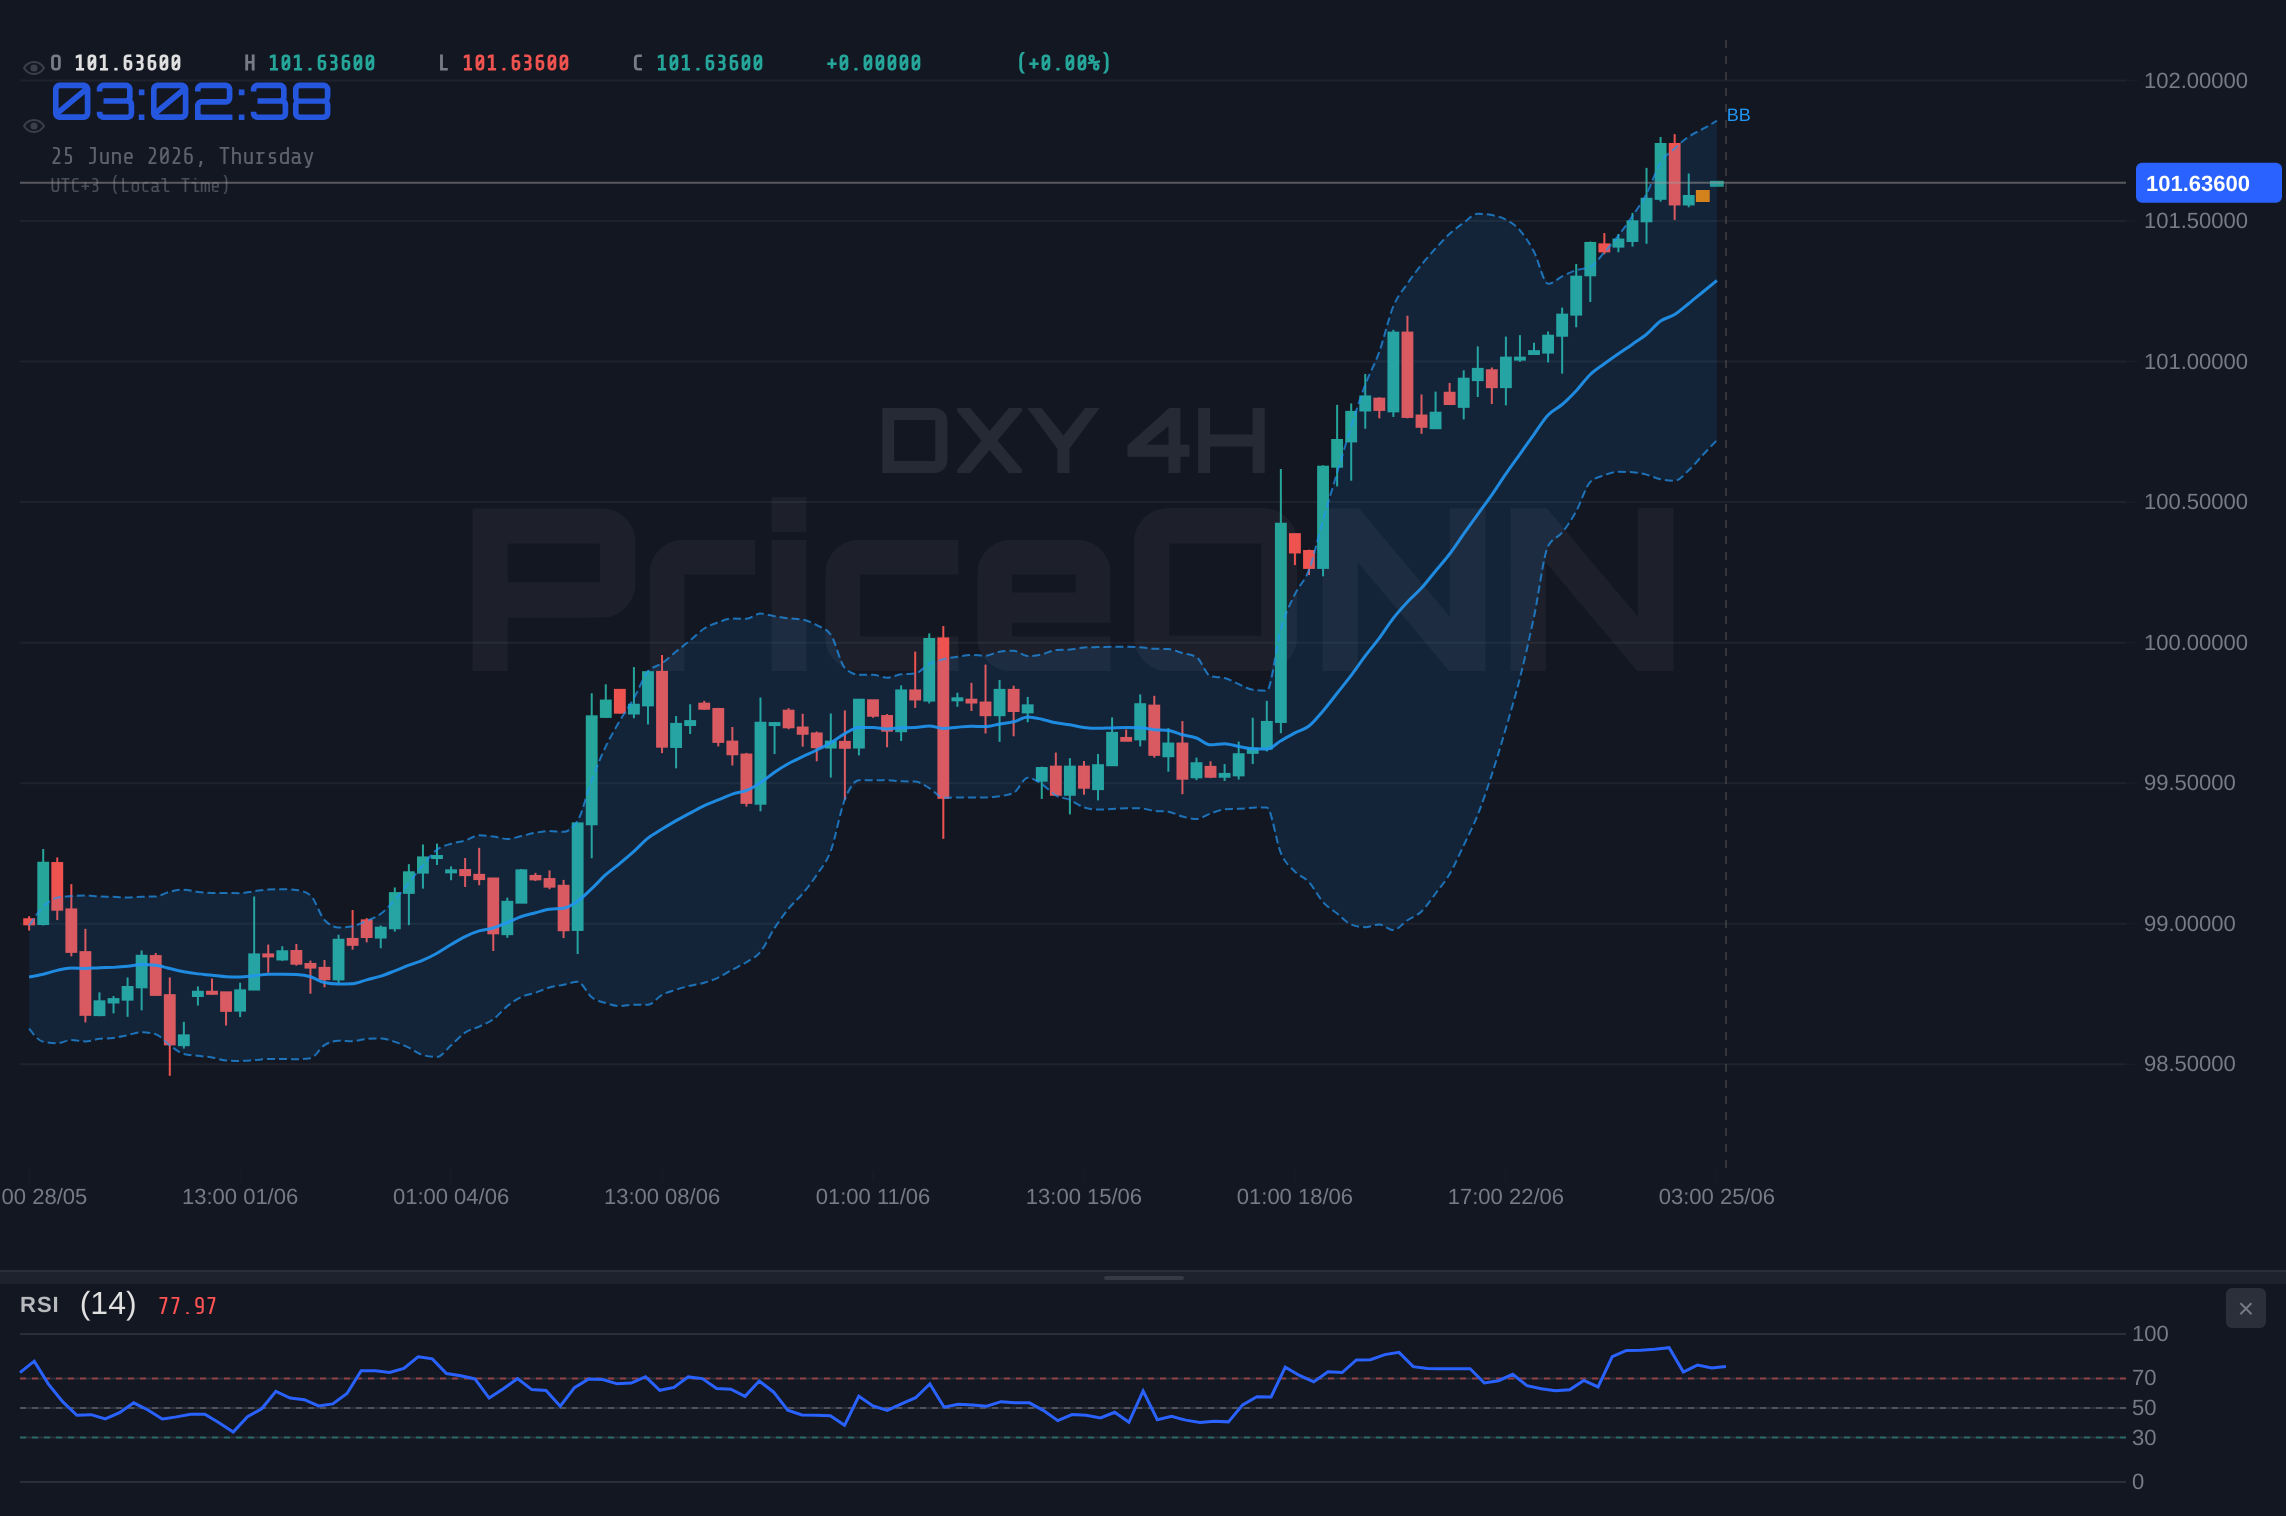
Looking at the technical indicators, the DXY presents a bullish picture, especially when viewed across multiple timeframes. On the 1-hour chart, the trend is strong, with ADX at 44.94 indicating a powerful trend is in play. While RSI is in neutral territory at 59.87, the MACD shows positive momentum. The 4-hour chart reinforces this bullish sentiment, with a strong upward trend and ADX at 64.34 – a very strong trend indeed. Here, RSI at 71.63 is entering overbought territory, which might suggest a short-term consolidation, but the overall trend remains firmly bullish. The daily chart continues the theme, with a strong upward trend and ADX at 38.39. RSI at 76.65 on the daily is a significant overbought reading, signaling that bulls might be overextending themselves. However, the MACD histogram remains positive, and the Stochastic oscillator is in the overbought zone, showing %K above %D, which can sometimes precede further upward moves before a reversal. This confluence of indicators across timeframes, particularly the strong ADX readings, suggests that the underlying trend is robust.
The Dollar's Carry Trade Appeal
Beyond immediate risk sentiment, the structural appeal of the US dollar as a carry trade currency cannot be overlooked. With the Federal Reserve maintaining a relatively hawkish stance compared to some other major central banks, interest rate differentials tend to favor the dollar. While the ECB's recent policy tightening is described as 'calibrated' rather than a 'huge, gigantic' push, as highlighted by ECB Chief Economist Philip Lane, the Fed's actions and forward guidance have often been perceived as more aggressive. This differential can encourage carry trades, where investors borrow in low-interest-rate currencies to invest in higher-yielding ones, thereby increasing demand for the dollar. The DXY's current price action, moving towards $101.77 resistance, suggests that these interest rate differentials are indeed playing a role in supporting the dollar's strength.
The Bearish Counter-Argument: Overbought Conditions and Potential Reversals
RSI Warning: Approaching Overbought Territory
While the bulls are celebrating, the technical indicators are flashing warning signs that cannot be ignored. On the daily chart, the Relative Strength Index (RSI) is sitting at 76.65. Readings above 70 are traditionally considered overbought, suggesting that the asset has risen too far, too fast, and is due for a correction or at least a period of consolidation. This is not a minor divergence; it's a significant overbought signal that has historically preceded reversals or significant pullbacks in the DXY. While momentum, as indicated by the MACD histogram, is still positive, the RSI is a leading oscillator that often anticipates shifts in momentum. This overbought condition on the daily timeframe is the most prominent argument for the bears, suggesting that the current rally might be nearing exhaustion.
Stochastic Oscillator Divergence
Further complicating the bullish picture is the Stochastic oscillator. While the daily chart shows %K (87.03) above %D (82.41), indicating a bullish signal within the overbought zone, the 1-hour chart presents a different story. Here, Stochastic shows %K (45.46) just above %D (45.28), suggesting a potential for upward movement, but the 4-hour chart has %K (81.76) above %D (89.77), which is a bearish signal in the overbought region. This divergence across timeframes, particularly the bearish signal on the 4-hour chart, adds another layer of complexity. It suggests that while the immediate hourly momentum might be positive, the medium-term outlook is showing signs of topping out. The interplay between these oscillators, especially when they contradict each other across different timeframes, often signals a period of indecision or consolidation ahead.
Fed Pivot Speculation and Inflation Data
The narrative around the Federal Reserve's future policy path is a constant source of volatility. While current data suggests a hawkish stance, any hint or speculation of a Fed pivot – a move towards easing monetary policy – could send the DXY tumbling. Traders are constantly scrutinizing economic data, particularly inflation figures and employment reports, for clues about the Fed's next move. If inflation shows signs of cooling more rapidly than expected, or if the labor market weakens significantly, speculation about rate cuts could intensify, putting downward pressure on the dollar. Although the current trend is bullish, a sudden shift in Fed expectations, driven by upcoming economic data, could quickly invalidate the bullish thesis.
Key Levels and Scenarios: Navigating the $101.66 Crossroads
The Battle for $101.77: A Critical Juncture
The immediate price action around $101.66 is crucial, but the real battleground lies at the $101.77 resistance level. This is a significant technical barrier that has capped previous rallies. A decisive break above $101.77, ideally on strong volume and sustained price action, would signal a continuation of the bullish trend, potentially targeting higher levels. Conversely, failure to overcome this resistance, coupled with a close below the $101.58 support, could signal the end of the current rally and a move towards lower support levels. The $101.58 support is vital; a break below it would likely trigger stop-loss orders and accelerate selling pressure, targeting the next support at $101.39.
Correlation Analysis: DXY and Global Markets
The DXY's movement is intrinsically linked to other major markets. Currently, with the DXY at $101.66 and showing a strong upward trend, we see a corresponding weakness in assets like gold (XAUUSD currently at $4011.54) and the Euro (EURUSD at $1.13539). The decline in oil prices (Brent at $73.47) also plays into this dynamic; lower energy prices can ease inflation concerns, potentially influencing central bank policy and, by extension, currency valuations. The S&P 500, trading around 6572.87, is showing signs of weakness, which typically correlates with dollar strength. This interconnectedness means that any significant move in these correlated assets can provide further confirmation or contradiction to the DXY's directional bias.
The Role of Economic Data Releases
Looking ahead, upcoming economic data releases will be pivotal. Key reports such as Non-Farm Payrolls (NFP) and Consumer Price Index (CPI) data for the US will be closely scrutinized for their impact on Fed policy expectations. For instance, stronger-than-expected inflation data could reinforce the Fed's hawkish stance, supporting the DXY. Conversely, weaker data might fuel speculation of a Fed pivot, leading to a dollar sell-off. Similarly, Eurozone inflation and growth figures will influence the EUR/USD pair, indirectly impacting the DXY. Traders are also keeping an eye on central bank communications for any shifts in tone or forward guidance.
Trade Scenarios and Strategic Outlook
Bearish Scenario: Dollar Reverses at $101.77
65% ProbabilityNeutral Scenario: Consolidation Around $101.66
25% ProbabilityBullish Scenario: Breaking Resistance Towards $102.08
10% ProbabilityFrequently Asked Questions: DXY Analysis
What happens if DXY breaks above $101.77 resistance?
A sustained break above $101.77, especially on a daily close, would validate the bullish trend and likely trigger further upside towards $101.93 and then $102.08. This would signal continued risk aversion and potentially stronger Fed hawkishness.
Is RSI at 76.65 a sell signal for DXY right now?
A daily RSI of 76.65 indicates significant overbought conditions, traditionally a warning sign for bulls. While it doesn't guarantee an immediate reversal, it suggests that the current rally is stretched and vulnerable to profit-taking or consolidation, making it a signal for caution rather than immediate selling.
How will the upcoming NFP data affect DXY if it prints above 250K?
A Non-Farm Payrolls report printing significantly above 250K would likely reinforce the Fed's hawkish stance, supporting the DXY. This could push the index higher, potentially breaking resistance levels as markets price in a firmer stance on inflation from the Federal Reserve.
Should I consider shorting DXY if it fails to hold $101.58 support?
If DXY closes below the $101.58 support level on a daily basis, it would invalidate the current bullish setup and increase the probability of a move towards $101.39 and $101.08. This would be a strong signal for short-sellers to enter the market.
| Indicator | Value | Signal | Interpretation |
|---|---|---|---|
| RSI (14) | 76.65 | Overbought | Potential reversal/consolidation zone |
| MACD Histogram | +0.26 | Positive Momentum | Supports uptrend |
| Stochastic (K) | 87.03 | Overbought | Entering extreme zone |
| Stochastic (D) | 82.41 | Overbought | Entering extreme zone |
| ADX | 38.39 | Strong Trend | Trend is significant |
| Bollinger Bands | Price above Middle Band | Bullish Bias | Trend continuation likely |
The DXY's path forward hinges on its ability to decisively break through the $101.77 resistance. While bullish momentum is evident, the daily overbought RSI at 76.65 suggests caution is warranted. Traders should monitor price action closely around the key $101.58 support and $101.77 resistance levels. A failure to hold support or break resistance could lead to a significant pullback, while a confirmed breakout might signal a continuation of the dollar's strength, especially if global risk aversion persists. The market remains dynamic, and adherence to technical levels and risk management will be paramount in navigating these choppy waters.
Track markets in real-time
AI-powered analysis, technical indicators and real-time price data.
Join Our Telegram Channel
Breaking market news, AI analysis and trading signals instantly.
Join Channel