The US Dollar Index (DXY) is currently navigating a critical juncture, trading at $101.38 as market participants digest recent inflation data and evolving Federal Reserve expectations. This pivotal price point, hovering near key support levels, represents a battleground for bulls and bears alike. Recent price action suggests a loss of momentum, with the index dipping below the 101.50 mark, a move that warrants a deeper dive into the technicals and potential scenarios shaping the dollar's near-term trajectory. Understanding the interplay between technical indicators, macroeconomic drivers, and market sentiment is crucial for deciphering where the DXY might head next.
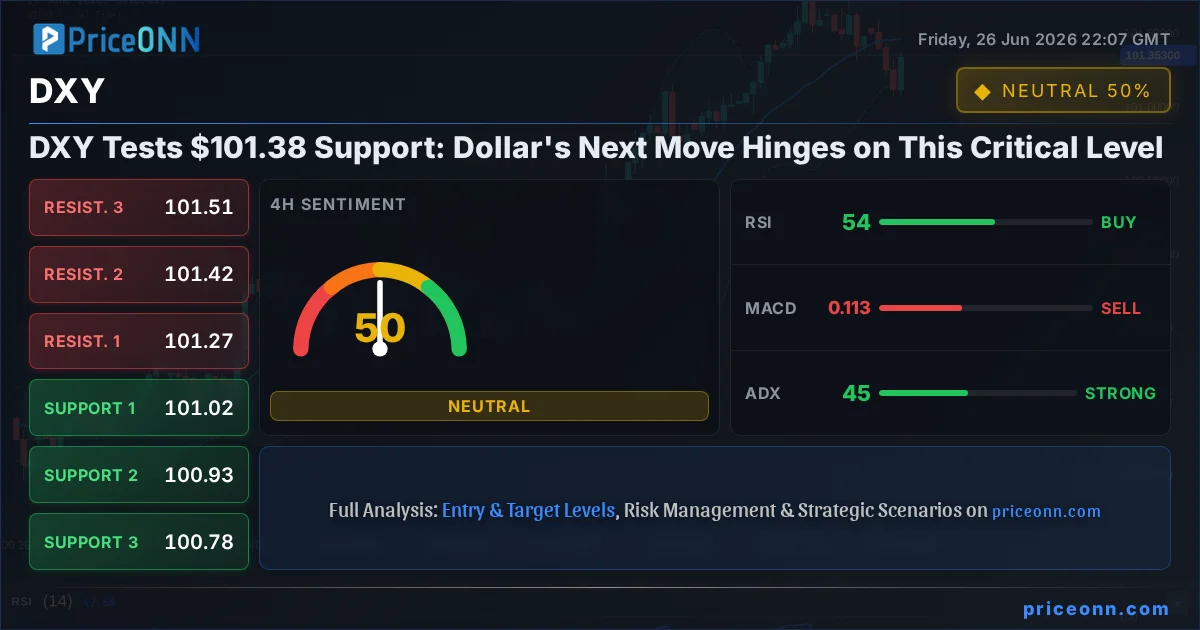
- The DXY is currently trading at $101.38, testing crucial support levels.
- RSI at 50.98 on the 1H chart shows neutral momentum, while the 4H RSI at 54.11 suggests a slight upward bias.
- Critical support for the DXY is located at $101.28, with resistance eyed at $101.40.
- The dollar's direction is increasingly influenced by shifting Federal Reserve rate hike expectations following recent PCE inflation data.
Having tracked the DXY through periods of significant volatility, the current setup presents a fascinating case study in market psychology and data-driven decision-making. The dollar's recent retreat below 101.50, spurred by fading Fed rate hike odds after the latest PCE inflation figures, underscores the sensitivity of currency markets to monetary policy signals. This price action is not just a number; it represents a shift in sentiment and a crucial test for the greenback's recent strength. As traders and investors analyze this delicate balance, the $101.38 level becomes more than just a price point - it's a gauge of market conviction.
Navigating the Technical Landscape: A Multi-Timeframe View
Delving into the technical indicators provides a clearer picture of the forces at play. On the 1-hour timeframe, the DXY exhibits a neutral trend with a power score of 50%. The RSI(14) at 50.98 sits squarely in neutral territory, indicating a lack of strong directional conviction, though it shows a slight upward inclination. The MACD is currently displaying positive momentum, with the MACD line trading above its signal line, a sign that short-term buying pressure might be emerging. However, the Stochastic Oscillator is flashing a warning sign, with %K at 93.76 and %D at 53.15, pointing towards an extremely overbought condition on this timeframe, suggesting a potential pullback or consolidation is imminent. The ADX at 18.44 further confirms a weak trend, highlighting a market that is not yet committed to a strong directional move.
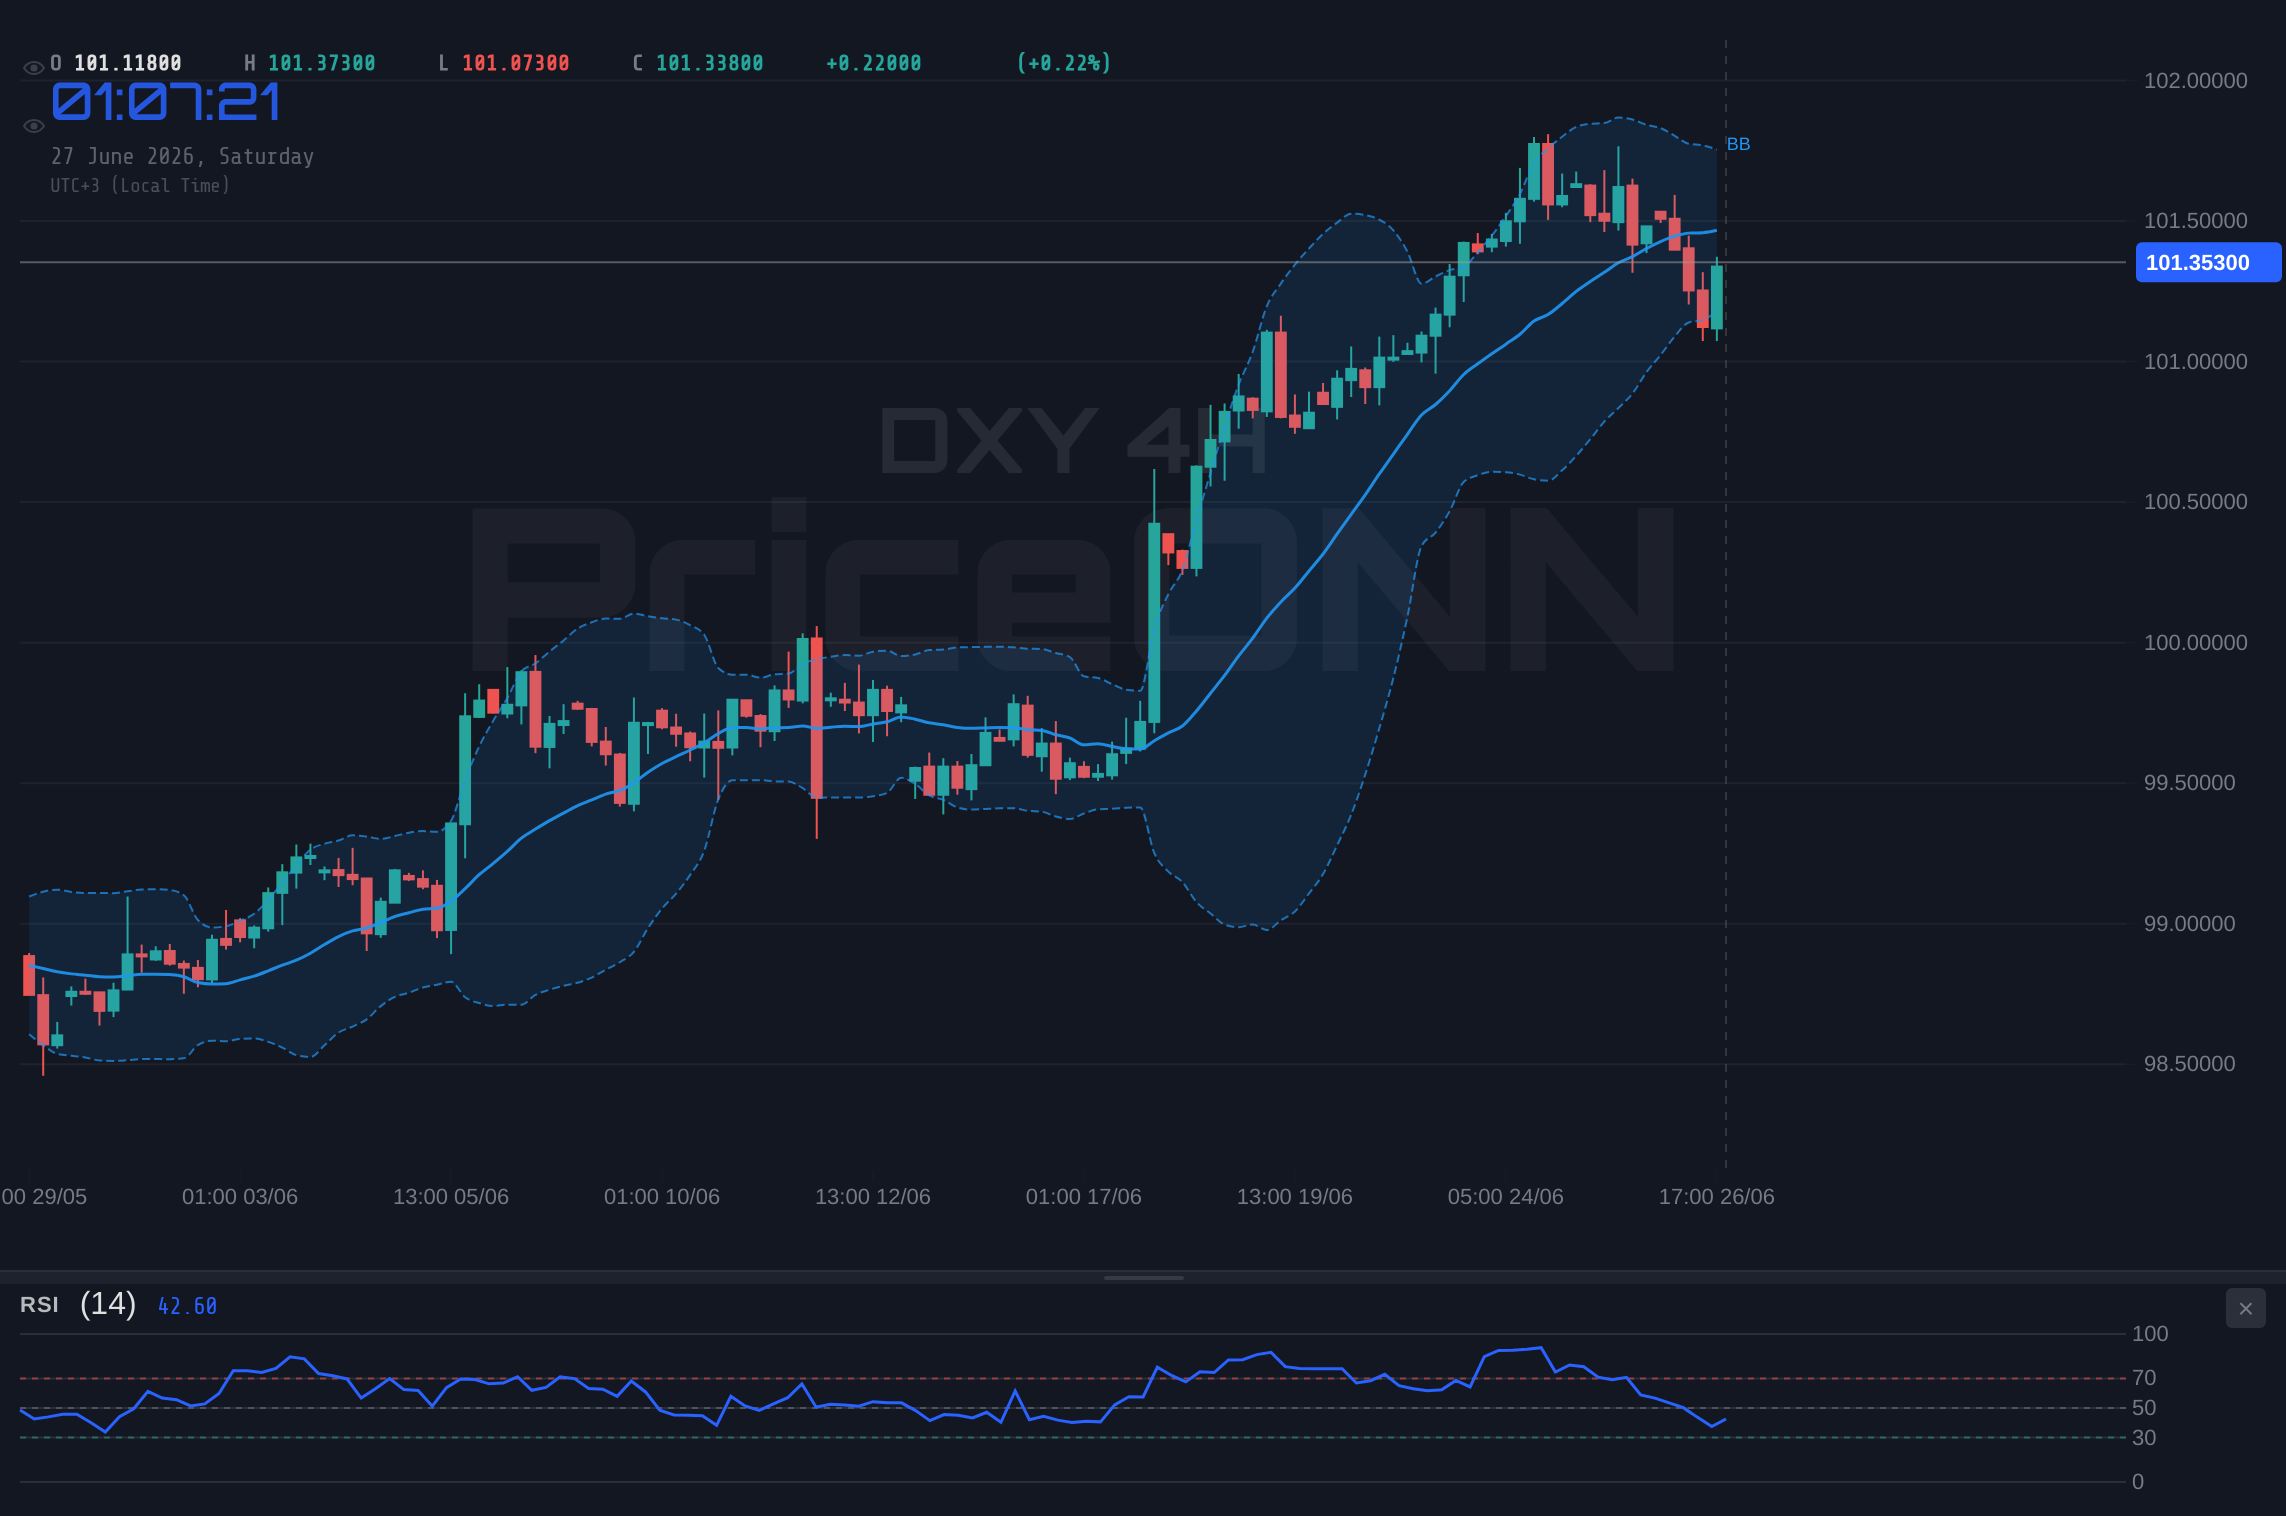
Transitioning to the 4-hour chart, the picture becomes more complex. The trend is still neutral with a 50% power score, but the RSI(14) at 54.11 leans slightly bullish, suggesting some underlying buying interest. The MACD, however, has flipped to negative momentum, sitting below its signal line, which contradicts the RSI's lean. Bollinger Bands are positioned below the middle band, hinting at a potential downward bias or a period of consolidation. The Stochastic Oscillator, with %K at 20.13 and %D at 25.05, is in oversold territory and showing a potential bearish signal as %K is below %D. Meanwhile, the ADX at 45.01 indicates a strong trend, but its directionality is unclear given the mixed signals from other indicators. This multi-timeframe conflict suggests caution is warranted.
The daily timeframe offers the broadest perspective, revealing a more defined trend. Here, the DXY shows a strong bullish trend with a power score of 100%. The RSI(14) at 71.59 is firmly in overbought territory, a classic signal that the asset may be due for a correction or consolidation. The MACD is positive and above its signal line, reinforcing the bullish sentiment on this longer timeframe. Bollinger Bands are trading above the middle band, supporting the upward trend. The Stochastic Oscillator, with %K at 86.36 and %D at 89.87, is also in overbought territory, confirming the daily RSI's reading and signaling a potential for a reversal or at least a pause. The ADX at 40.81 signifies a strong trend, aligning with the bullish conviction seen on this daily chart. This divergence between the shorter timeframes and the daily trend is a key element to watch.
Fundamental Drivers: Fed Policy and Inflation's Shadow
The recent US PCE inflation data, a key metric closely watched by the Federal Reserve, has significantly influenced market sentiment. A softer-than-expected reading has dampened expectations for further aggressive interest rate hikes from the Fed. This shift in monetary policy outlook is a primary driver behind the dollar's recent dip below 101.50. When the market perceives a lower probability of rate hikes, or even anticipates potential rate cuts, the appeal of holding dollar-denominated assets diminishes, leading to downward pressure on the DXY. This correlation is fundamental: a less hawkish Fed generally translates to a weaker dollar, all else being equal.
The implications of this dovish pivot, even a subtle one, are profound. Treasury yields, which often move in tandem with interest rate expectations, are likely to face downward pressure. Lower yields make US bonds less attractive to foreign investors, reducing demand for dollars needed to purchase these assets. This dynamic reinforces the bearish sentiment for the DXY in the short to medium term. Furthermore, the market's reaction to the PCE data suggests that investors are closely monitoring inflation trends as a precursor to Fed action. Any further signs of cooling inflation could solidify the narrative of a Fed on hold or even leaning towards easing, thus extending the dollar's weakness.
The geopolitical landscape also continues to play a role, albeit a secondary one in this specific price action. While not the primary driver of the DXY's move below 101.50, global risk sentiment can influence safe-haven flows. In times of heightened geopolitical tension, the dollar often benefits from its safe-haven status. However, with the current focus squarely on domestic monetary policy, the dollar's strength is more tightly linked to interest rate differentials and inflation expectations. Any escalation in global conflicts could, however, quickly shift the narrative and provide a boost to the DXY, irrespective of Fed policy.
The Battle for $101.38: Scenarios and Probabilities
Given the conflicting signals across different timeframes and the nuanced fundamental backdrop, the DXY's immediate future hinges on the $101.38 level. Several scenarios are plausible, each with its own set of triggers and potential outcomes.
Bearish Scenario: Dollar's Descent Continues
35% ProbabilityConsolidation Phase: The Waiting Game
45% ProbabilityBullish Rebound: Dollar's Resilience Tested
20% ProbabilityThe most probable scenario, at least in the immediate short term, appears to be a period of consolidation. The conflicting signals between the 1-hour and daily timeframes, coupled with the neutral RSI readings on the shorter frames, suggest that the market is hesitant to commit to a strong directional move without further clarity. The 45% probability assigned to the neutral scenario reflects this indecision. However, the strong bullish trend on the daily chart cannot be ignored. If any hawkish undertones emerge from the Federal Reserve or if geopolitical risks escalate, a swift reversal could occur, pushing the DXY higher. The bearish scenario, while less probable currently at 35%, remains a significant risk, especially if support at $101.28 fails to hold, potentially exacerbated by further dovish Fed commentary or weaker-than-expected upcoming US economic data.
The Trader's Perspective: What to Watch Next
For short-term traders, the $101.28 support level is paramount. A decisive break below this level on the 4-hour chart, confirmed by subsequent price action and potentially a bearish MACD cross on the 1-hour chart, could signal a further decline towards $101.07 and potentially $100.93. Conversely, a successful defense of $101.28, especially if accompanied by a bullish MACD crossover and a move out of overbought conditions on the 1-hour Stochastic, could open the door for a move back towards $101.40 and potentially higher resistance levels.
Swing traders will likely be watching the confluence of indicators on the daily chart. The overbought RSI (71.59) and Stochastic (K=86.36, D=89.87) suggest that the current bullish trend might be extended and due for a pullback. A break below the $101.28 support level could be the first sign of a significant reversal, potentially targeting the $100.93 area. On the other hand, if the DXY manages to consolidate above $101.38 and then breaks through the $101.40 resistance, it could signal a continuation of the daily uptrend, though the overbought conditions suggest any rally might be met with profit-taking.
The correlation with other markets is also essential. The recent weakness in the Nasdaq100 index, trading at 28998.91, suggests a potential risk-off environment. Typically, this would bolster the dollar's safe-haven appeal. However, the DXY's current struggle near support indicates that the narrative is currently dominated by Fed policy expectations rather than global risk sentiment. If equity markets continue to decline sharply, it could eventually provide a floor for the DXY, even if interest rate expectations remain subdued. Conversely, a rebound in the Nasdaq100 could coincide with a weaker dollar if it signals a return of risk appetite, leading investors to shun safe-haven assets.
Looking ahead, upcoming economic data releases will be critical. Any surprises in US employment figures or inflation reports could dramatically shift Fed expectations and, consequently, the DXY's trajectory. Traders will be scrutinizing Fed commentary for any hints about future policy direction. The market is currently pricing in a certain probability of rate hikes, and any deviation from this expectation will likely cause significant price movement. The current technical picture, with its mixed signals and key levels being tested, means that fundamental catalysts will likely dictate the next significant move.
The market remains highly sensitive to Federal Reserve policy shifts and inflation data. Significant volatility can occur around key economic releases. Always implement robust risk management strategies.
Frequently Asked Questions: DXY Analysis
What happens if DXY breaks below the $101.28 support level?
A break below $101.28 could trigger further downside, with the next target likely at $101.07. This would invalidate the short-term bullish bias and suggest a deeper correction is underway, potentially driven by sustained dovish Fed expectations.
Should I buy DXY at current levels of $101.38 given the daily uptrend?
Buying at $101.38 carries risk due to overbought conditions on daily charts (RSI 71.59) and conflicting signals on shorter timeframes. A more prudent approach might be to wait for a confirmed bounce off support around $101.28 or a clear break above $101.40 resistance, potentially offering a better risk/reward ratio.
Is the RSI at 50.98 a sell signal for DXY right now?
An RSI of 50.98 on the 1-hour chart is considered neutral, not a direct sell signal. It indicates a lack of strong momentum in either direction. However, when viewed alongside the overbought daily RSI of 71.59, it suggests the overall upward momentum may be tiring, warranting caution against aggressive new long positions.
How will upcoming PCE inflation data affect DXY this week?
The PCE data has already influenced expectations, contributing to the DXY's dip below 101.50. If future inflation figures are significantly higher than expected, it could reignite hawkish Fed sentiment and boost the dollar. Conversely, softer data could further pressure the DXY, potentially leading to a break of key support levels.
The DXY's dance around $101.38 is a microcosm of the broader market's uncertainty. While the daily trend remains bullish, shorter-term indicators and shifting Fed expectations are creating a tug-of-war. The key takeaway is that $101.28 acts as a critical support line; its defense or breach will likely dictate the dollar's path in the immediate future. Traders must remain vigilant, monitor technical signals for confirmation, and stay attuned to macroeconomic data and central bank commentary that will shape the narrative going forward.
| Indicator | Value | Signal | Interpretation |
|---|---|---|---|
| RSI (14) | 50.98 | Neutral | Neutral momentum on 1H, slight bullish lean on 4H (54.11), overbought on Daily (71.59). |
| MACD Histogram | Positive | Bullish | Positive momentum on 1H, negative on 4H, positive on Daily. Mixed signals. |
| Stochastic | K=93.76, D=53.15 | Bearish | Extremely overbought on 1H, oversold on 4H, overbought on Daily. Conflicting signals indicate caution. |
| ADX | 18.44 | Weak | Weak trend on 1H (18.44), strong on 4H (45.01), strong on Daily (40.81). Trend strength varies significantly by timeframe. |
| Bollinger Bands | Mid-Band Test | Watch | 1H above mid-band, 4H below, Daily above. Price action is testing Bollinger Bands across timeframes. |
Track markets in real-time
AI-powered analysis, technical indicators and real-time price data.
Join Our Telegram Channel
Breaking market news, AI analysis and trading signals instantly.
Join Channel