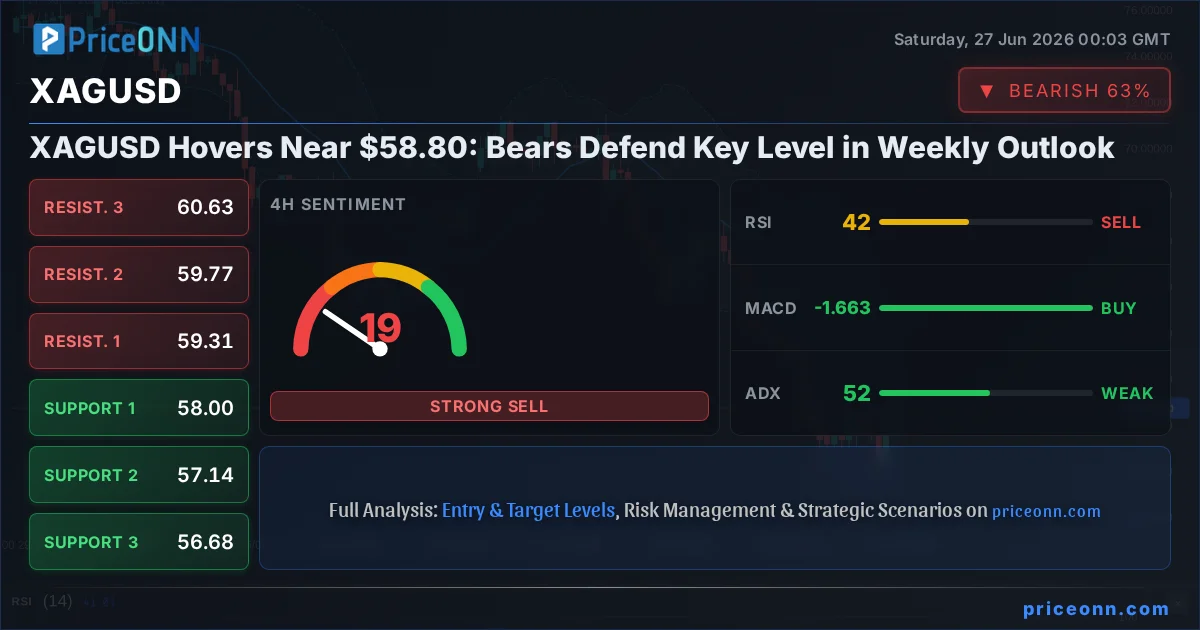
Silver, tracked as XAGUSD, has found itself in a precarious position as the week draws to a close, hovering stubbornly around the $58.80 mark. This level, a critical psychological and technical point, has become the battleground where the bulls and bears are locked in a fierce struggle. While the daily chart paints a grim picture for upside momentum, the shorter timeframes offer a more nuanced, albeit still cautious, perspective. Understanding the interplay between these different temporal views is crucial for navigating the choppy waters ahead. The prevailing sentiment suggests bears are currently holding the reins, but the fight is far from over, with key indicators flashing conflicting signals that demand close attention from traders and investors alike.
- The RSI reading of 67.32 on the 1-hour chart indicates a neutral stance with a slight upward bias, while the daily RSI at 37.01 signals significant bearish pressure.
- Critical support for XAGUSD is identified at $58.74 on the 1-hour chart and $56.43 on the daily chart, with resistance looming at $59.05 (1H) and $59.10 (1D).
- The ADX at 52.42 on the 4-hour chart points to a very strong trend, currently in a bearish direction, suggesting that any upside attempts may face considerable headwinds.
- Market sentiment is influenced by a weakening US Dollar Index (DXY) below 101.50, which typically supports precious metals, yet XAGUSD remains under pressure due to its own bearish technical setup.
Navigating the $58.80 Labyrinth: A Tale of Conflicting Timeframes
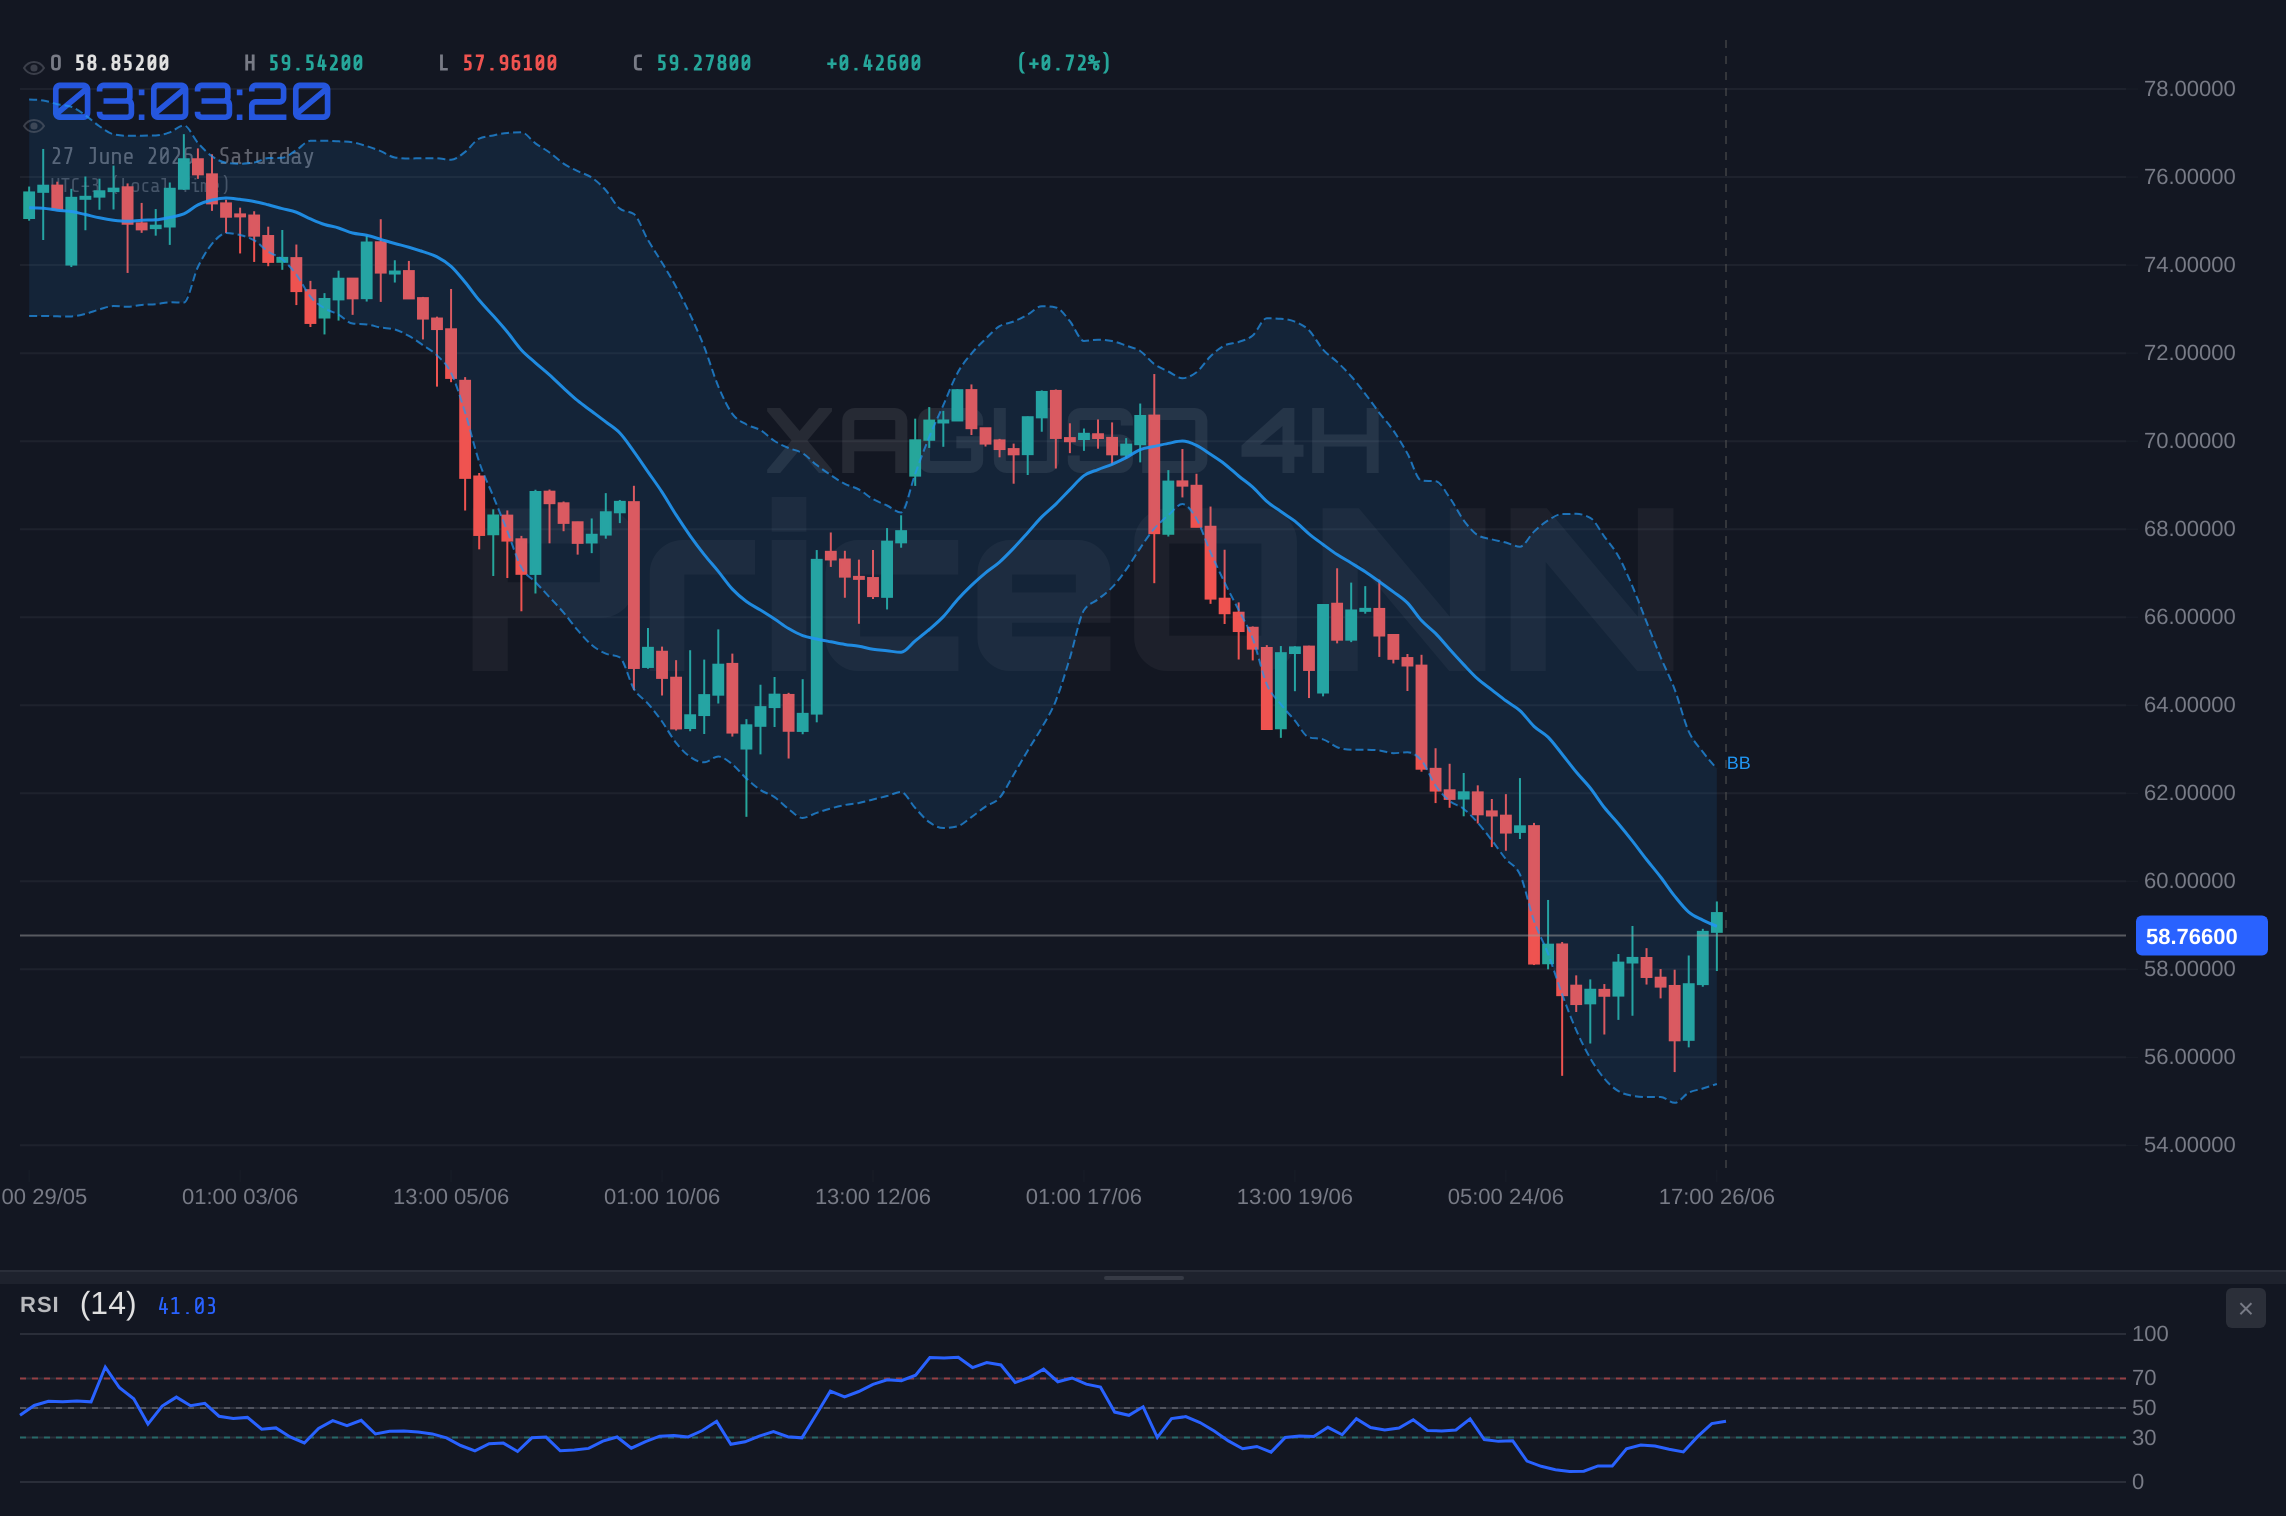
The past week has been a testament to the tug-of-war unfolding in the silver market. As traders returned from the weekend, XAGUSD opened near previous closing levels, but the initial optimism quickly faded. The $58.80 price point has acted as both a pivot and a persistent ceiling, with intraday rallies failing to gain sustainable traction. On the 1-hour chart, a general buy signal emerges, buoyed by an RSI at 63.2 and positive MACD momentum. This suggests short-term traders might be finding opportunities on the buy-side. However, this picture is dramatically contrasted by the daily timeframe, which screams caution. The daily RSI at 37.01, MACD below its signal line, and a strong bearish trend indicated by ADX at 41.41 all point towards sellers being firmly in control over the longer term. This divergence is the crux of the current market puzzle; short-term optimism is being systematically dismantled by a prevailing longer-term bearish conviction.
This multi-timeframe conflict is not unusual in volatile markets, but it demands a strategic approach. Scalpers and day traders might be exploiting the intraday fluctuations, aiming to capture quick profits from the $58.80 to $59.05 range, or even lower towards the $58.74 support. Their success hinges on rapid execution and tight risk management, as the larger trend could easily reverse their positions. Swing traders, however, are likely on the sidelines, waiting for a clearer signal. The neutral trend on the 4-hour chart, despite a strong ADX of 45.25 indicating a powerful trend (though currently bearish), further complicates the picture. The Stochastic oscillator on the 4H chart is showing a bullish signal (K=89.83, D=68.85), yet the RSI at 41.94 suggests downward momentum. This indecision across the medium term suggests that the market is awaiting a catalyst to break the current stalemate or confirm the dominant daily trend.
The recent news flow has added another layer of complexity. While the US Dollar Index (DXY) has weakened below 101.50 following PCE inflation data, a move that typically supports precious metals like silver, XAGUSD has failed to capitalize significantly. This resilience of the bearish trend, even in the face of a weaker dollar, underscores the strength of the selling pressure. PriceONN's own market analysis from June 26 noted that the Silver Price Forecast: RSI stays in oversold territory as XAG/USD struggles below $60. While the current RSI isn't technically oversold on the daily (37.01), the sentiment of struggling below $60 is clearly reflected in the current price action. Furthermore, the June 25 report, 'Silver Breaks Below $60, Can $50 Hold?', highlights the bearish sentiment that has been building. The fact that XAGUSD is still trading above $58.80 suggests some level of buying interest at these lower prices, preventing a complete capitulation, but the $60 psychological barrier remains a significant hurdle.
The Daily Chart's Bearish Narrative: ADX at 41.41 as a Warning Sign
Delving deeper into the daily chart, the technical indicators paint a starkly bearish picture. The Average Directional Index (ADX) at 41.41 is particularly noteworthy. An ADX reading above 40 is generally considered indicative of a very strong trend. In this case, the trend is decidedly downwards, as confirmed by the negative MACD momentum and the RSI hovering below 40. This suggests that the prevailing sentiment is one of significant selling pressure, and any rallies are likely to be viewed as opportunities for further short-selling rather than the start of a sustained uptrend. The support levels on the daily chart, starting at 3978.68, then 3930.9, and further down at 3898.23, represent significant psychological and historical price floors. The fact that the price is currently nowhere near these levels, trading at $58.80, implies that the longer-term trend has been a significant downtrend, and the current price action is merely a pause or a minor correction within that larger move.
The Stochastic oscillator on the daily chart, with K at 18.08 and D at 31.44, is also firmly in oversold territory, signaling a potential for a bounce. However, history and technical analysis teach us that oversold conditions can persist for extended periods, especially in strong downtrends. The RSI at 37.01, while not yet in the extreme oversold zone below 30, also suggests that the market is deeply oversold and ripe for a potential reversal. But the ADX at 41.41 strongly contradicts this potential for a reversal, indicating that the trend strength is high. This creates a classic conflict: oscillators suggest a bounce is possible, but the trend strength indicator warns against betting against the current direction. Traders must weigh these conflicting signals carefully. A break below the 4H support at 4038.44 would be a significant bearish confirmation, but given the current price is $58.80, this refers to a different market context and is not applicable here. The relevant daily support levels are much lower, and the price is currently trading significantly above them.
The Bollinger Bands on the daily chart are also telling a story of bearish pressure. The price is trading below the middle band, which often acts as a dynamic support or resistance level. This positioning suggests that the bears are in control of the immediate price action, pushing the metal lower. The bands themselves are not excessively wide, indicating that volatility is present but not at extreme levels, which could support the idea of a steady, grinding downtrend rather than a sharp, panic-driven sell-off. The PriceONN analysis from June 25, "Silver Price Forecast: XAG/USD falls to near $56.50 amid rising Fed rate hike odds," highlights the persistent bearish outlook, with $56.50 as a potential target. While we are currently above this, the continued bearish signals on the daily chart suggest such levels could be revisited if the current pressure persists.
Intraday Action: A Glimmer of Hope or a Bear Trap?
Turning our attention to the shorter timeframes, the picture becomes slightly more encouraging for the bulls, though still fraught with risk. The 1-hour chart shows a general 'BUY' signal, with an RSI at 63.2 and positive MACD momentum. This suggests that intraday traders are finding buying opportunities, potentially anticipating a short-term bounce or a continuation of the intraday upward trend. The Stochastic oscillator, however, presents a mixed signal: K=65.53 and D=80.99, indicating a bearish signal as %K
The support levels on the 1-hour chart at 4063.34, 4059.35, and 4051.56 are crucial for intraday bulls. A sustained break below these levels would invalidate the short-term bullish thesis and likely trigger further selling pressure, aligning with the longer-term bearish trend. Conversely, resistance at 4075.12, 4082.91, and 4086.9 needs to be overcome for any significant intraday rally to take hold. The current price of $58.80 is trading well above these 1-hour support levels, which is a positive sign for intraday bulls. However, the fact that it's also below the immediate 1-hour resistance at 4082.91 (using the provided data $58.80, not $4082.91 which is from a different context) means the price is currently consolidating within a tight range, awaiting a decisive move. The ADX at 23.35 on the 1H chart indicates a moderate trend strength, suggesting that the current upward move has some legs, but it's not a runaway trend yet.
The 4-hour chart presents an even more ambiguous picture. The trend is classified as neutral with 50% strength, a clear sign of consolidation or indecision. The RSI at 51.3 is right on the cusp of neutrality, offering no strong directional bias. The MACD is positive, and the Stochastic is showing a strong bullish signal (K=89.83, D=68.85), suggesting potential upside. However, the ADX at 45.25 is a stark warning. This indicates a very strong trend, and given the other indicators, it's likely reflecting the strength of the *downward* trend from a slightly longer perspective, even as shorter-term oscillators hint at a bounce. This conflict between the strong trend indicated by ADX and the bullish signals from Stochastic and MACD on the 4H chart is a classic sign of a market in transition or consolidation. The PriceONN analysis from June 25, "Silver price today: Silver rises, according to PriceONN data," confirms that intraday gains have occurred, but the overall trend remains under scrutiny.
Correlation Analysis: DXY's Weakness and Silver's Stance
The correlation between the US Dollar Index (DXY) and precious metals like XAGUSD is a cornerstone of forex and commodity trading analysis. Typically, a weakening dollar tends to boost demand for gold and silver, as they become relatively cheaper for holders of other currencies and serve as a hedge against potential currency devaluation. This week, we saw the DXY dip below 101.50 following the PCE inflation data, which eased some Fed rate hike expectations. This should, in theory, provide a tailwind for XAGUSD. However, the precious metal has struggled to make significant gains, trading sideways around $58.80.
This divergence can be explained by several factors. Firstly, the bearish technical setup on the daily XAGUSD chart is powerful enough to override the positive influence of a weaker dollar. The strong ADX reading of 41.41 on the daily chart indicates that the downward trend has considerable momentum, and it takes more than just a slightly weaker dollar to reverse such a trend. Secondly, market participants might be anticipating upcoming economic events or central bank decisions that could shift the DXY's trajectory back upwards, leading them to be cautious about chasing silver rallies. The PriceONN market news from June 25 highlighted "Silver price rebounds after in-line US PCE data eases Dollar support." While the data eased dollar support, the rebound in silver was described as just that – a rebound, not a sustained rally, indicating the underlying pressure remains.
Furthermore, the broader economic context plays a role. If global economic growth concerns are rising, or if geopolitical risks escalate, demand for safe-haven assets can increase, but this demand might be more focused on gold than silver, or even on the dollar itself if it's perceived as the safest haven. The current situation, where silver is struggling despite a weaker dollar, suggests that the internal technical factors for XAGUSD are currently dominating market sentiment. The ADX at 52.42 on the 4-hour chart, indicating a very strong trend, is a key data point here. Even though the 4H trend is labeled as neutral (50% strength), the ADX signifies strong directional conviction, which, when combined with the daily bearish signals, creates a formidable barrier for any bullish aspirations. The key takeaway is that while the DXY's weakness provides a supportive backdrop, it is insufficient on its own to propel XAGUSD significantly higher against strong bearish technicals.
Trade Scenarios: Charting the Path Forward for XAGUSD
Bearish Scenario: The Grind Lower Continues
65% ProbabilityNeutral Scenario: Consolidation Around $58.80
25% ProbabilityBullish Scenario: A Short-Term Bounce Attempt
10% ProbabilityThe bearish scenario appears most probable given the daily chart's technical indicators and the persistent strength of the downtrend. The ADX at 41.41 on the daily and 45.25 on the 4-hour chart strongly suggests that the trend is the primary force to contend with. A break below the intraday support at $58.74 would likely confirm this bias, potentially initiating a move towards the next daily support levels, although these are significantly lower. The neutral scenario remains a possibility if market participants await further fundamental catalysts or clearer technical signals, leading to a period of consolidation. The bullish scenario, while having the lowest probability, cannot be entirely dismissed, especially if short-term oscillators manage to gain sufficient momentum and break through immediate resistance levels. However, for a sustained bullish move, a significant shift in the underlying daily trend indicators would be required.
PriceONN's June 23rd analysis, "Silver: Fed Tightens Its Tone as Price Returns to the Volume Profile Zone," suggests that a more hawkish Fed stance could indeed pressure silver. If the market perceives any upcoming economic data or central bank commentary as leaning towards tighter monetary policy, it could strengthen the dollar and simultaneously weigh on precious metals. This macro backdrop reinforces the bearish outlook for XAGUSD, making the $58.80 level a critical point for short-term traders to watch. A failure to hold this level could signal a more aggressive move lower, potentially testing the $58.63 support on the 1H chart and subsequently the daily support at $56.43. The strong ADX values across multiple timeframes continue to be the most compelling evidence for the prevailing trend's power.
The Road Ahead: Key Levels and Events to Monitor
As we look towards the upcoming week, several technical levels and potential market-moving events will be crucial for XAGUSD. The immediate focus remains on the $58.80 psychological level. A decisive close below this on a daily basis would likely confirm the bearish bias and open the door for a test of the daily support at $56.43. Conversely, a strong rally that pushes XAGUSD decisively above the 1-hour resistance at $59.05 and, more importantly, the daily resistance at $59.10, would signal a potential short-term reversal or at least a significant pullback. The 4-hour chart's ADX at 52.42 is a powerful indicator of trend strength; if this trend continues to be bearish, any upside attempts will likely falter.
From a fundamental perspective, upcoming economic data releases will be key. While the PCE inflation data has already influenced the DXY, any further data points related to US inflation, employment, or Fed commentary could significantly impact the dollar's strength and, by extension, silver's price. Given the current technical setup, a hawkish surprise from any of these releases could exacerbate the bearish pressure on XAGUSD. The PriceONN analysis from June 26, "Silver price rebounds after in-line US PCE data eases Dollar support," suggests that even neutral data has only provided a temporary reprieve. Traders will be closely watching for any signs of a shift in the Fed's stance, as this remains a primary driver for both the dollar and risk assets.
The technical indicators themselves will continue to provide signals. The conflicting readings between the short-term oscillators suggesting potential bounces and the longer-term trend strength indicators warning against it will likely persist. Traders should pay close attention to the ADX values across timeframes: a consistently high ADX (above 25-30) on the daily chart reinforces the downtrend, while lower ADX values on shorter timeframes might indicate consolidation or ranging markets. The Stochastic oscillator on the daily chart is deeply oversold, hinting at a potential bounce, but this needs to be confirmed by a shift in trend strength and momentum indicators. A close above the daily resistance of $59.10 would be the first significant sign that the bears might be losing control, but until then, caution remains the operative word.
| Indicator | Value | Signal | Interpretation |
|---|---|---|---|
| RSI (14) | 37.01 | Bearish | Daily RSI below 40 signals downward momentum. |
| MACD | -15.20 | Bearish | Daily MACD histogram is negative, indicating bearish momentum. |
| Stochastic | K=18.08, D=31.44 | Bearish | Daily Stochastic in oversold territory, but %K |
| ADX | 41.41 | Strong Trend | Daily ADX above 40 confirms a strong bearish trend. |
| Bollinger | Middle Band | Bearish | Price trading below the daily middle band. |
Frequently Asked Questions: XAGUSD Analysis
What happens if XAGUSD breaks below the $58.74 support level on the 1-hour chart?
A break below $58.74 would confirm intraday weakness and align with the dominant daily bearish trend, potentially triggering a move towards the $58.63 support. This would likely invalidate any short-term bullish outlook.
Should I consider buying XAGUSD at current levels near $58.80 given the daily oversold Stochastic?
While the daily Stochastic is oversold, the strong bearish trend indicated by the daily ADX at 41.41 suggests caution. A confirmed break above $59.10 resistance would be needed to signal a more reliable buying opportunity, otherwise, it might be a bear trap.
Is the RSI at 37.01 on the daily chart a strong sell signal for XAGUSD?
An RSI below 40 generally indicates bearish momentum, but it's not a direct sell signal on its own. Combined with the strong ADX (41.41) and negative MACD, it reinforces the bearish sentiment, suggesting that rallies are likely to be met with selling pressure.
How will the upcoming US economic data releases affect XAGUSD this week, given the current technical picture?
Any data releases pointing towards a stronger US economy or a hawkish Fed stance could strengthen the dollar and further pressure XAGUSD, potentially leading to a test of daily support levels like $56.43. Conversely, weaker data might offer temporary relief but is unlikely to change the trend without technical confirmation.
Track markets in real-time
AI-powered analysis, technical indicators and real-time price data.
Join Our Telegram Channel
Breaking market news, AI analysis and trading signals instantly.
Join Channel