Is USDJPY poised for another leg higher, or are we on the cusp of a significant pullback? This pair is currently locked in a tense battle around the $161.77 mark, a level that's becoming increasingly critical. The bulls have been pushing, fueled by a generally stronger dollar sentiment and specific yen weakness, but the bears are showing signs of life as key resistance zones loom. Navigating this choppy waters requires a keen eye on both the micro-movements and the macro undercurrents that are shaping the USDJPY narrative today. This isn't just another trading day; it's a potential inflection point that could define the near-term trajectory for this major currency pair.
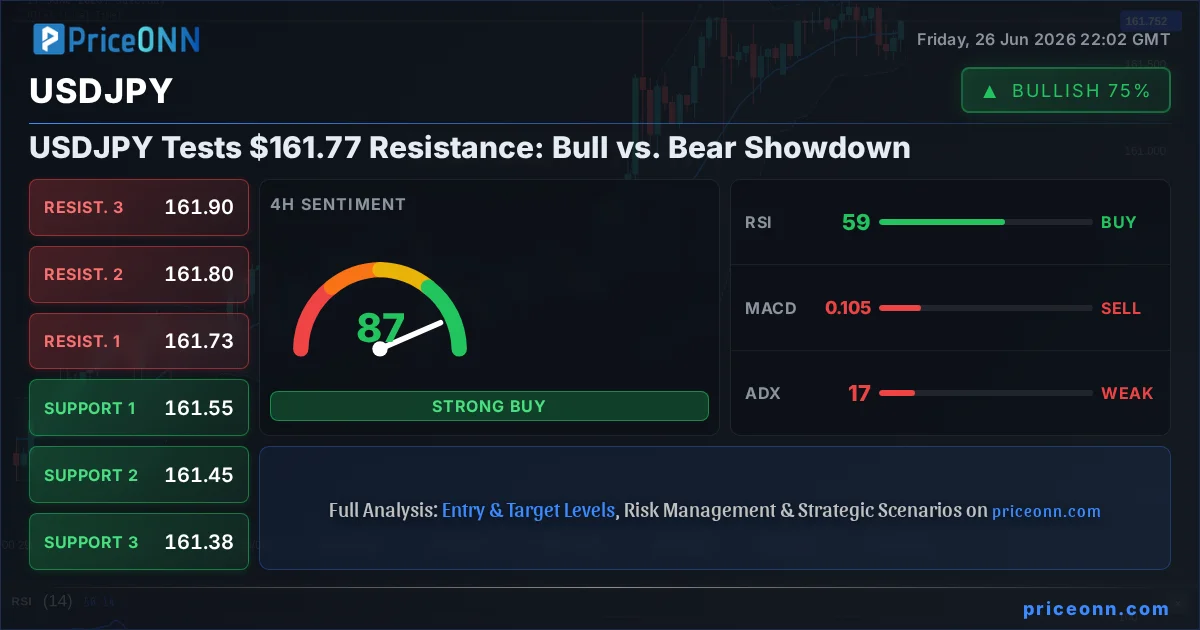
- USDJPY is currently trading at $161.77, facing resistance near this level.
- The 1-Day chart shows a strong bullish trend (92% strength) with RSI at 71.88, indicating potential overbought conditions.
- Key support is identified at $161.57, while resistance lies around $161.96.
- The DXY (Dollar Index) is at 101.38, showing a mixed signal with a strong daily trend but weaker intraday momentum.
The Bull Case: Yen Weakness Persists
The argument for further upside in USDJPY hinges on the continuation of yen weakness, a theme that has been dominant for an extended period. On the 1-hour chart, the trend is neutral but shows a strong 'AL' (Buy) signal across multiple indicators, with RSI at 55.21 and MACD displaying positive momentum. This suggests that intraday traders are leaning towards buying dips. The stochastic oscillator is in overbought territory (K=91.81, D=80.81), which typically signals a potential reversal, but in a strong trend, this can persist for a while. The ADX at 18.85 indicates a weak trend, suggesting consolidation or choppiness, but the overall signal leans bullish. This short-term picture, while mixed, shows pockets of buying interest that could fuel a push towards higher resistance levels.
Looking at the 4-hour timeframe, the sentiment remains broadly positive for USDJPY, with a neutral trend but still a majority of 'AL' signals. RSI is at 58.61, comfortably in the neutral zone and suggesting room for further ascent before hitting overbought territory. The MACD is below its signal line, which might seem bearish, but the positive momentum indicated by the histogram could still support upward movement. The stochastic is showing a bearish crossover (K=33.87, D=43.21), but it's not in extreme territory, so it might not signal a strong reversal. The ADX here is 16.7, again pointing to a weak trend, reinforcing the idea of range-bound trading or a slow grind higher. This suggests that while the immediate pressure might not be overwhelmingly bullish, the lack of strong selling conviction allows the bulls to maintain control, especially if broader market sentiment favors risk assets or continued dollar strength.
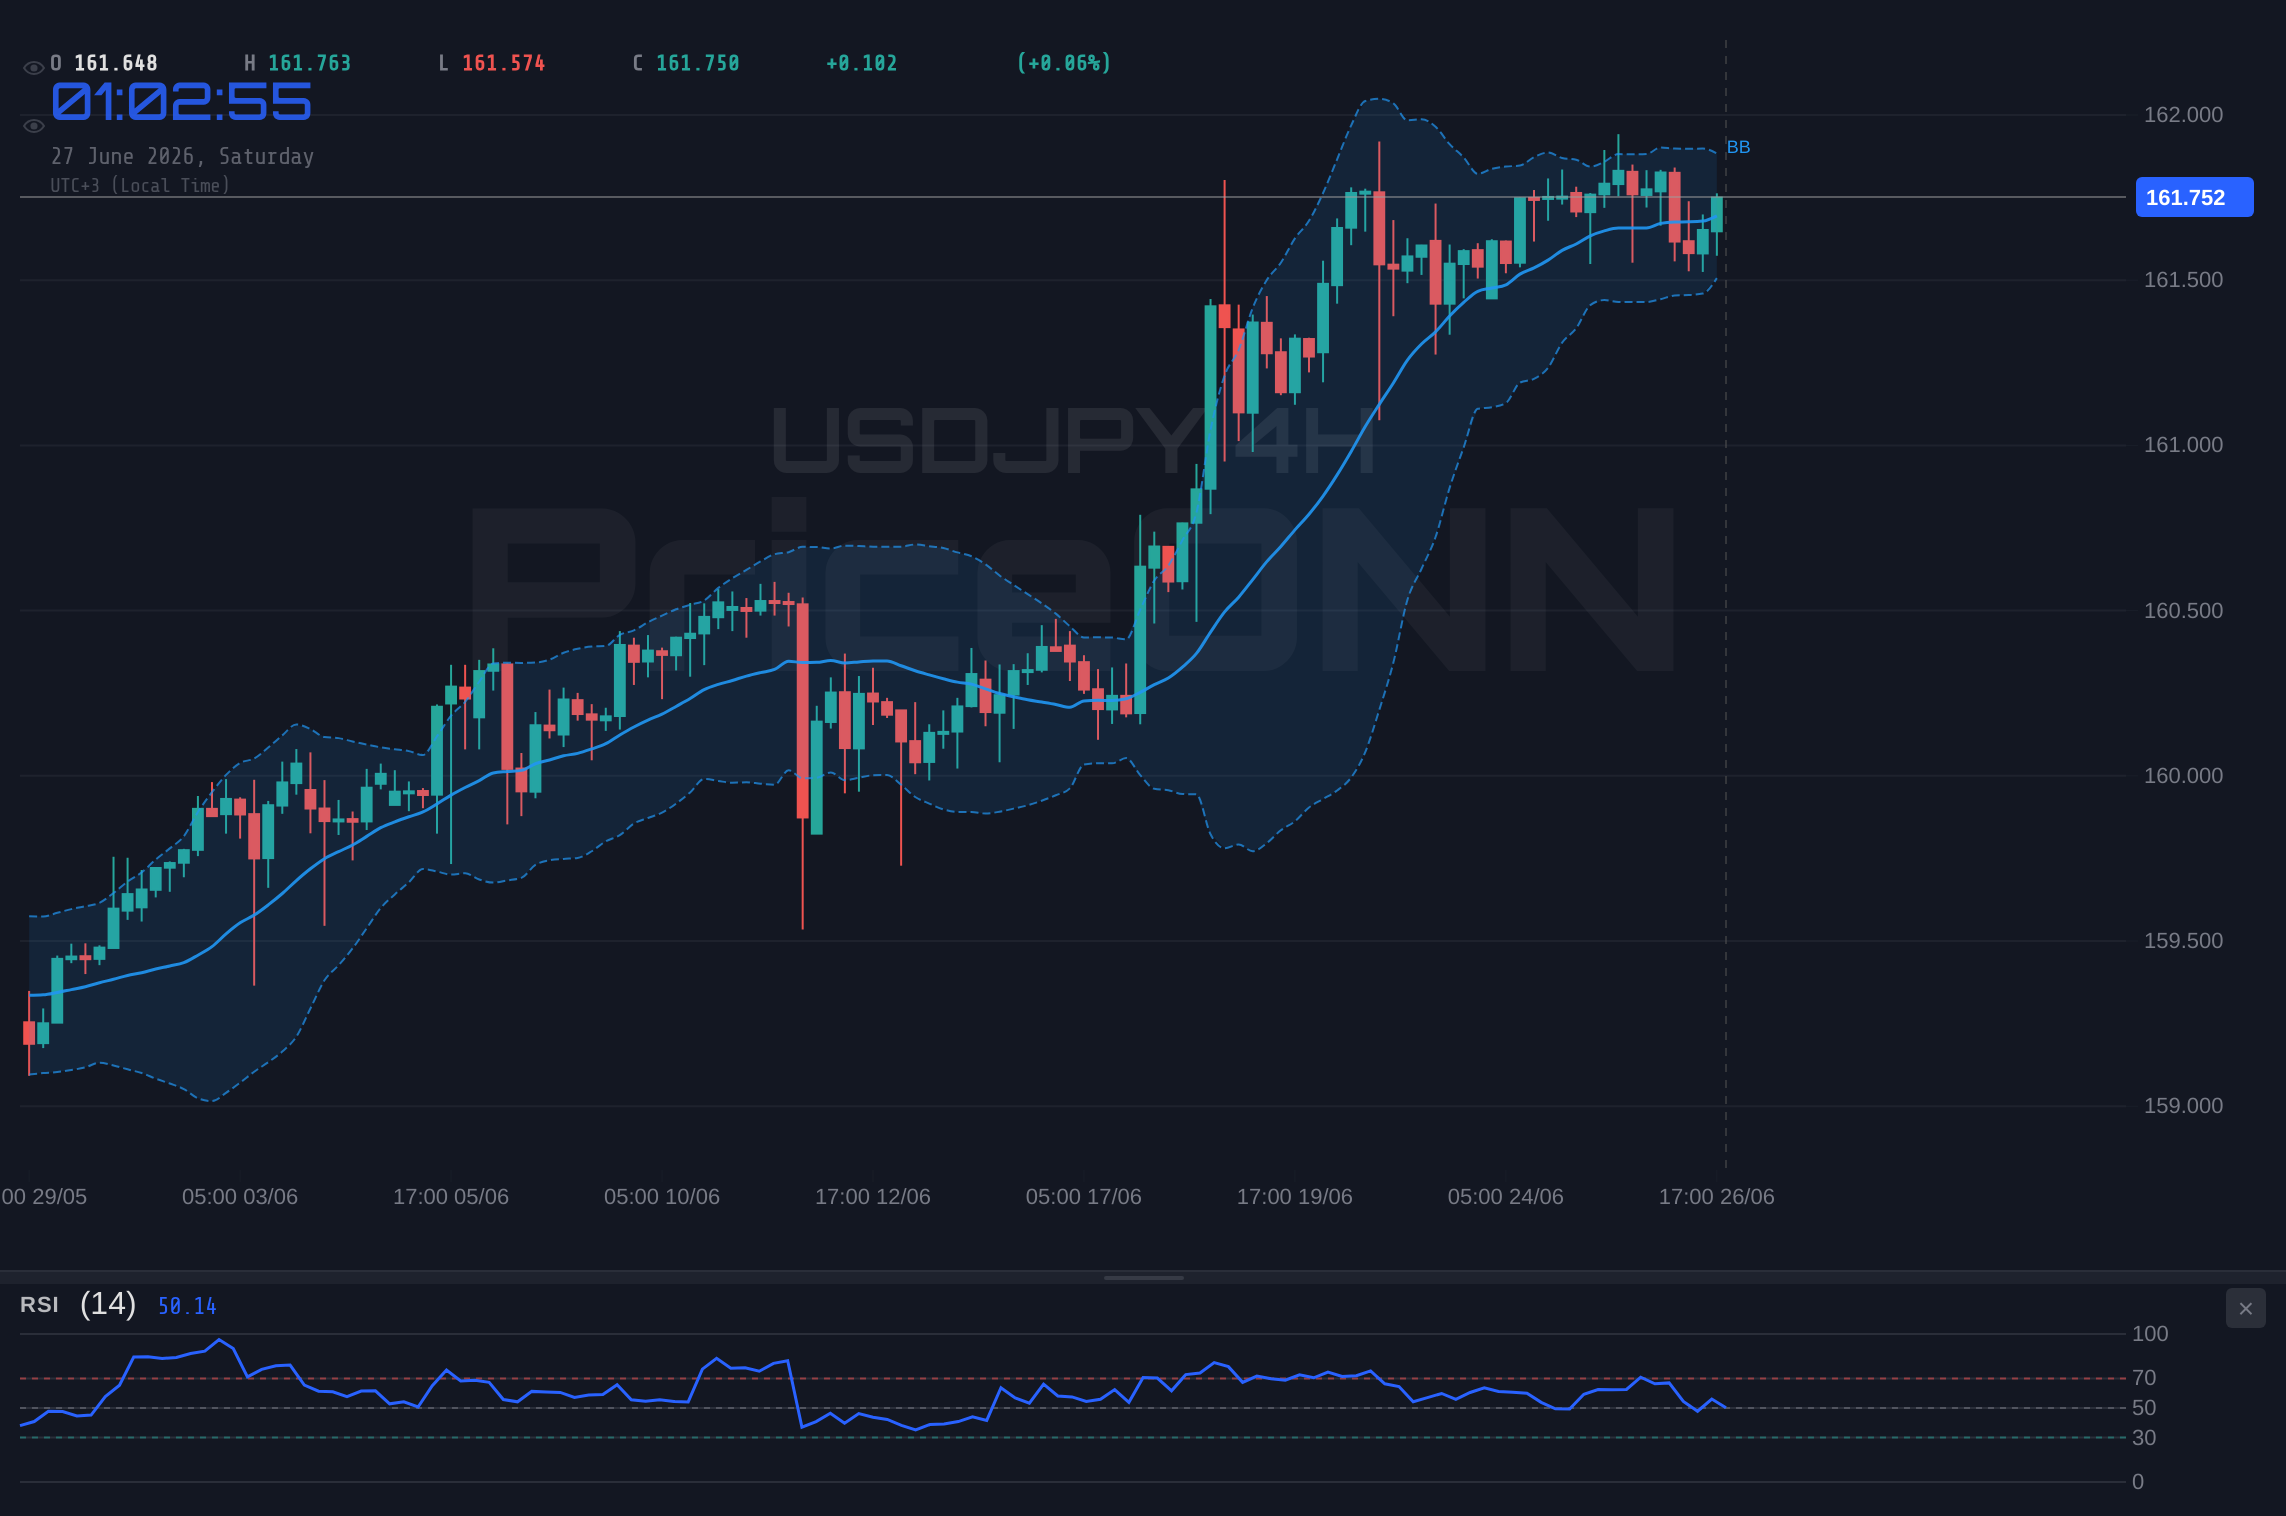
The daily chart paints a more compelling picture for the bulls, despite the current consolidation around $161.77. The trend is classified as bullish with a strong 92% power, and the RSI at 71.88 is firmly in overbought territory. While this often precedes a correction, it can also signal significant underlying strength. The MACD is positive and above its signal line, confirming bullish momentum on the daily scale. The stochastic is also in the overbought zone (K=91.87, D=85.24), reinforcing the idea that the asset is trading at the upper end of its recent range. The ADX reading of 23.41 indicates a moderately strong uptrend. This combination of a daily bullish trend, overbought conditions that can persist, and positive momentum suggests that any pullbacks might be opportunities for buyers to step in, anticipating a continuation of the broader trend towards new highs, especially if the Bank of Japan continues to signal a dovish stance or if US interest rate expectations remain elevated.
Furthermore, the broader macroeconomic backdrop, particularly the actions and statements from the US Federal Reserve, plays a crucial role. Recent PCE inflation data showed a slight cooling, which has tempered some expectations of aggressive Fed rate hikes. However, the overall narrative still points towards higher-for-longer interest rates in the US compared to Japan, where monetary policy is expected to remain accommodative for some time. This interest rate differential is a fundamental driver of USDJPY strength. As long as this gap persists, the pressure on the yen to weaken against the dollar remains significant. The news that the US Dollar Index (DXY) is trading around 101.38, despite some intraday weakness, still reflects a dollar that is broadly supported against a basket of currencies, which indirectly bolsters USDJPY.
The Bear Case: Yen Intervention Fears and Technical Headwinds
On the flip side, the argument for a potential reversal or significant pullback in USDJPY is equally valid, primarily driven by technical headwinds and the ever-present threat of currency intervention by Japanese authorities. The 1-hour chart, while showing 'AL' signals, also flags overbought stochastic levels and a weak ADX, indicating potential for a stall or reversal. The price is currently bumping against immediate resistance at $161.765 and $161.800. A failure to decisively break and hold these levels could trigger profit-taking and a move back towards the support at $161.699.
The 4-hour chart presents a more concerning picture for the bulls. While the overall signal is still leaning 'AL', the ADX at 16.7 signals a weak trend, which is often a precursor to a reversal. The stochastic's bearish crossover (K=33.87, D=43.21) suggests that momentum might be shifting downwards, even if it's not in extreme territory. More importantly, the daily chart's overbought RSI (71.88) and stochastic (K=91.87, D=85.24) readings are flashing warning signs. Historically, when these indicators reach such extreme levels on the daily timeframe, a correction or consolidation phase often follows. The risk of Japanese authorities intervening to support the yen increases significantly as USDJPY climbs, particularly if it approaches psychologically important levels or shows signs of excessive, rapid appreciation. Such interventions, whether verbal or direct market action, can cause sharp, swift reversals.
The daily chart's technicals are a mixed bag but lean towards caution. While the overall trend is bullish (92% strength), the RSI at 71.88 and Stochastic at 91.87 are screaming 'overbought'. This suggests that the market might be due for a correction or a period of consolidation. The MACD, though positive, might be showing signs of flattening. The ADX at 23.41 confirms a trend, but coupled with the extreme oscillator readings, it implies that the trend might be losing steam and could be vulnerable to a reversal. The immediate resistance levels at $161.962, $162.148, and $162.355 are critical. A failure to overcome these levels could see USDJPY retreat towards the support zone starting at $161.569. The longer the pair consolidates below these resistance points, the higher the probability of a bearish move.
Furthermore, global risk sentiment can influence USDJPY. While the DXY is showing some weakness today, broader risk-off sentiment could see a flight to safety, which might benefit the yen as a safe-haven currency, despite its typical correlation with USD strength. News reports about potential intervention fears, as mentioned in some market commentary, add another layer of uncertainty. If the market perceives that Japanese authorities are becoming increasingly uncomfortable with the pace of yen depreciation, they might step in, leading to sharp volatility. The fact that the price is currently hovering around $161.77, a level that has seen previous consolidation, suggests that market participants are cautious and waiting for a clearer signal before committing to a significant directional move.
Technical Crossroads: Indicators in Conflict
The technical indicators present a complex, often conflicting, picture across different timeframes, highlighting the current indecision and the battle between bulls and bears. On the 1-hour chart, we see a mix: RSI is neutral (55.21), MACD shows positive momentum, but stochastic is overbought (K=91.81) and the ADX is weak (18.85). This suggests intraday traders are active, but the trend isn't strongly defined, leading to potential volatility around immediate levels like $161.765 resistance and $161.699 support.
The 4-hour timeframe offers a slightly more bearish lean in terms of trend strength indicators. The ADX at 16.7 signals a weak trend, which is not ideal for sustained moves. However, the overall signal is still leaning towards 'AL'. The stochastic shows a bearish crossover, and RSI is in the neutral zone at 58.61. This timeframe suggests that while the dominant daily trend might be up, the intermediate-term momentum is not strongly confirming it, creating a potential for range-bound trading or a short-term pullback. The key levels here are support at $161.552 and resistance at $161.726, with a broader range extending to $161.962.
The daily chart, as discussed, shows a strong bullish trend but with significant overbought conditions on RSI (71.88) and Stochastic (91.87). This is the core of the dilemma: a strong trend versus extreme readings that typically precede a reversal. The MACD is positive, supporting the trend, but the ADX at 23.41 indicates a trend that, while present, isn't overwhelmingly strong. This suggests that the market is at a critical juncture. A decisive break above the daily resistance at $161.962 could signal a continuation of the bullish trend, potentially targeting higher levels. Conversely, a failure to break through and a subsequent fall below the daily support at $161.569 could trigger a more significant correction, especially if intervention fears or a shift in macro sentiment come into play.
Correlation analysis provides further context. The DXY is currently at 101.38, showing a daily trend that is bullish but with some intraday weakness. This typically supports USDJPY, but the conflicting signals within the DXY itself (e.g., weaker intraday momentum versus strong daily trend) mirror the indecision seen in USDJPY. If the DXY were to break decisively above its daily resistance, it would likely lend further support to USDJPY. Conversely, a break below its daily support could signal broader dollar weakness, potentially dragging USDJPY lower. Equity markets, such as the S&P 500 at 6572.87 and Nasdaq at 28998.91, are also showing mixed signals, with the S&P 500 up but Nasdaq down significantly on the 1-hour chart. This mixed risk appetite adds another layer of complexity, as a strong risk-on sentiment could favor USDJPY, while a risk-off move might see yen strength emerge.
The Verdict: Cautious Optimism Amidst Resistance
The market is currently at a pivotal point for USDJPY, trading around $161.77. The bulls have built a strong case based on the daily bullish trend and the persistent interest rate differential favoring the US dollar over the Japanese yen. The 1-hour and 4-hour charts show pockets of buying interest and momentum that could push the price higher. However, the bears have equally valid concerns, primarily centered around the extreme overbought conditions on daily indicators, the weak trend signals on shorter timeframes, and the ever-present risk of Japanese authorities intervening to curb yen weakness. The resistance levels around $161.96 and $162.15 are formidable barriers that need to be convincingly breached for the bullish thesis to remain intact.
Given the conflicting signals and the critical resistance zone, the most prudent approach is one of cautious optimism. The underlying bullish trend is undeniable on the daily chart, but the short-term indicators and the proximity to key resistance levels warrant a degree of vigilance. A decisive break above $161.96, supported by strong volume and sustained DXY strength, could open the door for further gains. Conversely, a failure to break this resistance, coupled with any signs of intervention or a shift in risk sentiment, could lead to a sharp pullback towards the $161.57 support. Traders should be looking for confirmation: either a clean breakout above resistance or a clear breakdown below support, rather than trying to anticipate the move in this current choppy environment.
The current price action around $161.77 suggests a market in equilibrium, where both buyers and sellers are hesitant to commit large positions. This is often a precursor to a significant move once a trigger level is breached. The key is patience and risk management. For those looking to capitalize on the bullish trend, waiting for a confirmed break above resistance with follow-through might be the safest strategy. For those anticipating a reversal, watching for a break of support or clear bearish divergence on intraday charts could offer an entry. Until then, expect continued volatility and choppiness as the market weighs the fundamental drivers against the technical limitations and the ever-present threat of intervention.
Bullish Scenario: Breakout Above Resistance
60% ProbabilityNeutral Scenario: Consolidation Around $161.77
25% ProbabilityBearish Scenario: Intervention Fears or Technical Reversal
15% ProbabilityFrequently Asked Questions: USDJPY Analysis
What happens if USDJPY breaks decisively above the $161.96 resistance level?
A sustained break above $161.96, especially on the daily chart, would likely confirm the continuation of the bullish trend. This could trigger further buying, potentially pushing USDJPY towards our first target of $162.355, and possibly even towards the psychological level of $163.000.
Should I consider buying USDJPY at the current $161.77 levels, given the RSI is at 71.88?
Buying directly at $161.77 with RSI at 71.88 on the daily chart carries significant risk due to overbought conditions. While the trend is bullish, a pullback is possible. A more prudent approach would be to wait for a confirmed breakout above $161.96 or a pullback to a key support level like $161.57, where risk/reward might be more favorable.
Is the stochastic's overbought reading of K=91.87, D=85.24 a strong sell signal for USDJPY?
While extreme readings on the stochastic (like 91.87/85.24) often signal overbought conditions and potential reversals, they can persist in strong trends. On the daily chart, this indicates caution is warranted, but it's not an immediate sell signal on its own. Confirmation from price action, like a break below support or bearish divergence, would be needed for a stronger bearish conviction.
How will the current DXY weakness around 101.38 affect USDJPY's trajectory this week?
The DXY's current level around 101.38 shows some intraday weakness, which typically puts downward pressure on USDJPY. However, the DXY's daily trend remains strong, suggesting this weakness might be temporary. If DXY continues to fall significantly, it could fuel a USDJPY pullback towards $161.57. Conversely, if DXY rebounds, it would likely support USDJPY's move towards resistance.
Track markets in real-time
AI-powered analysis, technical indicators and real-time price data.
Join Our Telegram Channel
Breaking market news, AI analysis and trading signals instantly.
Join Channel