As the market closed last Friday, the USDJPY pair was firmly positioned above the crucial $161.77 level, signaling that the bullish momentum that has characterized its recent trading action is far from over. This pivotal point represents more than just a number; it's a testament to the underlying strength driving the yen lower against the dollar. The past week saw significant price action, with the pair navigating key economic data releases and testing critical technical levels. Understanding the interplay between these factors is paramount for any trader looking to position themselves for the week ahead.
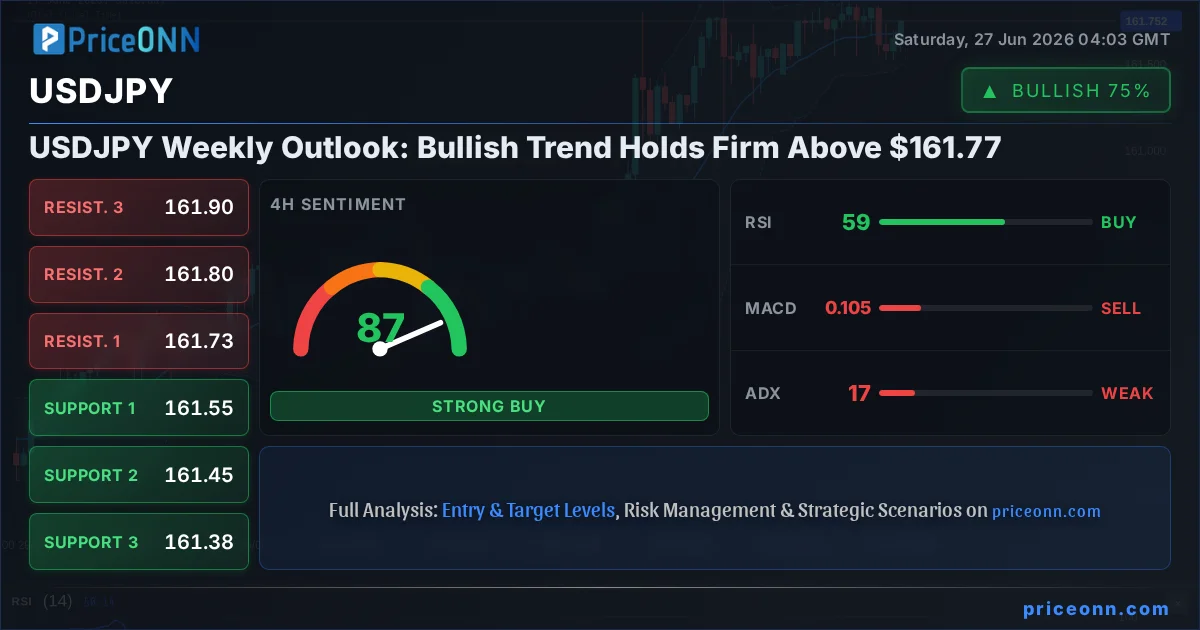
- USDJPY closed last Friday at $161.77, maintaining a strong bullish trend.
- The 1-Day RSI at 71.88 indicates overbought conditions, suggesting potential for a near-term pullback.
- Key resistance is identified at $161.96, with $161.57 acting as immediate support.
- The pair's correlation with the DXY, which is also showing bullish signs, reinforces the upward bias.
The narrative surrounding USDJPY has been dominated by the widening interest rate differential between the Bank of Japan (BOJ) and the U.S. Federal Reserve. While the Fed has maintained a hawkish stance, signaling a potential for delayed rate cuts, the BOJ continues to tread cautiously, maintaining its accommodative monetary policy. This divergence is the primary engine fueling the yen's weakness and, consequently, USDJPY's ascent. Last week's price action, despite some volatility, ultimately reinforced this trend, leaving bulls optimistic about further gains. The ability of the pair to hold above $161.77 heading into the new trading week is a significant bullish signal, suggesting that the underlying demand for dollars against the yen remains robust. This is a critical juncture, and how the market reacts to the upcoming economic data will be key in determining the next directional move.
The technical picture, when viewed across multiple timeframes, paints a compelling, albeit nuanced, story. On the 1-hour chart, the trend is identified as neutral with a 50% strength, yet the overall signal leans towards 'BUY' (7 buys, 1 sell). This suggests short-term fluctuations might occur, but the prevailing sentiment favors upside. The RSI(14) at 55.21 is comfortably in neutral territory, indicating room for further upward movement without immediate overbought concerns on this very short timeframe. However, the MACD is showing positive momentum, which is a good sign for intraday traders. The Stochastic Oscillator, with K at 91.81 and D at 80.81, is screaming 'overbought,' suggesting that any intraday trading should be cautious about chasing this particular timeframe's momentum too far. The ADX at 18.85 points to a weak trend on this timeframe, underscoring the potential for choppiness. This 1-hour view is more of a tactical snapshot rather than a strategic directional indicator.
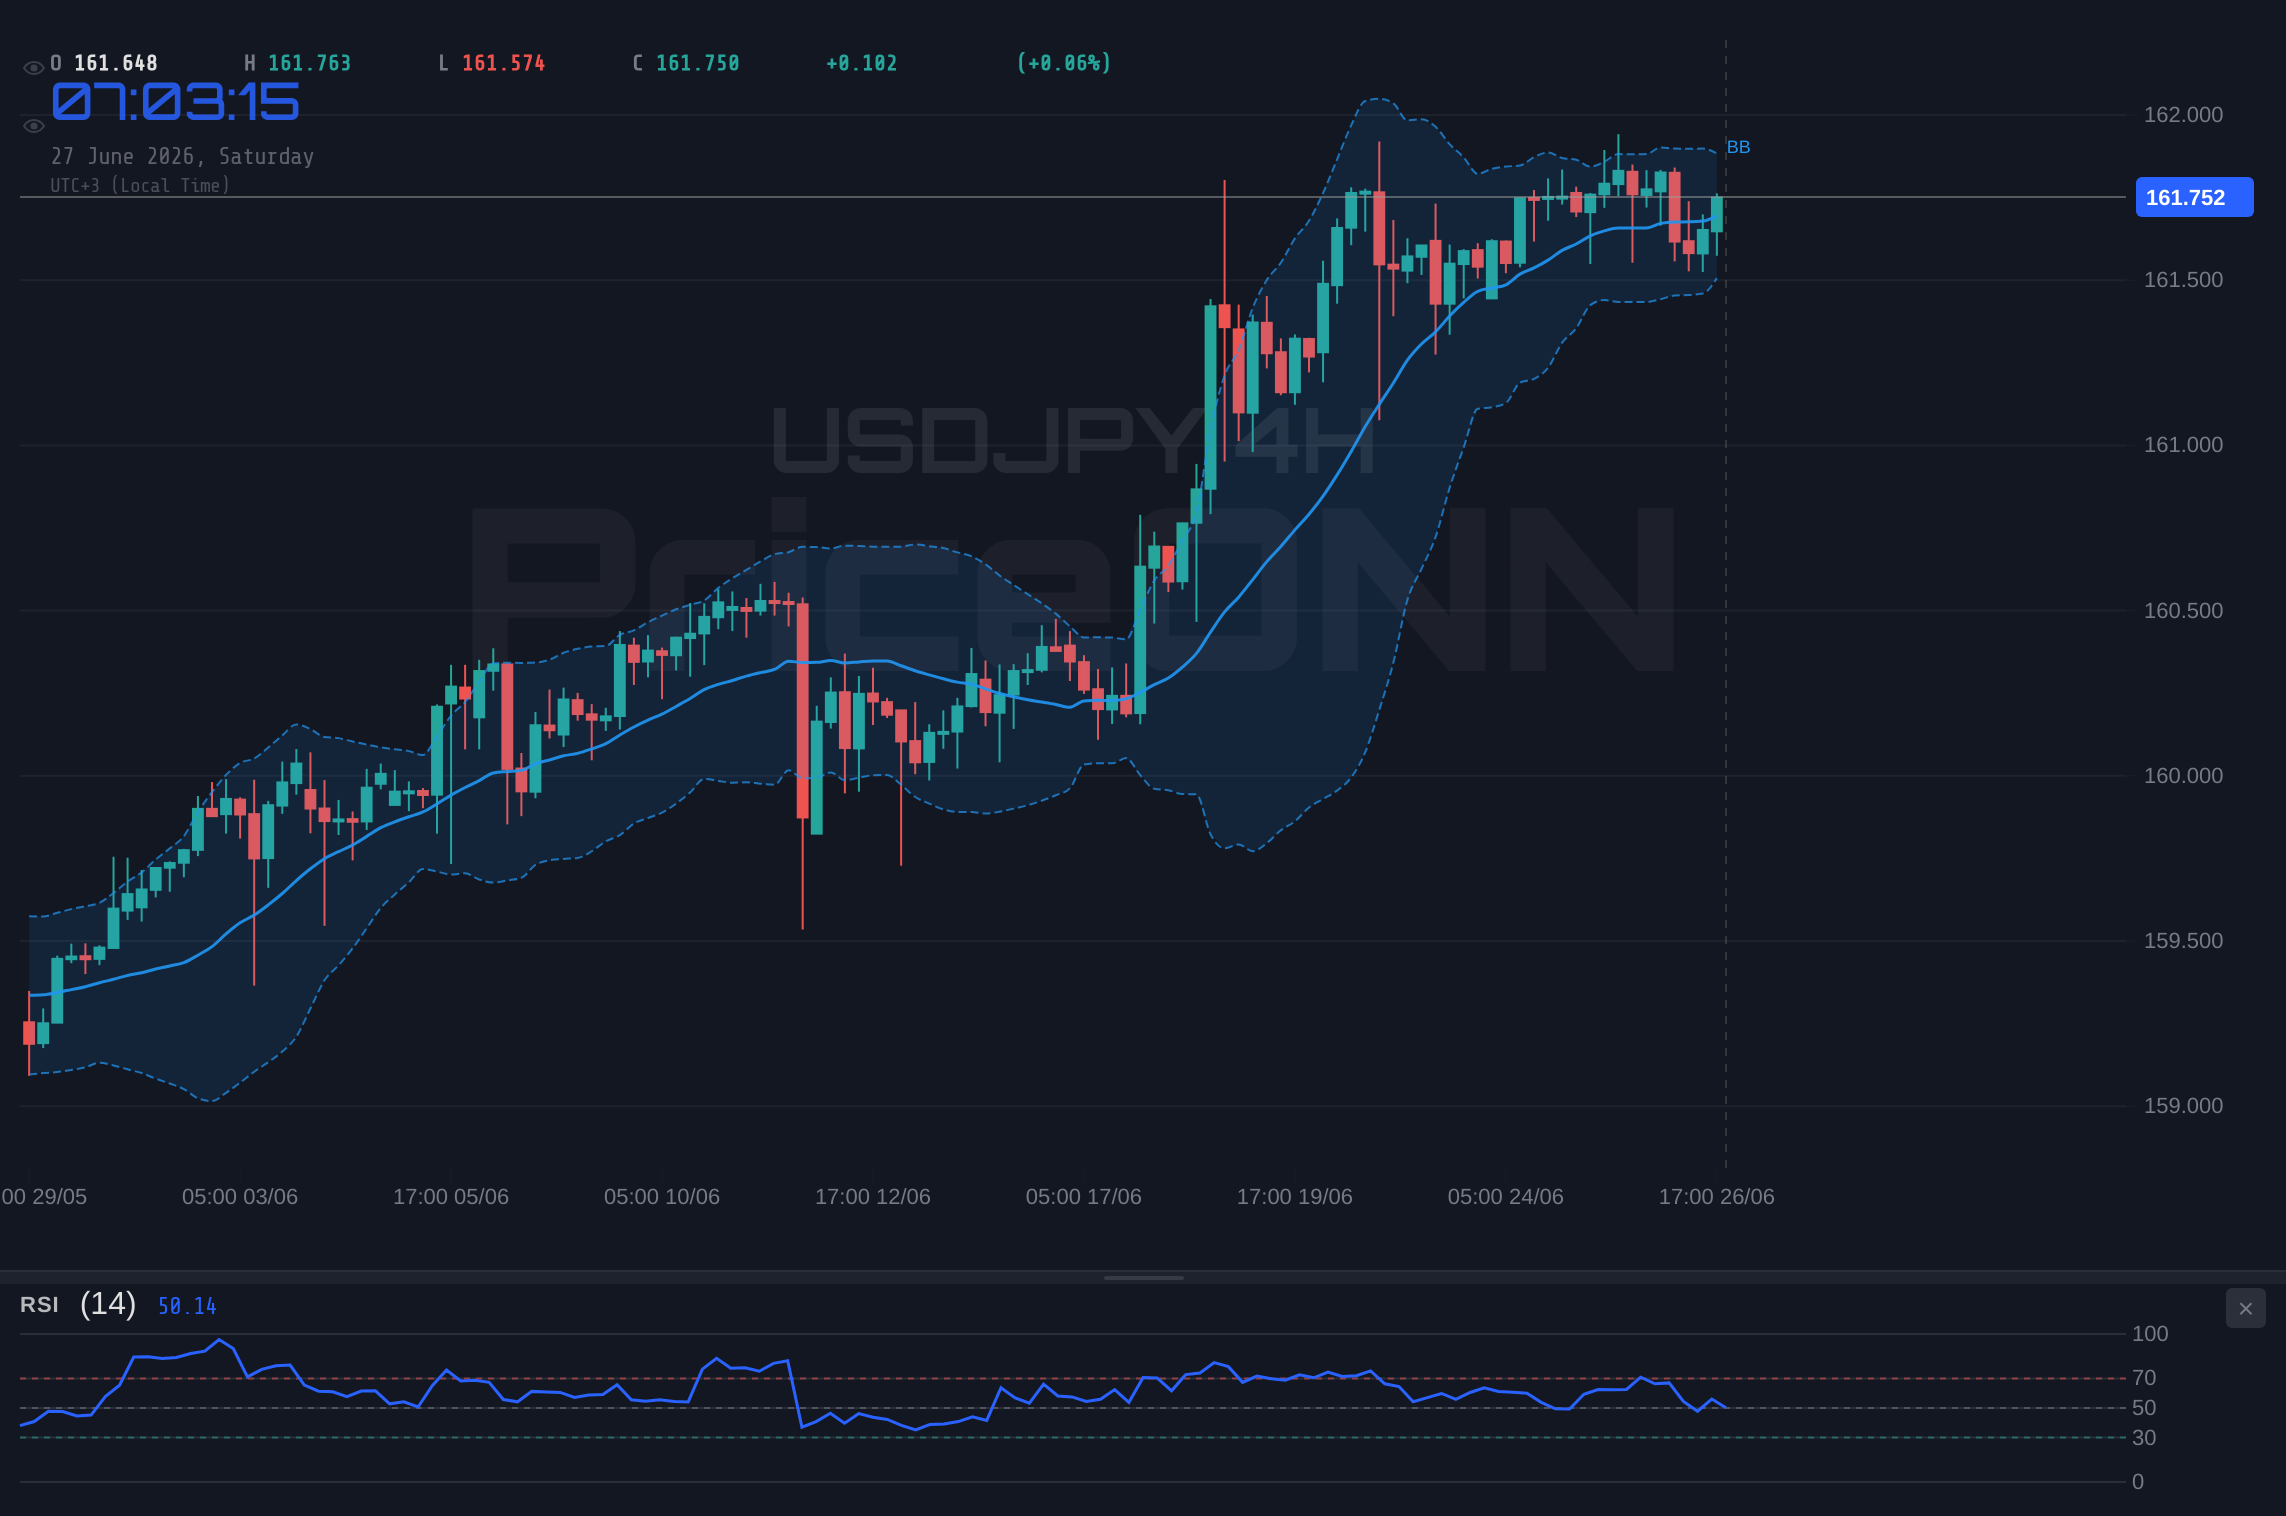
Shifting to the 4-hour timeframe, the trend is still considered neutral, but the strength is rated at 50%, with a 'BUY' signal (6 buys, 2 sells). This timeframe offers a slightly different perspective. The RSI(14) at 58.61 is still in neutral territory, but edging closer to the overbought zone. The MACD is showing negative momentum here, which contradicts the 1-hour view and hints at potential headwinds. The Stochastic Oscillator (K=33.87, D=43.21) is in oversold territory, signaling a potential for a bounce, but the MACD's bearish lean on this timeframe is a cautionary flag. The ADX at 16.7 reinforces the idea of a less-than-committed trend, suggesting that this timeframe might be experiencing consolidation or a pause in the broader move. It's crucial to note that on this timeframe, the overall signal is still bullish, but the conflicting indicators, particularly the MACD, warrant attention. This adds a layer of complexity, suggesting that short-term reactions might be counter to the longer-term trend.
However, the daily chart is where the strategic direction is most clearly defined, and it strongly favors the bulls. The trend is unequivocally bullish with a high strength of 92%. The current price of $161.77 sits comfortably above the daily support levels of $161.57, $161.36, and $161.18. The daily RSI(14) reading of 71.88, while indicating overbought conditions, is a classic sign in a strong uptrend. It suggests that the upward momentum is powerful, and while a pullback is possible, it doesn't negate the overall bullish narrative. The MACD is printing positive momentum, with the MACD line above the signal line, confirming the strength of the uptrend. Bollinger Bands show the price trading above the middle band, reinforcing the bullish sentiment. The Stochastic Oscillator, with K at 91.87 and D at 85.24, is deeply entrenched in overbought territory, signaling that the market is extended and susceptible to profit-taking. Yet, in a strong trend, overbought conditions can persist for extended periods. The ADX at 23.41 indicates a medium-strength uptrend, suggesting that while the trend is robust, it might not be accelerating at an extreme pace, leaving room for further appreciation. The overall signal on the daily chart is a resounding 'BUY' (5 buys, 2 sells, 0 neutral), underscoring the dominant trend.
The interplay between these timeframes highlights a common market scenario: shorter-term charts showing potential for consolidation or pullbacks, while the longer-term daily chart firmly establishes a bullish trend. This divergence is not necessarily a contradiction but rather a reflection of market dynamics. Traders often use shorter timeframes for tactical entries and exits within the framework of the longer-term trend. For USDJPY, this means that while dips might occur, the primary thesis remains tilted towards further appreciation as long as key support levels hold. The market sentiment, as reflected in the general 'BUY' signals across most indicators on the 1-hour and 4-hour charts, supports this view, even with the cautionary notes from oscillators like Stochastic and the ADX on certain timeframes. The strength of the daily trend, however, is the most compelling factor.
Delving deeper into the technical indicators, the RSI readings across the timeframes provide a fascinating contrast. The daily RSI at 71.88 is the most aggressive, signalling overbought conditions. This is often interpreted as a warning sign for reversal, but in a strong uptrend, it can simply indicate sustained buying pressure. On the 4-hour chart, the RSI at 58.61 is in a more neutral position, suggesting that there's still room for the rally to continue without hitting extreme overbought levels. The 1-hour RSI at 55.21 further supports this, indicating that on an intraday basis, there's little immediate concern about exhaustion. This divergence in RSI readings suggests that while the longer-term trend is robust, the shorter-term outlook might involve some consolidation or minor retracements before the next significant upward move. It’s a classic case of a strong trend showing signs of overheating on the longest timeframe, while shorter frames offer more tactical flexibility.
The MACD indicator offers a consistent, albeit not always aggressive, bullish signal across the daily and 1-hour timeframes. On the daily chart, the MACD line is above the signal line and the histogram is positive, confirming the strong uptrend. The 1-hour chart also shows positive MACD momentum, reinforcing the intraday bullish bias. However, the 4-hour MACD presents a slightly different picture, showing negative momentum. This contradiction might indicate a temporary pause or a minor correction phase on the 4-hour timeframe, which is not uncommon within a dominant daily uptrend. It’s important to interpret these signals in conjunction with the overall trend; a negative MACD on a 4-hour chart within a strong daily uptrend is more likely to be a temporary dip rather than a trend reversal signal. Traders might look for this negative momentum to dissipate and turn positive again, or for price action to confirm a bullish continuation from current levels.
The Stochastic Oscillator provides a strong signal of caution, particularly on the daily and 1-hour charts, both showing readings deep within overbought territory. The daily Stochastic (K=91.87, D=85.24) and the 1-hour Stochastic (K=91.81, D=80.81) are exceptionally high, suggesting that the pair is significantly overextended. This often precedes a period of consolidation or a sharp reversal. The 4-hour Stochastic, however, is showing a different pattern, with K at 33.87 and D at 43.21, indicating oversold conditions and a potential for a bounce. This conflicting signal from the Stochastic across different timeframes is a key point of analysis. It suggests that while the daily chart is screaming 'overbought,' the shorter-term charts might be anticipating a brief pause or even a minor correction. The market's reaction to these divergent signals will be critical. A sustained break above the Stochastics' overbought zones on the shorter timeframes could signal further upside, while a failure and subsequent fall could exacerbate any downward pressure originating from the daily overbought condition.
The ADX, or Average Directional Index, is a measure of trend strength. On the daily chart, the ADX is at 23.41, indicating a medium-strength uptrend. This is a healthy reading, suggesting the trend is significant but not yet at extreme levels that might suggest an imminent reversal due to exhaustion. The 1-hour ADX at 18.85 points to a weak trend, aligning with the idea of potential choppiness or ranging on the shortest timeframe. The 4-hour ADX at 16.7 also suggests a weak trend on that specific timeframe. These readings imply that while the overall direction is bullish on the daily chart, the intraday and medium-term trends are not as strongly defined, indicating that the upward move might not be a straight line. This is consistent with the overbought signals from the Stochastic and RSI on the daily chart; the trend is strong, but the journey might involve pauses and consolidations. Traders should interpret this as a sign to manage risk carefully, as the lack of strong trend definition on shorter timeframes can lead to whipsaws.
Considering the broader market context, the performance of the U.S. Dollar Index (DXY) is critically important for USDJPY. The DXY closed last week showing some bearish signs, trading below 101.50 after the PCE inflation data, which led to fading Fed rate hike odds. However, the 1-day chart for DXY shows a strong upward trend (strength 100%) with RSI at 71.59 in overbought territory and ADX at 40.81 indicating a strong uptrend. This mixed signal from the DXY itself mirrors the complexity seen in USDJPY. The immediate pressure on the DXY below 101.50 could theoretically weigh on USDJPY, but the longer-term bullish trend of the DXY, supported by its daily indicators, suggests that any pullback in the dollar might be temporary. The correlation between USDJPY and DXY is typically positive, meaning a stronger dollar usually supports USDJPY. If the DXY can overcome its near-term overbought conditions and continue its upward trajectory, it would provide a significant tailwind for USDJPY. Conversely, a sustained dip in the DXY could cap potential gains for USDJPY, even if the pair's internal technicals remain bullish.
Equity markets, particularly the S&P 500 and Nasdaq, also play a role in risk appetite. The S&P 500 closed last week with a strong upward move, showing a 1-day trend as 'Down' (strength 100%) but with a 'BUY' signal (2 buys, 5 sells, 0 neutral). This is a confusing mixed signal. The 4-hour chart shows a neutral trend (50% strength) with a 'BUY' signal (6 buys, 2 sells). The 1-hour chart shows a strong bullish trend (100% strength) with a 'BUY' signal (5 buys, 3 sells). The Nasdaq 100, on the other hand, showed a significant drop, with its 4-hour chart indicating a bearish trend (93% strength) and a 'SELL' signal (0 buys, 8 sells). This divergence suggests that while the broader market sentiment might be mixed, the tech-heavy Nasdaq's weakness could indicate a degree of risk aversion. Typically, a risk-off environment might see investors flocking to safe-haven assets, which could include the Japanese Yen, thus pressuring USDJPY. However, the persistent strength in USDJPY, despite Nasdaq's decline, suggests that the interest rate differential narrative is currently overpowering broader risk sentiment. This decoupling is noteworthy and warrants close observation.
The recent news flow also provides crucial context. Reports indicate that the Japanese Yen has been holding steady as traders remain on high alert for intervention. This suggests that while the Yen is weakening, Japanese authorities are actively monitoring the situation and could intervene to prop up the currency if the decline becomes too rapid or disorderly. The news that the Yen bears are turning cautious amid intervention fears and a bearish technical bias on AUD/JPY, and that USD/JPY kept bulls in the driver's seat with fresh gains ahead, highlights the ongoing tug-of-war. The fact that USD/JPY extended gains and traded above 161.50, with a key bullish trend line forming with support at 161.20, aligns with our technical analysis. The mention of intervention fears is a significant risk factor that could cap any further upside for USDJPY, especially if the pace of depreciation accelerates. This implies that while the technicals may support further gains, a sudden intervention could quickly alter the trajectory.
Looking ahead to the new week, the primary focus for USDJPY will remain on the interest rate differential and any hints from central banks regarding their future monetary policy paths. The Federal Reserve's stance on inflation and potential rate cut timelines will be closely watched. Any indication of a more hawkish tone could propel USDJPY higher, while signs of a quicker pivot to rate cuts might lead to a USDJPY pullback. From a technical standpoint, the key levels to watch will be the immediate support at $161.57 and the crucial resistance at $161.96. A decisive break above $161.96 could open the door for further upside towards $162.15 and potentially $162.36. Conversely, a failure to hold above $161.57 could see the pair retreating towards $161.36 and even $161.18. The overbought daily RSI and Stochastic readings suggest that any upside move might be met with profit-taking, increasing the probability of a test of these support levels. However, the strength of the daily uptrend, supported by positive MACD momentum and the broader DXY trend, suggests that dips might be seen as buying opportunities by market participants.
The market sentiment, as indicated by the aggregated signals, leans bullish, but with significant caveats due to conflicting indicators and overbought conditions on longer timeframes. The 1-hour and 4-hour charts show a 'BUY' signal with 7 and 6 buys respectively, while the daily chart is also predominantly bullish. However, the sheer number of 'SELL' signals appearing on the 4-hour and daily charts for other instruments like EURUSD, GBPUSD, AUDUSD, NZDUSD, and even WTI and Brent crude oil, suggests a potential for broader market risk aversion. If this risk-off sentiment were to intensify, it could lead to a flight to safety, potentially benefiting the Japanese Yen and creating headwinds for USDJPY, despite the current bullish technical setup. This highlights the importance of monitoring not just USDJPY in isolation, but also its correlation with global risk assets and safe havens.
The scenario analysis for USDJPY reflects the current market's delicate balance. The dominant bullish trend on the daily chart is undeniable, yet the overbought indicators and potential for intervention fears from Japanese authorities introduce significant risk. The bullish scenario hinges on the pair holding key support and pushing through resistance, while the bearish scenario anticipates a reversal driven by overbought conditions or intervention. The neutral scenario acknowledges the possibility of consolidation as shorter-term indicators clash with the longer-term trend. Traders must remain vigilant, paying close attention to the $161.57 support and $161.96 resistance levels, while keeping a close eye on any signs of intervention or shifts in central bank rhetoric.
The USDJPY pair presents a compelling technical picture heading into the new week. While the daily chart paints a strong bullish narrative, supported by a significant interest rate differential and positive momentum indicators, the overbought readings on the RSI and Stochastic oscillators, coupled with potential intervention risks and broader market risk sentiment, introduce a layer of caution. The ability to hold above $161.77 is a testament to the bulls' current control, but the path forward may not be a straight line. Traders should prepare for potential volatility, with key levels at $161.57 and $161.96 acting as critical reference points. As always, managing risk and waiting for clear setups will be paramount in navigating this complex market environment.
The market is cyclical, and while USDJPY has shown remarkable strength, conditions can change rapidly. The seeds of a potential pullback are present in the overbought indicators, but the powerful trend suggests that any dips might be short-lived unless fundamental catalysts shift dramatically. Patient traders will find opportunities by observing how key levels hold and how the interplay between global risk sentiment and central bank policies unfolds. The key is to remain disciplined, manage risk effectively, and wait for the market to provide a clear directional signal. Volatility creates opportunity, and those prepared to navigate these choppy waters with a sound strategy will ultimately be rewarded.
Bearish Scenario: Overbought Conditions Trigger Pullback
60% ProbabilityNeutral Scenario: Consolidation Around Key Levels
25% ProbabilityBullish Scenario: Trend Continuation Above Resistance
15% ProbabilityFrequently Asked Questions: USDJPY Analysis
What happens if USDJPY breaks below $161.57 support?
A decisive break below $161.57 could trigger a pullback towards $161.36 and potentially $161.18. This scenario is supported by the overbought daily RSI at 71.88 and conflicting signals on shorter timeframes.
Should I buy USDJPY at $161.77 given the daily RSI at 71.88?
Buying at $161.77 with an RSI of 71.88 carries risk due to overbought conditions. While the trend is bullish, a pullback is more probable than immediate gains. A probability of 60% suggests a bearish scenario is more likely from current levels without further confirmation.
Is the Stochastic Oscillator at 91.87 a strong sell signal for USDJPY?
The Stochastic Oscillator at 91.87 on the daily chart is deep in overbought territory, signalling extreme extension. While it suggests a potential for reversal or consolidation, it doesn't guarantee a sell-off in a strong uptrend. Confirmation from price action or other indicators is needed.
How will the DXY's movement affect USDJPY this week?
The DXY's daily trend is strongly bullish, despite recent dips. As the DXY strengthens, it typically supports USDJPY. If the DXY can overcome its overbought readings and continue higher, it would likely fuel further gains in USDJPY, reinforcing the bullish bias.
| Indicator | Value | Signal | Interpretation |
|---|---|---|---|
| RSI (14) | 71.88 | Overbought | Daily RSI indicates extreme extension, suggesting potential for profit-taking or reversal. |
| MACD Histogram | +0.23 | Bullish Momentum | Positive and growing histogram confirms upward momentum on the daily chart. |
| Stochastic | K: 91.87, D: 85.24 | Overbought | Both %K and %D are in extreme overbought territory, highlighting market extension. |
| ADX | 23.41 | Medium Strength Trend | Indicates a solid uptrend, but not at extreme levels that would suggest an imminent reversal. |
| Bollinger Bands | Middle Band | Above Mid Band | Price trading above the middle band reinforces the bullish sentiment. |
Track markets in real-time
AI-powered analysis, technical indicators and real-time price data.
Join Our Telegram Channel
Breaking market news, AI analysis and trading signals instantly.
Join Channel