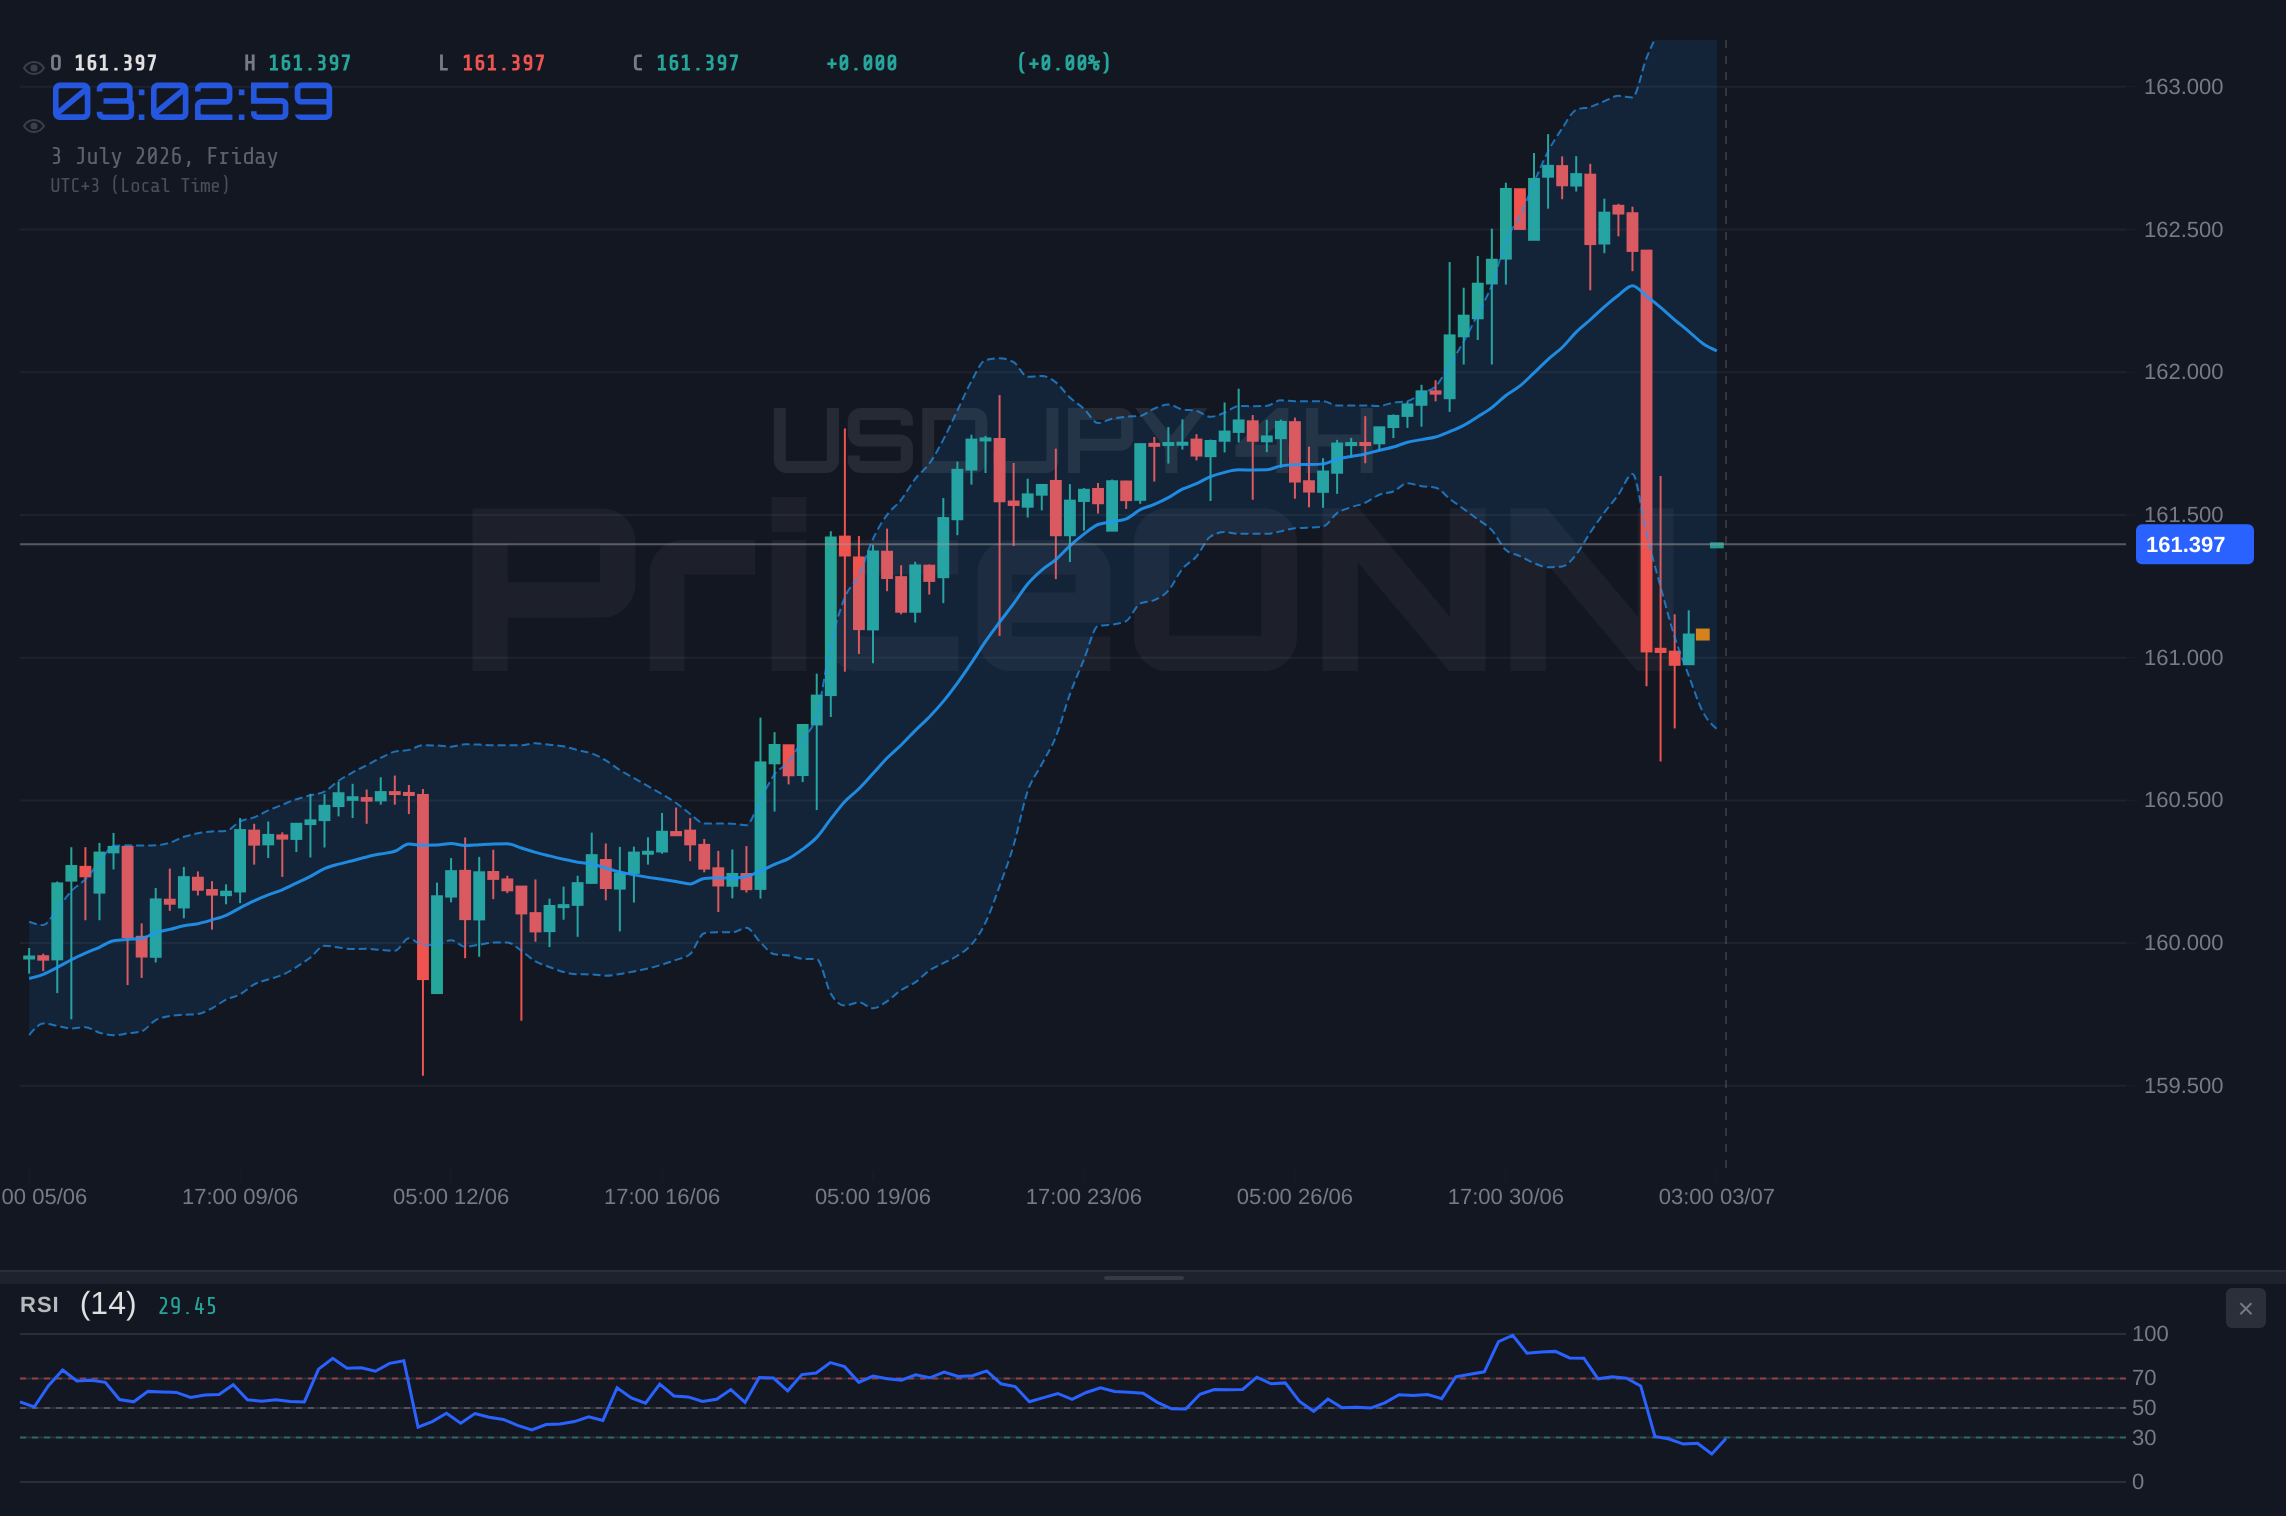
The persistent strength in USDJPY has brought the pair to a significant juncture, currently testing resistance levels near the $161.43 mark. This isn't just another trading day for the dollar-yen pair; it's a pivotal moment where the confluence of strong short-term technical indicators clashes with a more neutral, yet potentially shifting, daily outlook. For traders and analysts alike, understanding the nuances of this technical setup is paramount to navigating the potential volatility ahead. The question on everyone's mind is whether the current upward momentum has the legs to break through established resistance, or if we're poised for a pullback, offering a chance to reassess the landscape.
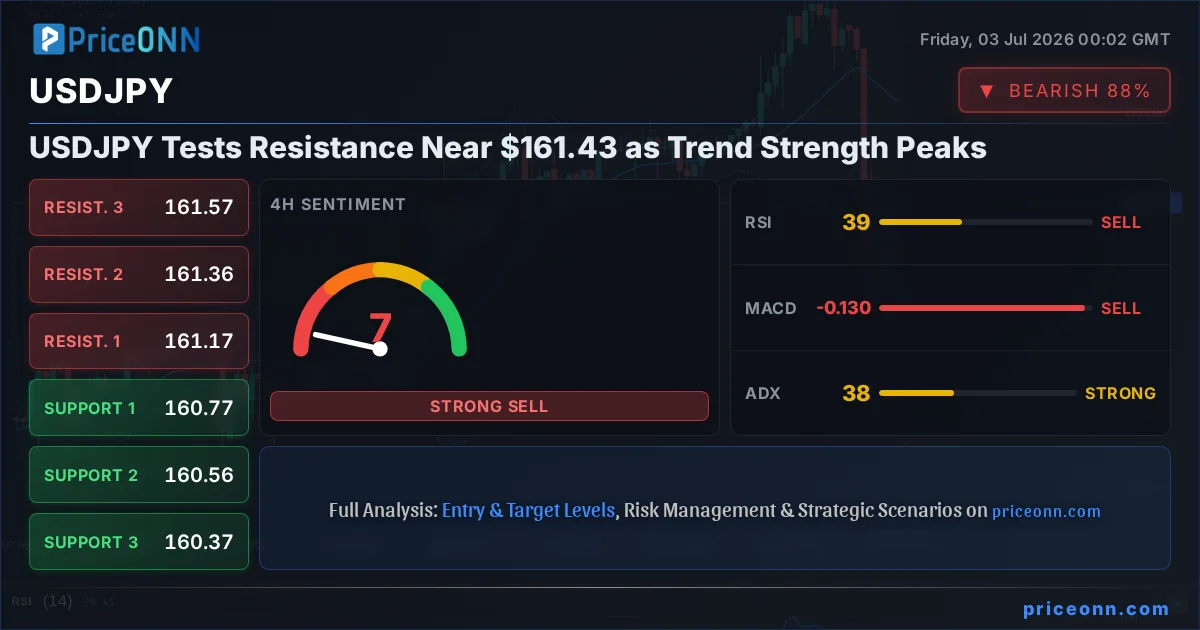
- USDJPY is currently trading near $161.43, testing significant resistance.
- The 1H chart shows a strong bullish trend (ADX 57.56), but the 1D chart signals a neutral trend with a bearish bias (ADX 41.65).
- RSI readings are mixed: 47.61 on 1H (falling momentum) and 39.49 on 4H (falling momentum), suggesting caution despite the price action.
- Key levels to watch: Resistance at $161.575, Support at $160.885. A close above R1 could target $162.013.
- Market sentiment is cautious, with DXY showing a mixed trend and equities like Nasdaq experiencing a notable dip.
Having tracked USDJPY through its recent rallies, it's clear that the current price action demands close attention. The pair has been on a remarkable ascent, driven by the widening interest rate differential between the Bank of Japan (BoJ) and the Federal Reserve (Fed). While the 1D chart might paint a picture of a neutral trend, the underlying strength on the shorter timeframes, particularly the 1-hour chart with its ADX reading of 57.56, cannot be ignored. This suggests that despite broader market indecision, there's a significant directional push currently at play. However, as we'll explore, conflicting signals from indicators like RSI and Stochastic across different timeframes suggest that this bullish conviction might be tested.
The current price of $161.43 sits just below the immediate 1-hour resistance at $161.575. This level is critical because a sustained break above it could confirm further upside potential. The 1-hour chart's ADX at 57.56 indicates a very strong trend, but the RSI at 47.61 suggests that momentum might be waning, or at least not accelerating. This divergence is a classic sign that a strong trend might be nearing a pause or reversal. Furthermore, the Stochastic Oscillator on the 1H is showing K=88.14 and D=57.06, indicating an overbought condition and a potential bearish crossover signal, even as the price hovers near resistance.
Delving deeper into the 4-hour timeframe, the picture becomes more complex. The ADX here is lower at 37.53, still indicating a strong trend, but the RSI at 39.49 reinforces the notion of falling momentum. The Stochastic Oscillator is in oversold territory with K=23.69 and D=30.46, presenting a potential buy signal that seems at odds with the price action and the 1H chart's overbought conditions. This conflict across timeframes and indicators is precisely why caution is warranted. The 4-hour trend is also categorized as neutral, despite the strong ADX, highlighting the battle between short-term strength and longer-term indecision.
Navigating the Daily Crossroads
When we zoom out to the daily timeframe, the narrative shifts again. The USDJPY pair is technically in a neutral trend, with an ADX of 41.65, which still denotes a strong trend, but the overall signal is balanced. The RSI is at 57.33, indicating a neutral-to-slightly-bullish sentiment, but it's the MACD histogram, which is positive and above the signal line, that points towards building positive momentum. However, the Bollinger Bands are positioned below the middle band, suggesting a bearish lean on this timeframe. This daily picture underscores the current indecision in the market; while there's underlying strength, it's not yet a clear signal for a sustained move in either direction.
The interplay between the Dollar Index (DXY) and USDJPY is also crucial. Currently, the DXY is showing a mixed trend on the 1H and a strong downtrend on the 4H, while exhibiting a strong uptrend on the daily. This conflicting data for the dollar index mirrors the USDJPY's own technical picture. If the DXY were to break decisively lower, it would typically put downward pressure on USDJPY, assuming the yen's safe-haven status remains intact. Conversely, a strengthening DXY would likely fuel further gains in USDJPY. With the DXY at $100.98, hovering near a critical resistance on its 1H chart and below its daily middle band, its next move will significantly influence USDJPY.
In the broader market context, the performance of major equity indices adds another layer of complexity. The Nasdaq, for instance, is showing a clear downtrend on its 1H and 4H charts, with significant daily losses. This risk-off sentiment in the tech sector could, in theory, boost demand for the Japanese yen as a safe-haven asset, potentially capping USDJPY's upside. However, the dominant factor driving USDJPY has been the interest rate differential, which often overrides traditional safe-haven flows. The S&P 500, while showing a neutral 4H trend, also has a strong daily downtrend, further painting a picture of caution in the broader risk appetite.
The Influence of Economic Data and Central Bank Talk
Looking beyond the charts, the fundamental drivers remain potent. The divergence in monetary policy between the Fed and the BoJ continues to be the primary narrative. While the Fed has signaled a more hawkish stance, keeping interest rates elevated to combat stubborn inflation, the BoJ has maintained its ultra-loose monetary policy. Recent news from July 2nd, [forex] 'Will USDJPY Reach 200 Without Intervention?', highlights the ongoing debate about potential intervention if the yen weakens too drastically. This possibility of intervention adds a layer of risk that technical analysis alone cannot fully capture.
Furthermore, the recent economic data releases play a significant role. While the provided data doesn't include specific NFP or inflation figures for USDJPY's context, general market reactions to such data are crucial. For example, a strong US Non-Farm Payrolls (NFP) report would typically bolster the dollar, potentially pushing USDJPY higher, while a weak report could lead to profit-taking and a yen strengthening. Conversely, any hints from the BoJ about a potential shift in policy, however subtle, could dramatically alter the pair's trajectory. The market is constantly digesting these macro signals, making the technical picture a dynamic representation of shifting expectations.
The current technical setup presents a classic tug-of-war. On one hand, the short-term charts show a determined bullish trend, pushing towards immediate resistance. On the other, the daily indicators and broader market sentiment suggest a more cautious approach is prudent. The RSI divergence across timeframes, the overbought Stochastic on the 1H, and the bearish lean from Bollinger Bands on the daily chart all point to a potential for a reversal or at least a significant consolidation phase. It’s this tension that creates trading opportunities, but also demands careful risk management.
The Case for Caution: Why $160.885 is Key
If USDJPY fails to break decisively above the $161.575 resistance, the immediate downside target becomes the $161.115 support level, followed by the more significant $160.885. A break below this latter level would invalidate the short-term bullish thesis and could signal a deeper correction. The ADX on the 1H, despite its high reading, would start to fall if the trend reverses, and a bearish crossover on the MACD would likely confirm the shift. The daily chart's neutral stance provides a backdrop where such a pullback could gain traction, especially if coupled with a strengthening yen or a weakening dollar driven by external factors.
The Bullish Outlook: Breaking $161.575
Conversely, a strong close above $161.575, ideally on increasing volume, could signal the continuation of the bullish trend. The next key resistance level to watch would be $162.013, followed by $162.286. On the daily chart, a sustained move above the middle Bollinger Band could also align with the shorter-term bullish signals, potentially re-energizing the trend. Confirmation would come from a rising RSI on the daily chart and a bullish crossover on the MACD, moving away from its current bearish lean. This scenario hinges on the market's continued belief in the Fed's hawkish stance and a potential weakening of the yen due to BoJ's accommodative policy.
Scenario Analysis and Probabilities
Bearish Reversal: Yen Strength Returns
65% ProbabilityConsolidation: Range-Bound Volatility
25% ProbabilityBullish Breakout: Momentum Continues
10% ProbabilityThe current technical picture for USDJPY is a fascinating case study in conflicting signals across multiple timeframes. While the 1-hour chart screams bullish trend with an ADX of 57.56 and buyers pushing towards $161.575, the daily indicators and broader market sentiment inject a healthy dose of caution. The RSI readings are particularly telling: 47.61 on the 1H and 39.49 on the 4H suggest that momentum is actually fading, despite the price push. This divergence is often a precursor to a trend stall or reversal. The Stochastic Oscillator on the 1H is also flashing an overbought signal, further supporting the idea that the current rally might be losing steam.
On the other hand, the 4-hour chart, while showing a strong ADX of 37.53, presents a more neutral picture overall. The RSI at 43.46 and the Stochastic in oversold territory hint at potential buying opportunities, but these signals are directly contradicted by the 1H chart's conditions. The daily timeframe is where the true indecision lies. A neutral trend with an ADX of 41.65, coupled with a daily RSI of 57.33, indicates that the larger market participants are not yet fully committed. The MACD showing positive momentum is a slight bullish nod, but the Bollinger Bands sitting below the middle band suggest underlying weakness. This complex tapestry of indicators means that any move is likely to be choppy until a clearer signal emerges.
The Role of Intervention and Macroeconomic Factors
The threat of currency intervention by Japanese authorities cannot be overstated. If USDJPY continues its ascent unchecked, particularly if it approaches levels like 165 or 200 as some speculate, direct intervention becomes a real possibility. Such an event could cause a sharp, sudden reversal, irrespective of technical patterns. This macro risk is a constant overhang for traders and is why managing risk via stop-losses is absolutely critical. The news on July 2nd, [forex] 'Will USDJPY Reach 200 Without Intervention?', directly addresses this concern, emphasizing the need for intervention and rate hikes to curb yen weakness.
Moreover, the performance of the US Dollar Index (DXY) remains a key correlation. With the DXY currently showing mixed signals across timeframes – strong uptrend on daily, but downtrend on 4H and 1H – its next move will be influential. If the DXY weakens significantly, it could drag USDJPY lower, especially if the yen's safe-haven appeal strengthens due to global risk aversion, as seen in the Nasdaq's recent dip. However, the overwhelming driver has been the interest rate differential, and any new commentary from the Fed regarding inflation or future rate hikes could easily reassert dollar strength and USDJPY's upward trajectory.
The key takeaway here is that while short-term technicals might suggest further upside, the confluence of mixed daily indicators, potential for intervention, and the complex global macro environment creates significant uncertainty. The levels around $161.43 and $161.575 are critical battlegrounds. A failure to decisively break higher here could lead to a sharp retracement, offering a different set of trading opportunities. Traders should remain vigilant, prioritizing risk management and waiting for clear confirmation before committing to large positions.
Frequently Asked Questions: USDJPY Analysis
What happens if USDJPY breaks above the $161.575 resistance level?
A sustained break above $161.575 on the 1-hour chart, confirmed by strong volume, could trigger further upside. The next resistance targets would be $162.013 and potentially $162.286. This scenario would align with the short-term bullish trend but would require confirmation from daily indicators like RSI moving higher.
Should I buy USDJPY at current levels near $161.43 given the mixed signals?
Buying at current levels carries significant risk due to conflicting signals across timeframes. The 1H chart shows overbought conditions and potential for a bearish crossover, while daily indicators suggest indecision. A more prudent approach might be to wait for a clear break above $161.575 or a pullback to support levels like $160.885 before considering a trade.
Is the RSI at 47.61 on the 1H chart a sell signal for USDJPY?
An RSI reading of 47.61 on the 1-hour chart indicates falling momentum, which is a bearish sign, especially when price is testing resistance. While not a direct sell signal on its own, it suggests that the current upward push may be losing steam and could precede a pullback or consolidation. Traders should look for confirmation from other indicators or price action.
How will the current DXY weakness affect USDJPY this week?
The DXY's current weakness, particularly on shorter timeframes, could theoretically put downward pressure on USDJPY. However, the dominant driver remains the interest rate differential. If the DXY continues to fall and risk aversion increases, the yen's safe-haven appeal might strengthen, leading to a USDJPY pullback towards $160.885. Conversely, any Fed hawkishness could override DXY weakness.
The path forward for USDJPY is far from clear-cut. While the short-term technicals show a strong bullish push towards immediate resistance near $161.43, the conflicting signals across different timeframes and the looming threat of intervention create a complex trading environment. The daily chart remains indecisive, and broader market sentiment, as reflected in equity indices, adds a layer of caution. Traders must remain disciplined, focusing on the key levels identified and managing risk meticulously. Patience is key; waiting for confirmation of a breakout or a clear reversal pattern will be crucial for navigating this potentially volatile pair effectively.
Track markets in real-time
AI-powered analysis, technical indicators and real-time price data.
Join Our Telegram Channel
Breaking market news, AI analysis and trading signals instantly.
Join Channel